Spatial variability of saturated hydraulic conductivity and its links with other soil properties at the regional scale - Nature
←
→
Page content transcription
If your browser does not render page correctly, please read the page content below
www.nature.com/scientificreports
OPEN Spatial variability of saturated
hydraulic conductivity and its
links with other soil properties
at the regional scale
Boguslaw Usowicz* & Jerzy Lipiec
Saturated hydraulic conductivity (K) is a key property for evaluating soil water movement and
quality. Most studies on spatial variability of K have been performed soil at a field or smaller scale.
Therefore, the aim of this work was to assess (quantify) the spatial distribution of K at the larger
regional scale in south-eastern Poland and its relationship with other soil properties, including
intrinsic sand, silt, and clay contents, relatively stable organic carbon, cation exchange capacity
(CEC) and temporally variable water content (WC), total porosity (FI), and dry bulk density (BD) in the
surface layer (0–20 cm). The spatial relationships were assessed using a semivariogram and a cross-
semivariogram. The studied region (140 km2) with predominantly permeable sandy soils with low
fertility and productivity is located in the south-eastern part of Poland (Podlasie region). The mean
sand and organic carbon contents are 74 and 0.86 and their ranges (in %) are 45–95 and 0.002–3.75,
respectively. The number of individual samples varied from 216 to 228 (for K, WC, BD, FI) to 691
for the other soil properties. The best fitting models were adjusted to the empirical semivariogram
(exponential) and the cross-semivariogram (exponential, Gaussian, or linear) used to draw maps with
kriging. The results showed that, among the soil properties studied, K was most variable (coefficient
of variation 77.3%) and significantly (p < 0.05) positively correlated with total porosity (r = 0.300) and
negatively correlated with soil bulk density (r = – 0.283). The normal or close to the normal distribution
was obtained by natural logarithmic and root square transformations. The mean K was 2.597 m day−1
and ranged from 0.01 up to 11.54 m day−1. The spatial autocorrelation (range) of K in the single (direct)
semivariograms was 0.081° (8.1 km), while it favourably increased up to 0.149°–0.81° (14.9–81 km) in
the cross-semivariograms using the OC contents, textural fractions, and CEC as auxiliary variables. The
generated spatial maps allowed outlining two sub-areas with predominantly high K above 3.0 m day−1
in the northern sandier (sand content > 74%) and less silty (silt content < 22%) part and, with lower K
in the southern part of the study region. Generally, the spatial distribution of the K values in the study
region depended on the share of individual intrinsic textural fractions. On the other hand, the ranges
of the spatial relationship between K and the intrinsic and relatively stable soil properties were much
larger (from ~ 15 to 81 km) than between K and the temporally variable soil properties (0.3–0.9 km).
This knowledge is supportive for making decisions related to land management aimed at alteration
of hydraulic conductivity to improve soil water resources and crop productivity and reduce chemical
leaching.
Saturated hydraulic conductivity (K) is a key characteristic of soil, describing the rate of water flow, pathways of
water movement partitioning precipitation and irrigation water into surface runoff and retention in the soil1,2, and
the soil water dynamics in the soil profile3. High K leads to rapid water infiltration and drainage4,5 and reduced
time for allowing agrochemicals to be retained in the soil m atrix6, whereas low K increases surface runoff and
erosion7,8. Thereby, K helps farmers to apply an appropriate amount of irrigation water9. Furthermore, it affects
air-filled porosity10,11 influencing nutrient transformations and uptake by p lants12,13. Due to the numerous con-
tributions, K is often used as a measure of soil physical quality (e.g.12). Also, it is a key parameter in mathematical
models for predicting soil hydraulic behaviour2,14,15.
Institute of Agrophysics, Polish Academy of Sciences, Doswiadczalna 4, 20‑290 Lublin, Poland. *email: b.usowicz@
ipan.lublin.pl
Scientific Reports | (2021) 11:8293 | https://doi.org/10.1038/s41598-021-86862-3 1
Vol.:(0123456789)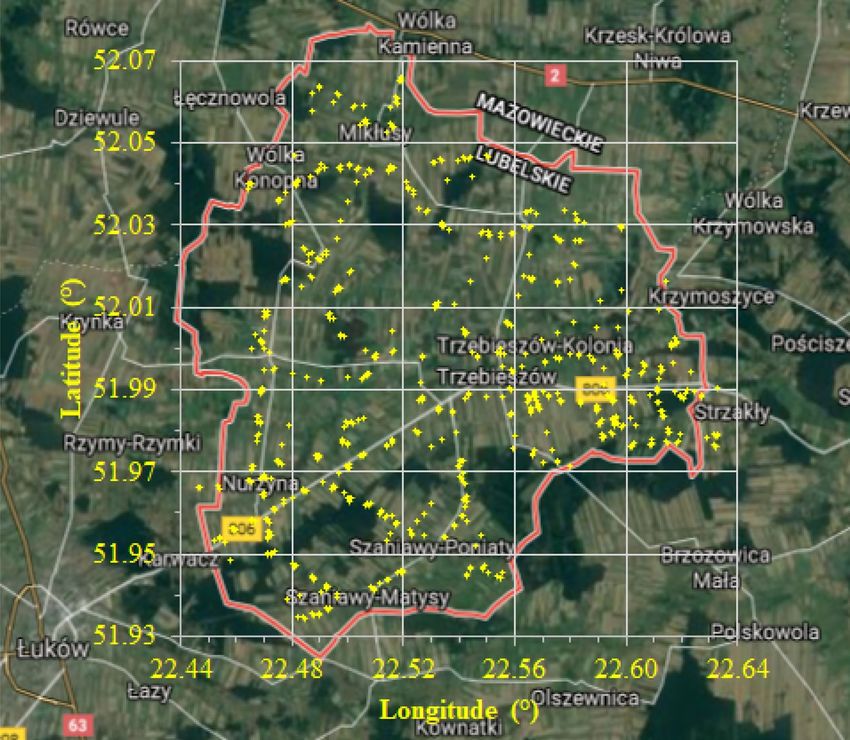
www.nature.com/scientificreports/
The K value depends largely on the pore size distribution (PSD), especially on the share and continuity of rela-
tively large pores (macropores)9,16–20. In a study conducted by Kim et al.21, the area of the largest pores explained
almost 80% of variability in soil saturated hydraulic conductivity. As shown by Centeno et al.22, macro-porosity
can be used as a proxy to estimate the spatial variation of K.
Owing to the high sensitivity to pore size distribution influenced by soil texture and management practices,
K displays relatively high spatial v ariability9,15,20,22,23. Therefore, knowledge of the spatial distribution of K is
essential in selection of the most appropriate localised management practices and amendments to improve water
use efficiency in agriculture and to minimise the use and leaching of c hemicals24–27. The spatial distribution of
soil properties, including saturated hydraulic conductivity, can be assessed by classical and spatial statistics.
The classical statistics can adequately analyse variables that are independent of space28. However, when the
random variation occurs, geostatistical analysis including direct semivariograms and cross-semivariograms is
appropriate29,30. Semivariograms define the dependence of the difference between values of a given variable on
the distance between sampling locations and, hence, the spatial structure of the variation. They aid in designing
a sampling setup with an amount of samples required for satisfactory regionalization of soil p roperties31,32. Once
various variables are linked, their combined spatial designs can be evaluated by cross-semivariograms. Semi-
variogram and cross-semivariogram data and maps obtained using krging and cokriging techniques. Cokriging
also allows distinguishing time-consuming and/or expensive variables from those that are more easily measured
or available in soil databases. When K shows spatial random variation, the use of both classical statistics and
geostatistical models are r ecommended30.
Numerous studies on the spatial variability of soil K have been performed to date at a short scale (< 25 m)
(e.g.33,34) or a field s cale35. However, the variability at a larger regional scale is poorly understood, as suitable
spatial characterisation of highly heterogeneous K requires a large number of laborious, time-consuming, and
expensive direct m easurements9,36,37. Therefore, the objective of this study was to determine the spatial distribu-
tion of K at the regional scale using a semivariogram and a cross-semivariogram and its relationship with soil
properties that affect conductivity and can be more easily measured or obtained from existing soil databases.
Materials and methods
Study area and sampling. Study region with an area of about 140 km2 is situated in a flat area within
Łuków Plain, south-eastern Poland. The height differences in the shallow and often wet river (Krzna) valleys do
not exceed 10 m. The study region has mostly low productive Podzol soils38 derived from sandy and sandy loams
of glacial origin. About 80% of the area in the region is used in agriculture, with 62.3% and 18.2% of arable lands
and grasslands, respectively. Forests cover only 13.5% of the study area, mostly in the south-eastern and western
parts. The climate is largely influenced by the western circulation and polar sea air (about 65% days a year).
The average annual air temperature in the region is about 7.3 °C. July and January are the warmest and coldest
months with respective mean temperatures of 17.7 and − 3.6 °C. The annual amplitude (the difference between
max and min) of air temperature is 21.3 °C and 23.4 °C when calculated from the differences of the average
temperature of the hottest (July) and coldest (January) months in individual years. The greatest amount of pre-
cipitation is recorded in June and July (more than 70 mm) and the lowest values (less than 30 mm) are noted in
January, February, and March. This indicates significant predominance of summer rainfall (212 mm) over winter
rainfall (83 mm). The sum of rainfall in the growing season (April–September), i.e. 350.9 mm, constitutes 65.4%
of the annual total. During the 50 years under consideration, it ranged from 224 to 530 mm.
Tested soil properties. Soil samples were randomly collected from the 0–20 cm layer into cloth bags and
100 cm3 (5.02 cm diameter and 5.05 cm high) steel cylinders immediately after harvesting cereals (August). Fig-
ure 1 shows the spatial distribution of the soil sampling points. The number of individual samples varied from
216 to 228 (for K, WC, BD, FI) to 691 for the other soil properties. At each randomly selected point we collected
from a few to a dozen samples around, which we used in the geostatistical analysis.
Soil dry bulk density (Mg m −3) was determined with the gravimetric method from the ratio of the mass of
soil dried at 105 °C to the soil volume of 100 c m339. The gravimetric water content ( WCgrav) was determined from
the ratio between water mass and mass of the soil after drying using the same cylinders as for determination of
dry bulk density. Soil water content was also measured using a TDR meter (WCTDR) close to the sampling sites.
Saturated hydraulic conductivity was measured with the constant head method in soil samples with a volume
of 100 cm3 in a laboratory permeameter (Eijkelkamp Agrisearch Equipments, The Netherlands)40. The method
assumes that K does not depend on the hydraulic head difference and the soil is the only resistance to water
flow. Particle size distribution was analysed using the sieving and hydrometer m ethod41. Soil organic matter was
determined based on wet oxidation with K2Cr2O7 according to Tiurin’s procedure41. The soil pH (in H2O) was
determined potentiometrically using a composite electrode. Particle density (Mg m −3) was determined with the
pycnometric method42. The total porosity (m3 m−3) was calculated as a ratio of 1 − bulk density/particle d
ensity43.
Data analysis. Classical statistics. Basic statistics with the mean, standard deviation, coefficient of vari-
ation, minimum, maximum, skewness, and kurtosis were calculated for each soil property. Both kurtosis and
skewness values of 0 indicate in general symmetrical distribution with a similar right tail (positive) and left tail
(negative) of the distribution curve. When one tail is longer than the other, the distribution is asymmetric. As
shown by Dahiya et al.44, the variability of the soil properties was categorised as low (0–15%), medium (15–75%),
and high (> 75%). Pearson correlation coefficients between the soil variables were determined. The results were
analysed using STATISTICA 12 PL (StatSoft 2019) and GS + 1045. Data normality was assessed using the Cu-
mulative Frequency Distribution45. If the distribution was not normal the natural logarithmic and root square
transformations were used to ensure the normal or close to the normal distribution.
Scientific Reports | (2021) 11:8293 | https://doi.org/10.1038/s41598-021-86862-3 2
Vol:.(1234567890)www.nature.com/scientificreports/
Figure 1. Location of sampling points in the study region. Background maps from “Map data: Google,
TerraMetrics,Dane mapy ©2021 Google Polska. (https://www.google.pl/maps/place/Trzebiesz%C3%B3w/@
51.9976784,22.3932616,28111m/data=!3m2!1e3!4b1!4m5!3m4!1s0x4721fbd1e8dac53f:0x77c729fd11bcd
3f3!8m2!3d52.0122717!4d22.5207958), accessed 31 March 2020. The background maps were modified using
Microsoft Office PowerPoint 2019.
Geostatistical methods. Semivariograms and cross‑semivariograms. It is assumed that values of soil proper-
ties or physical quantities measured in a given point are dependent (similar, correlated) on other points. In this
approach, similarity is described by half of the value expected from the difference between the value of Z(x) of
the variable at point x and the value of Z(x + h) at a point distant by vector h. A variable whose values correspond
to values Z(x) is "regionalised". This variable has a random aspect, which takes into account local anomalies,
including a structural aspect reflecting the multiscale trend of the phenomenon (trend). The analysis of this
variable consists of identifying the structure of the variation. Three phases of the analysis can be distinguished:
preliminary examination of collected data and evaluation of basic statistics, calculation of the empirical variant
of the considered regionalised variable, and adjustment of the mathematical model to the course of the empirical
variant. The knowledge of the first two statistical moments of random functions is required: the first (expected
value) and the second (variance) moment. It is also required that the examined process is stationary, i.e. it does
not change its properties when changing the beginning of the time scale. In the case of fulfilment of the station-
ary process, the random function Z(x) is defined as the second order stationary and then the expected value
exists and does not depend on the position, and the experimental semivariogram γ(h) (for a single variable z1)
or the cross-semivariogram γ12 (h) (for two variables z1 and z2) for distance h are calculated from the following
equations45:
N(h)
1
γ (h) = [z1 (xi ) − z1 (xi + h)]2
2N(h)
i=1
N(h)
1
γ12 (h) = [z1 (xi ) − z1 (xi + h)] · [z2 (xi ) − z2 (xi + h)]
2N(h)
i=1
Scientific Reports | (2021) 11:8293 | https://doi.org/10.1038/s41598-021-86862-3 3
Vol.:(0123456789)www.nature.com/scientificreports/
where N(h) is the number of pairs of points with values of [z1(xi), z1(xi + h)], [z2(xi), z2(xi + h)], distant by h.
Three characteristic parameters for the semivariograms and cross-semivariograms are distinguished: nugget
effect, sill, and range. When the value of the semivariograms increases not from zero but from a certain value,
this value is called the nugget effect. It expresses the variability of the examined physical quantity at a scale
smaller than the sampling interval and/or accuracy of measurement. A value at which no further increase in the
semivariograms is observed (approximately equal to the sample variance) is called sill, while the distance from
zero to the point where the semi- or cross-semivariogram reaches 95% of the sill value is called a range. The latter
expresses the greatest distance at which the sampled values are auto- or cross-correlated.
For semi- and cross-semivariograms determined empirically, the following mathematical models were fitted
using the least squares m ethod45:
• The linear isotropic model describes a straight line variogram. There is no sill in this model; the range A0 is
defined arbitrarily to be the distance interval for the last lag class in the variogram. The formula used is:
γ (h) = C0 + h C A0
• The exponential isotropic model. The formula used for this model is:
− |h|
γ (h) = C0 + C · 1 − e A0 |h| > 0
• The Gaussian isotropic model. The formula used for this model is:
2
− |h|2
A0
γ (h) = C0 + C · 1 − e |h| > 0
where: γ(h) semivariance for internal distance class h, h—lag interval, C0—nugget variance ≥ 0, C—structural
variance ≥ C0, A0—range parameter. In the case of the linear model, there is no effective range A—it is set
initially to the separation distance (h) for the last lag class graphed in the variogram. In the case of the spheri-
cal model, the effective range A = A0. In the case of the exponential model, the effective range A = 3A0, which
is the distance at which the sill (C + C0) is within 5% of the asymptote. In the case of the Gaussian model,
the effective range A = 30.5A0, which is the distance at which the sill (C + C0) is within 5% of the asymptote.
The fractal dimension D was determined based on the log–log semivariogram plots using the f ormula46:
H
D =2− ,
2
where: H is the slope of the semivariogram line plotted in the logarithmic system of coordinates.
Kriging.
The estimation of values in unmeasured places was conducted using the kriging estimation method. This
method gives the best unbiased estimate of the point or block values of the variable under study with minimal
variance during the estimation process. The values of the kriging variance depend on the position of the samples
in relation to the estimated location, the weights assigned to the samples, and the parameters of the semivari-
ogram model and is described by a linear equation expressed by the f ormula45:
N
z · (xo ) = i z(xi )
i=1
where N is the number of measurements, z(xi) is the measured value at the point xi, z*(xo) is the value estimated
at the estimation point xo, and λi are the weights. The weights are determined from the system of equations taking
into account the condition of non-loadability and efficiency of the estimator, i.e. when the expected value of the
difference between the measured and estimated values is zero and the variance of the differences is m inimal45:
N � �
�
j γ xi , xj + µ = γ (xi , xo )i = 1 . . . N
j=1
N
�
i = 1
i=1
Solving the above system of equations, we determined the weights of kriging—λi. These weights allow also
determination of the estimated value z* and its variance from the formula:
N
σk2 (xo ) = µ + i γ (xi , xo ).
i=1
Ordinary kriging (OK) was used for the estimation, as it gave a good match between the measured and the
estimated value. The inverse distance weighting interpolation (IDW) was a worse interpolator, while the ordinary
Scientific Reports | (2021) 11:8293 | https://doi.org/10.1038/s41598-021-86862-3 4
Vol:.(1234567890)www.nature.com/scientificreports/
Properties N Mean Minimum Maximum SD CV(%) Skewness Kurtosis
K 216 2.597 0.010 11.54 2.009 77.3 1.951 4.826
sand 691 74.0 45.0 95.0 9.3 12.6 0.094 – 0.130
silt 691 24.5 4.0 54.0 9.2 37.5 – 0.074 – 0.142
clay 691 1.52 0.0 6.0 0.905 59.4 1.537 4.183
pHH2O 691 5.27 4.04 7.2 0.728 13.8 0.680 – 0.158
OC 691 0.862 0.002 3.8 0.427 49.5 0.904 3.684
CEC 691 9.675 3.050 21.2 3.109 32.1 0.654 0.956
WCgrav 228 0.067 0.009 0.287 0.045 67.4 1.626 3.586
WCTDR 228 0.071 0.001 0.232 0.038 53.7 1.330 2.218
BD 228 1.413 0.998 1.681 0.125 8.9 – 0.540 0.030
FI 228 0.425 0.308 0.525 0.038 8.9 0.000 – 0.030
Transformed data with a square root (sqr) and natural logarithm (ln)
sqr(K) 216 1.507 0.100 3.400 0.573 38.0 0.640 1.080
sqr(clay) 691 1.166 0.000 2.450 0.403 34.6 – 0.610 2.570
ln(pHH2O) 691 1.653 1.400 1.980 0.134 8.1 0.410 – 0.510
sqr(OC) 691 0.895 0.040 1.940 0.248 27.7 – 0.520 1.490
sqr(CEC) 691 3.070 1.750 4.600 0.499 16.3 0.100 0.300
ln(WCgrav) 228 – 2.914 – 4.710 – 1.250 0.667 22.9 – 0.200 – 0.250
sqr(WCTDR) 228 0.258 0.032 0.482 0.068 26.5 0.450 0.680
Table 1. Basic statistics for soil properties at a depth of 0–20 cm in the study region. N—number of samples,
SD—standard deviation, CV—coefficient of variation, K—saturated hydraulic conductivity (m d ay−1), sand—
(2–0.05 mm), silt—(0.05–0.002 mm), clay < 0.002 mm, pHH2O—acidity (−), OC—organic carbon (%), CEC—
cation exchange capacity (cmol kg−1), WCgrav—gravimetric water content (m3 m−3), WCTDR—water content in
time-domain reflectometry (m3 m−3), BD—bulk density (Mg m−3), FI—porosity (m3 m−3).
cokriging (OCK) did not appreciably improve the estimation compared to OK. Therefore, kriging maps were
created using Gamma Design Software GS + 1045.
Results
Classical statistics. The statistical parameters of the examined soil characteristics in the studied region are
summarised in Table 1. The mean saturated hydraulic conductivity of the soils was 2.597 m day−1 and ranged
from 0.01 up to 11.54 m day−1. The average sand, silt, and clay contents and their ranges (in %) were 74, 24.5,
1.5 and 45–95, 4–54, 0–6, respectively. The silt content was always lower than that of sand and higher than
that of clay at all sampling points. The content of organic carbon in the studied soils was low, i.e. on average
0.86% with the minimum and maximum values 0.002 and 3.75% at single measurement points. The reaction
of the soils in general was either acidic or neutral with the mean, minimum, and maximum pH (in H2O) val-
ues of 5.3, 4.0, and 7.2, respectively. The mean cation exchange capacity (CEC) was 9.67 cmol kg−1 and ranged
from 3.05 to 21.2 cmol kg−1. The average soil moisture measured with the TDR meter and gravimetrically was
similar and amounted to approx. 0.07 (m3 m−3), whereas the respective ranges were 0.001–0.232 m3 m−3 and
0.009–0.287 m3 m−3. The mean, minimum, and maximum values of bulk density and total porosity were 1.414,
0.998,1.681 Mg m−3 and 0.424, 0.308, 0.524 m3 m−3, respectively. As in the study conducted by Dahiya et al.44
(1984), the variability was low for soil bulk density, total porosity, sand content, and pH in H2O (CV 8.8–13.8%),
medium for CEC, silt content, OC, W CTDR, and W Cgrav (32.1–67.4%), and high for saturated hydraulic conduc-
tivity (77.3%). Skewness, which characterises the degree of asymmetry of the distribution around the mean, was
moderate (< 1) for most variables and slightly more positive (< 2) for soil moisture, clay content, and saturated
hydraulic conductivity. Silt content and bulk density showed a slight negative asymmetry of (< – 1). Kurtosis,
which characterises the relative slenderness or flatness of the distribution compared to the normal distribution
(zero), was close to zero for most variables. We noted relatively little flattening for sand, silt, and pH (in H2O) (< 0
or from − 0.130 to − 0.158), slight slenderness for bulk density and porosity (< 0.053 or from 0.030 to − 0.030),
and somewhat higher value for CEC (< 1 or 0.956). Soil moisture, the OC and clay contents, and saturated
hydraulic conductivity showed much greater slenderness of distribution (2.218–4.826). The differences between
the mean values and the medians for individual variables as well as the values of asymmetry and kurtosis indi-
cate that the studied variables can be described with a normal distribution with fairly good accuracy. Those with
greater asymmetry were square-root or natural-logarithm transformed, thus their data distributions were close
to the normal distribution (Table 1).
Correlation analysis. The linear correlation coefficients (r) between the considered soil properties are sum-
marised in Table 2 (the values marked in bold are statistically significant at p < 0.05). The saturated water con-
ductivity of the soil was significantly positively correlated with the porosity (0.300) and negatively with the soil
density (– 0.283). Other significant correlation coefficients were found between sand and silt contents (– 0.996)
and sand and clay (– 0.182). There was no significant correlation between the contents of silt and clay. Soil pH
Scientific Reports | (2021) 11:8293 | https://doi.org/10.1038/s41598-021-86862-3 5
Vol.:(0123456789)www.nature.com/scientificreports/
Properties sand silt clay pHH2O OC CEC WCgrav WCTDR BD FI K
Marked correlation coefficients are significant at p < 0.05, N = 216
sand 1.000 – 0.996 – 0.181 – 0.177 – 0.175 – 0.519 – 0.060 – 0.068 – 0.084 0.145 – 0.034
silt 1.000 0.092 0.178 0.168 0.470 0.062 0.071 0.083 – 0.142 0.034
clay 1.000 0.006 0.107 0.607 – 0.016 – 0.020 0.031 – 0.056 0.003
pHH2O 1.000 0.019 0.160 0.029 0.070 – 0.007 – 0.068 – 0.060
OC 1.000 0.521 – 0.039 – 0.016 – 0.078 0.007 0.062
CEC 1.000 – 0.013 – 0.005 – 0.006 – 0.079 0.034
WCgrav 1.000 0.876 0.116 0.028 – 0.004
WCTDR 1.000 0.192 – 0.059 – 0.026
BD 1.000 – 0.735 – 0.283
FI 1.000 0.300
K 1.000
Table 2. Correlation coefficients (r) between soil variables in the study region. Sand—(2–0.05), silt—(0.05–
0.002), clay < 0.002 mm, pHH2O—acidity (−), OC—organic carbon (%), CEC—cation exchange capacity (cmol
kg−1), WCgrav—gravimetric water content (m3 m−3), WCTDR—water content in time-domain reflectometry (m3
m−3), BD—bulk density (Mg m−3), FI—porosity (m3 m−3), K—saturated hydraulic conductivity (m day−1).
(in H2O) and OC were negatively correlated (p < 0.05) with the sand content (– 0.177, − 0.175, respectively)
and positively with the silt content (0.178, 0.168, respectively). CEC was negatively and significantly correlated
(p < 0.05) with the sand content (– 0.519) and positively correlated with silt, clay, pH, and OC (0.160–0.607).
The significant correlation between the gravimetric vs. TDR soil moistures (0.876) indicates suitability of
the TDR measurement system, which is widely used as a benchmark for validation of satellite soil moisture
products (e.g.47). Soil moisture did not significantly correlate with other soil properties. Soil porosity correlated
negatively (p < 0.05) with the bulk density and sand and silt contents (– 0.737, − 0.142) and positively with the
sand content (0.145).
Geostatistical analysis. The fitted semivariogram models for K and cross-semivariograms for pairs of
cross-correlated K and other soil properties are presented in Table 3. In general, there was a good agreement
between the theoretical exponential models for all soil properties and the empirical semivariograms, as indicated
by the high values of the determination coefficients ( R2 from 0.592 to 0.923) and the sum of squared residu-
als (RSS) from 0.284), and poor in two (R2 ~ 0.02). The RSS values were small for most models
(5.94 × 10⁻³–7.62 × 10⁻⁶). In the cross-semivariograms analysis, five soil properties had exponential dependency,
four—Gaussian, and one—linear. The presence of nugget effects indicates that the variability of the examined
features is smaller than the adopted minimum distance between the measurement points. The sill values of the
semivariance are comparable with the values of variance obtained in the classical way (Tables 1, 3), which may
indicate lack of clear trends in the data. The sill values of the semivariograms were a derivative of the content of
individual textural fractions. The highest sill values were recorded for the sand and silt contents. However, they
were lower for saturated hydraulic conductivity and substantially lower for the contents of clay, organic matter,
moisture, and pH, cation exchange capacity, bulk density, and total porosity. The range of spatial dependence
displayed by the semivariograms was the smallest for pH (0.012°), intermediate for OC, CEC, clay, sand, silt, BD,
WCgrav, and W CTDR porosity (0.018–0.057°), and the largest for saturated hydraulic conductivity (0.081°). In the
case of the cross-semivariograms for pairs of cross-correlated K with intrinsic and relatively stable properties
(sand, silt, clay, OC, CEC, pH), the spatial ranges were much larger (from 0.095° to 0.81°) than with dynamic
ones, such as gravimetric and TDR soil moistures, bulk density, and total porosity (0.003°–0.009°). According
to the classification of Cambardella et al.48, the spatial dependences (nugget/sill) for all semivariograms were
moderate (0.25–0.75) and those for cross-semivariograms were in general strong (< 0.25). The distribution of the
most widely studied soil properties showed anisotropy with orientation mostly from west to east. Only the clay
content and CEC showed anisotropy from north to south.
The estimation of the spatial distribution of the studied properties using the fractal theory showed that all soil
properties were characterised by high values of the fractal dimensions D > 1.9, indicating a random distribution
in the spatial organisation.
Kriging maps. Based on the obtained models, semivariogram parameters, and measured data, regional-
scale maps of the soil properties were generated and the estimation errors were calculated (Fig. 2) using ordinary
kriging. The estimation errors were 1–2% in the vicinity of the measurement points and up to approx. 10% at the
edges of the estimated areas (measurement grids).
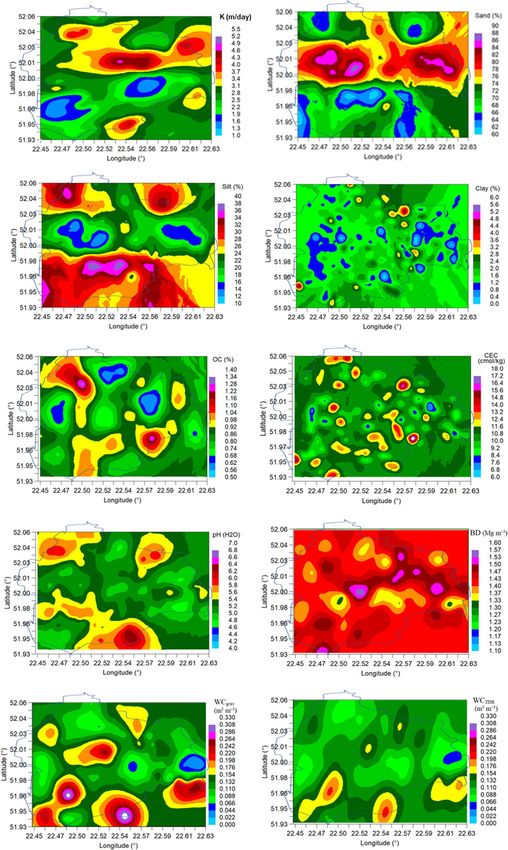
In the northern part of the study region, the large island (area) between approximately 52.01° and 52.04°
with high saturated hydraulic conductivities from 3.1 to 4.6 m day−1 (Fig. 2) corresponds with the highest sand
contents (> 74%) and the lowest contents of silt (< 22%). In the southern part of the region below 52°, the lower
Scientific Reports | (2021) 11:8293 | https://doi.org/10.1038/s41598-021-86862-3 6
Vol:.(1234567890)www.nature.com/scientificreports/
Properties Model C0 C0 + C C0/(C0 + C) A (°) R2 RSS Az(°) D0
Semivariogram models (SV)
K Exp 2.223 4.774 0.466 0.081 0.666 2.83E + 00 75 1.908
sqr (K) Exp 0.187 0.374 0.499 0.063 0.592 1.26E−02 75 1.945
sand Exp 41.4 89.57 0.462 0.024 0.911 8.14E + 01 96 1.945
silt Exp 41.6 87.39 0.476 0.024 0.903 8.03E + 01 96 1.948
sqr(clay) Exp 0.082 0.1714 0.478 0.024 0.733 6.35E−04 0 1.961
ln(pHH2O) Exp 0.00563 0.01796 0.313 0.012 0.699 2.39E−06 124 1.973
sqr(OC) Exp 0.0311 0.0631 0.493 0.021 0.923 1.25E−05 83 1.960
sqr(CEC) Exp 0.1246 0.2532 0.492 0.018 0.904 2.32E−04 0 1.968
ln(WCgrav) Exp 0.1727 0.4294 0.402 0.018 0.568 5.78E−03 44 1.958
sqr(WCTDR) Exp 0.00244 0.00489 0.499 0.057 0.605 1.82E−06 74 1.930
BD Exp 0.00857 0.01724 0.497 0.045 0.609 1.40E−05 117 1.948
FI Exp 0.00080 0.00149 0.541 0.045 0.782 5.56E−06 105 1.943
Properties Model C0 C0 + C C0/(C0 + C) A (°) R2
Cross-semivariogram models (CSV) of sqr(K) and properties
sand Gau – 0.165 – 0.837 0.197 0.156 0.478
silt Gau 0.170 0.762 0.223 0.149 0.419
sqr(clay) Gau 0.0014 0.0463 0.030 0.240 0.316
ln(pHH2O) Lin – 0.00066 – 0.00066 1.000 0.095 0.284
sqr(OC) Exp 0.00004 0.03148 0.001 0.810 0.177
sqr(CEC) Gau 0.0014 0.0863 0.016 0.222 0.394
ln(WCgrav) Exp – 0.0007 – 0.0235 0.030 0.006 0.013
sqr(WCTDR) Exp – 0.00104 – 0.00286 0.364 0.009 0.020
BD Exp – 0.00001 – 0.02102 0.000 0.006 0.295
FI Exp 0.00025 0.00604 0.041 0.003 0.237
Table 3. Fitted semivariogram models (SV) for properties data used in the ordinary kriging interpolation
method and cross-semivariogram models (CSV) between saturated hydraulic conductivity and other soil
properties; 1° corresponds to approx. 100 km. Exp.—exponential model, Lin.—linear model, Gau.—Gaussian
model, C0—nugget variance, C0 + C—sill, A—effective range (°) (1° = approx. 100 km), R2—coefficient of
determination, RSS—root sum square, Az—anisotropy (°—slope angle), D0—fractal dimension.
saturated conductivities correspond with the lower sand content (< 74%), greater silt content > 24%, and similar
clay content (< 2.8%).
In general, latitudinal distribution can be observed for the sand and silt contents. Clay, CEC, and BD are
distributed in a small island and OC, pH, and gravimetric and TDR soil moistures—in larger islands. Cation
exchange capacity (CEC) showed a relatively uniform distribution throughout the study region in small islands
of higher or lower values. Organic carbon content (OC) had mostly an island distribution system with a slightly
marked meridional distribution. It can be observed that both gravimetric and TDR soil moistures were more
similar to that of the organic carbon content than other soil properties. The gravimetric vs. TDR soil moisture
distribution was more variable, which implies greater sensitivity. The highest BD values correspond with the
highest sand content and the lowest contents of clay and OC.
Discussion
Geostatistical analysis. K exhibited the strongest spatial heterogeneity (coefficient of variation 77.3%) of
all the soil studied properties. This can be largely influenced by various management practices, including crop
rotation, tillage, liming, or history of land use and other treatments used at the regional scale. These manage-
ment effects may be associated with changes in total porosity, which was significantly positively correlated with
K (p < 0.05) (Table 2). Particularly important are large and connected (elongated) biological and inter-aggregate
pores9,16,17. The spatially heterogeneous effect of the various management practices applied at the regional scale
on K can mask the impact of intrinsic soil texture, as indicated by the poor and non-significant overall correla-
tions between K and the contents of all textural fractions (Table 2). Probably, there was no significant effect
of terrain attributes associated with the landscape level and pedogenetic processes on K, as the flat study area
within the Łuków Plain is covered mainly by Podzol soils49,50.
The model parameters describing the spatial relationships of K with intrinsic and dynamic soil properties
were better for the cross-semivariograms with auxiliary soil properties than for the direct semivariograms, as
shown by the appreciably smaller nugget values (C0), the greater ranges (A), and the stronger degree of spatial
dependencies (nugget/sill) in the former. These differences were most pronounced when intrinsic (stable) and
relatively stable soil properties, including the contents of textural fractions, OC, and CEC, were used as auxiliary
variables (C0 − 0.165 to 0.170 vs. 2.23), A 0.156° (15.6 km) to 0.810° (81 km) vs. 0.081° (8.1 km), nugget/sill 0.001
Scientific Reports | (2021) 11:8293 | https://doi.org/10.1038/s41598-021-86862-3 7
Vol.:(0123456789)www.nature.com/scientificreports/
Figure 2. Maps of saturated hydraulic conductivity (K), sand, silt, and clay contents, soil organic carbon (OC),
cation exchange capacity (CEC), pH, bulk density (BD), gravimetric water content ( WCgrav) and TDR water
content (WCTDR). The study region is marked by a solid line.
Scientific Reports | (2021) 11:8293 | https://doi.org/10.1038/s41598-021-86862-3 8
Vol:.(1234567890)www.nature.com/scientificreports/
to 0.223 vs. 0.466). This indicates that the intrinsic and relatively stable soil properties were spatially correlated
with K although there was no significant linear correlation of each intrinsic or relatively stable soil property vs.
K (Table 2). The smaller nugget values (C0) in the cross-semivariograms compared to the direct semivariograms
imply smoother spatial continuity and stronger dependency between neighbouring sampling p oints31,51,52. It is
worth noting that the suitability of soil texture data used as auxiliary variables for improvement of the prediction
of the spatial K distribution can be enhanced by their worldwide availability in soil geographic databases (e.g.53).
It should be underlined that the range values of the cross-semivariograms (in the case of all pairs) exceeded the
length and width of the study region (~ 13 × 16 km).
Kriging maps. The kriging maps generated in this study allowed outlining two sub-areas with predominantly
saturated hydraulic conductivity (K) > 3.0 m day−1 in the northern part (latitude 52.01–52.06) and < 3.0 m day−1
in the southern part (52.00–51.93) of the study region. As reported by Stryjewski54, the K values in the northern
part can be classified as high and very high and those in the southern part as fairly high and low. The comparison
of the maps in Fig. 2 shows positional similarity between the sub-area with the higher K value and those with
the large sand content (> 74%) and the low silt content (< 22%). This similarity can be attributed to the effect
of the sand fraction on the abundance of relatively large and connected pores that mostly contribute to high K
(e.g.55). This effect can be illustrated by results from a study conducted by Lim et al.56, where K of 5.98 m day−1
of coarse sand decreased by 57, 88, and 96% with the successively decreasing sand content in fine sand, loam,
and clay textured soils. Our previous studies in the same region along with visual observations showed that lim-
ited crop growth and yields were spatially related to higher sand c ontent50,57. This crop response in sandier and
more permeable zones can be caused by excessive drainage of rainwater resulting in insufficient plant-available
water for unsaturated conditions. Furthermore, the drainage contributes to chemical leaching, thereby limiting
the availability of nutrients for plants. This explanation can be supported by the significant negative correlation
between the sand content and cation exchange capacity (Table 2). This implies that high K can be an indicator
of a low-yielding zone in the studied area with predominance of coarse-textured soils. This is in contrast to
fine-textured soils where low K values are indicative of low-yielding zones. For example, in a study conducted
by Keller et al.3 on loam and clay soils with K varying from 0.6 to 25.2 m day−1, lower saturated hydraulic con-
ductivity was recorded in low-yielding zones than in high- and medium-yielding zones due to the more blocky
soil structure in the former. The low yields in fine-textured soils with low saturated hydraulic conductivity often
results from water ponding and limited oxygen concentrations for root and shoot growth, especially in wet
years13. This indicates that the effect of spatial distribution of K on the spatial distribution of soil productivity
and other soil functions depends on soil texture and weather conditions during the growing season. Therefore,
different threshold K values with respect to productivity and other soil functions should be considered in the
case of coarse- and fine-textured soils.
The kriging map of K can be useful for the local authorities and agronomy advisers for spatial planning of
management practices aimed at reduction of particularly high soil K. In coarse-textured soils, it can be reduced
by addition of exogenous organic materials including biochar (as a soil conditioner)27,56,58 and locally available
recycled composted chicken manure or spent mushroom substrate after mushroom harvesting59,60. Such organic
materials are currently applied in the studied area in research and by some farmers on agriculturally used sandy
soils.
Another important agricultural management practice influencing K is crop rotation, including green manure
cover crops or intercropping s ystems61,62. This practice is subsidised in several countries, including Poland, to
increase soil organic carbon c ontent63, improve soil structure64, protect the soil surface from raindrop i mpact65,
enhance fixation of atmospheric nitrogen in the case of legumes66, and improve agricultural productivity62. Over
a longer time span, conversion of arable land into grassland that can serve as carbon and water storage may be
an efficient option (e.g.67).
Also re-compaction of loose soil by traffic leads to reduced K due to a decrease and increase in the large
and small pore volumes, r espectively68. However, this practice needs to be applied with caution to avoid exces-
sive soil compaction and its harmful effect on root growth and crop y ield13,69. Saturated hydraulic conductivity
values ≤ 0.1 m day−1 are used as an indicator of poor soil s tructure70 and more recently as threshold values of
excessive soil compaction induced by vehicular t raffic71. The K values in the study region were in general above
the thresholds, which may be in part related to the presence of predominantly small farms where relatively light
agricultural vehicles and implements are used.
Summary and conclusions
The saturated hydraulic conductivity (K) of the soils in the studied region (140 k m2) varied from 0.01 to
11.54 m day−1 and exhibited high spatial variability (CV 77.3%). This variability was higher than that of the
contents of textural fractions and organic carbon, cation exchange capacity, soil water content, bulk density,
and total porosity (CV 8.9–67.4%) (67.4% for grav. soil moisture and 53.7% for TDR soil moisture). K was
significantly (p < 0.05) positively correlated with the total porosity (r = 0.300) and negatively correlated with the
soil bulk density (r = – 0.283). The spatial prediction (autocorrelation) of the soil properties using single (direct)
semivariograms varied from 0.012° (1.2 km) for pH to 0.081° (8.1 km) for K. Areas with larger K values are
mainly determined by the proportion of sand and silt and those with smaller K—by the proportion of clay. The
range of spatial dependence in the cross-semivariograms between K and sand and silt contents used as second-
ary variables was smaller (about 15 km) than that of cation exchange capacity, clay content, and organic carbon
content used as secondary variables (about 22 to 81 km). However, the range of the spatial dependence prediction
in the cross-semivariograms decreased when the dynamic soil properties (soil moisture, bulk density or total
porosity) were used as secondary variables (0.3–0.9 km). The suitability of soil texture and organic carbon data
Scientific Reports | (2021) 11:8293 | https://doi.org/10.1038/s41598-021-86862-3 9
Vol.:(0123456789)www.nature.com/scientificreports/
to be used as secondary variables in cross-semivariograms for predicting spatial cross-correlations of K can be
enhanced by their worldwide availability in soil geographic databases. The kriging maps allowed outlining two
sub-areas with predominance of K > 3.0 m day−1 in the northern part (latitude 52.01–52.06) and < 3.0 m day−1
in the southern part of the study region. The comparison of the spatial maps indicates that there is positional
similarity (agreement) between the sub-areas with the highest K values and the largest sand contents (> 74%).
The spatial maps generated in this study can be helpful for the local authorities and agronomy advisers for spatial
planning of management practices aimed at reduction of K of permeable and low-productive soils.
Received: 30 December 2020; Accepted: 22 March 2021
References
1. Blanco-Canqui, H., Wienhold, B. J., Jin, V. L., Schmer, M. R. & Kibet, L. C. Long-term tillage impact on soil hydraulic properties.
Soil Tillage Res. 170, 38–42 (2017).
2. Zhao, C., Shao, M. A., Jia, X., Nasir, M. & Zhang, C. Using pedotransfer functions to estimate soil hydraulic conductivity in the
Loess Plateau of China. CATENA 143, 1–6 (2016).
3. Keller, T., Sutter, J. A., Nissen, K. & Rydberg, T. Using field measurement of saturated soil hydraulic conductivity to detect low-
yielding zones in three Swedish fields. Soil Tillage Res. 124, 68–77 (2012).
4. Bigelow, C. A., Bowman, D. C. & Cassel, D. K. Physical properties of three sand size classes amended with inorganic materials or
sphagnum peat moss for putting green rootzones. Crop Sci. 44, 900–907 (2004).
5. Abel, S. et al. Impact of biochar and hydrochar addition on water retention and water repellency of sandy soil. Geoderma 202–203,
183–191 (2013).
6. Li, Y. et al. Using a simple soil column method to evaluate soil phosphorus leaching risk. Clean: Soil, Air, Water 41, 1100–1107
(2013).
7. Fleige, H. & Horn, R. Field experiments on the effect of soil compaction on soil properties, runoff, interflow and erosion. In Subsoil,
Compaction, Distribution, Processes and Consequences Vol. 32 (eds Horn, R. et al.) 258–268 (Catena Verlag, Reiskirchen, 2000).
8. Jadczyszyn, J. & Niedźwiecki, J. Relation of saturated hydraulic conductivity to soil losses. Pol. J. Environ. Stud. 14, 431–435 (2005).
9. Zhang, X., Wendroth, O., Matocha, C., Zhu, J. & Reyes, J. Assessing field-scale variability of soil hydraulic conductivity at and near
saturation. CATENA 187, 104335. https://doi.org/10.1016/j.catena.2019.104335 (2019).
10. Wösten, J.H.M., Veerman, G.J., de Groot, W.J.M. & Stolte, J. Waterretentie—en doorlatendheidskarakteristieken van boven—en
ondergronden in Nederland: de Staringreeks (Water retention and hydraulic conductivity characteristics of topsoils and subsoils
in The Netherlands: the Staring series). Alterra rapport 153, Alterra, Wageningen, The Netherlands, 86 p. (2001).
11. Van den Akker, J. J. H. Evaluation of soil physical quality of Dutch subsoils in two databases with some threshold values. In Soil
Management for Sustainability Vol. 38 (eds Horn, R. et al.) 490–497 (Catena Verlag , Reiskirchen, 2006).
12. Reynolds, W. D., Bowman, B. T., Brunke, R. R., Drury, C. F. & Tan, C. S. Comparison of tension infiltrometer, pressure infiltrometer,
and soil core estimates. Soil Sci. Soc. Am. J. 64, 478–484 (2000).
13. Gliński, J. & Lipiec, J. Soil Physical Conditions and Plant Roots1st Edition, CRC Press, 260 Pp, First Published 1990. Reissued 2018
by CRC Press Taylor & Francis Group ISBN 13: 978-1-351-07670-8 (ebk) (2018).
14. van Genuchten, M. T. A closed-form equation for predicting the hydraulic conductivity of unsaturated soils. Soil Sci. Soc. Am. J.
44, 892–898 (1980).
15. Bevington, J., Piragnolo, D., Teatini, P., Vellidis, G. & Morari, F. On the spatial variability of soil hydraulic properties in a Holocene
coastal farmland. Geoderma 262, 294–305 (2016).
16. Pagliai, M., Marsili, A., Servadio, P., Vignzzi, N. & Pellegrini, S. Changes in some physical properties of a clay soil in Central Italy
following the passage of rubber tracked and wheeled tractors of medium power. Soil Tillage Res. 73, 119–129 (2003).
17. Lipiec, J. & Hatano, R. Quantification of compaction effects on soil physical properties and crop growth. Geoderma 116, 107–136
(2003).
18. Zhao, Y. et al. Modeling grazing effects on coupled water and heat fluxes in Inner Mongolia grassland. Soil Tillage Res. 109, 75–86
(2010).
19. Strudley, M. W., Green, T. R. & Ascough Ii, J. C. Tillage effects on soil hydraulic properties in space and time: state of the science.
Soil Tillage Res. 99, 4–48 (2008).
20. Godoy, V. A., Zuquette, L. V. & Gómez-Hernández, J. J. Spatial variability of hydraulic conductivity and solute transport parameters
and their spatial correlations to soil properties. Geoderma 339, 59–69 (2019).
21. Kim, H., Anderson, S. H., Motavalli, P. P. & Gantzer, C. J. Compaction effects on soil macropore geometry and related parameters
for an arable field. Geoderma 160, 244–251 (2010).
22. Centeno, L. N. et al. Dominant control of macroporosity on saturated soil hydraulic conductivity at multiple scales and locations
revealed by wavelet analyses. J. Soil Sci. Plant Nutr. 20, 1686–1702. https://doi.org/10.1007/s42729-020-00239-5 (2020).
23. Azadmard, B., Mosaddeghi, M. R., Ayoubi, S., Chavoshi, S. & Raoof, M. Spatial variability of near-saturated soil hydraulic proper-
ties in Moghan plain, North-Western Iran. Arab. J. Geosci. 11, 452. https://doi.org/10.1007/s12517-018-3788-8 (2018).
24. Adamchuk, V. I. & Viscarra Rossel, R. A. Precision agriculture: proximal soil sensing. In Encyclopedia of Agrophysics (eds Gliński,
J. et al.) 650–656 (Springer, New York, 2011).
25. Bogunovic, I., Mesic, M., Zgorelec, Z., Jurisic, A. & Bilandzija, D. Spatial variation of soil nutrients on sandy-loam soil. Soil Tillage
Res. 144, 174–183. https://doi.org/10.1016/j.still.2014.07.020 (2014).
26. Hedley, C. B. & Yule, I. J. Soil water status mapping and two variable-rate irrigation scenarios. J. Prec. Agric. 10, 1385–2256 (2009).
27. Villagra-Mendoza, K. & Horn, R. Effect of biochar on the unsaturated hydraulic conductivity of two amended soils. Int. Agrophys.
32, 373–378 (2018).
28. Miller, J. J., Sweetland, N. J., Larnry, F. J. & Volkmar, K. M. Unsaturated hydraulic conductivity of conventional and conservation
tillage soil in southern Alberta. Can. J. Soil Sci. 78, 643–648 (1998).
29. Goovaerts, P. Geostatistics for natural resources evaluation. 483 (1997).
30. Webster, R. Soil science and geostatistics. In: Krasilnikov, P., Carré, F., Montanarella, L. (Eds.), Soil Geography and Geostatistics.
Concepts and Applications. JRC Scientific and Technical Reports. Office for Official Publications of the European Communities,
Luxembourg, (Chapter 1), pp. 1–11 (2008).
31. Jabro, J. D., Stevens, W. B., Iversen, W. M. & Evans, R. G. Tillage depth effects on soil physical properties, sugar beet yield, and
sugar beet quality. Commun. Soil Sci. Plant Anal. 41(7), 908–916. https://doi.org/10.1080/00103621003594677 (2010).
32. Moradi, F., Moosavi, A. A. & Moghaddam, B. K. Spatial variability of water retention parameters and saturated hydraulic conduc-
tivity in a calcareous Inceptisols (Khuzestan province of Iran) under sugarcane cropping. Arch. Agron. Soil Sci. 62(12), 1686–1699.
https://doi.org/10.1080/03650340.2016.1164308 (2016).
33. Mertens, J., Jacques, D., Vanderborght, J. & Feyen, J. Characterisation of the field saturated hydraulic conductivity on a hillslope:
in situ single ring pressure infiltrometer measurements. J. Hydrol. 263, 217–229 (2002).
Scientific Reports | (2021) 11:8293 | https://doi.org/10.1038/s41598-021-86862-3 10
Vol:.(1234567890)www.nature.com/scientificreports/
34. Deurer, M. & Duijnisveld, W. Spatial analysis of water characteristic functions in a sandy podzol under pine forest. Water Resour.
Res. 36(10), 2925–2935 (2000).
35. Gumiere, S. J. et al. Mapping soil hydraulic conductivity and matric potential for water management of cranberry: characterisation
and spatial interpolation methods. Biosyst. Eng. 128, 29–40 (2014).
36. Li, Y., Chen, D., White, R. E., Zhu, A. & Zhang, J. Estimating soil hydraulic properties of Fengqiu County soils in the North China
Plain using pedo-transfer functions. Geoderma 138, 261–271 (2007).
37. Wang, Y., Shao, M. A. & Liu, Z. Pedotransfer functions for predicting soil hydraulic properties of the Chinese Loess Plateau. Soil
Sci. 177, 424–432 (2012).
38. IUSS Working Group W.R.B. World Reference base for soil resources 2014, update 2015. International soil classification system
for naming soils and creating legends for soil maps. World Soil Resources Reports No. 106. FAO, Rome (2015).
39. Blake, G.R. & Hartge, K.H. Bulk density. In: Klute, A. (Ed.), Methods of Soil Analysis. 1. Physical and Mineralogical Methods.
ASA-SSSA Inc., Madison, Wisconsin, USA, pp. 363–375 (1986b).
40. Klute, A. & Dirksen, C. Hydraulic conductivity and diffusivity: laboratory methods. In: Klute, A. (Ed.), Methods of Soil Analysis.
Part 1. Physical and Mineralogical Methods. SSA Book Series Vol. 5 (1986b).
41. Ostrowska, S., Gawliński, Z. & Szczubiałka, Z. Procedures for Soil and Plant Analysis. Institute of Environmental Protection,
Warsaw, Poland (in Polish) (1991).
42. Blake, G. R. & Hartge, K. H. Particle density. In Methods of Soil Analysis. 1. Physical and Mineralogical Methods (ed. Klute, A.)
377–382 (ASA-SSSA Inc., Madison, 1986).
43. Danielson, R. E. & Sutherland, P. L. Porosity. In Methods of Soil Analysis. 1. Physical and Mineralogical Methods (ed. Klute, A.)
443–460 (ASA-SSSA Inc., Madison, 1986).
44. Dahiya, I. S., Ritcher, J. & Mark, P. S. Soil spatial variability: review. Int. J. Trop. Agric. 11, 1–102 (1984).
45. Robertson, G.P. GS+: Geostatistics for the Environmental Sciences; Gamma Design Software: Plainwell, Michigan USA (2008).
46. Perfect, E., Groenevelt, P. H., Kay, B. D. & Grant, C. D. Spatial variability of soil penetrometer measurements at the mesoscopic
scale. Soil Tillage Res. 16, 257–271 (1990).
47. Brocca, L. et al. Soil moisture estimation through ASCAT and AMSR-E sensors: an intercomparison and validation study across
Europe. Remote Sens. Environ. 115, 3390–3408. https://doi.org/10.1016/j.rse.2011.08.003 (2011).
48. Cambardella, C. A. et al. Field-scale variability of soil properties in Central Iowa soils. Soil Sci. Soc. Am. J. 58, 1501–1511 (1994).
49. Rzymowska, Z. & Skrajna, T. Associations and communities of the cereal crops of the Łuków Plain. Part. I. Light soil associations.
Acta Agrobot. 64(4), 243–250. https://doi.org/10.5586/aa.2011.066 (2011).
50. Usowicz, B. & Lipiec, J. Spatial variability of soil properties and cereal yield in a cultivated field on sandy soil. Soil Tillage Res. 174,
241–250 (2017).
51. Paz-Ferreiro, J., Vázquez, E. V. & Miranda, J. G. V. Assessing soil particle-size distribution on experimental plots with similar
texture under different management systems using multifractal parameters. Geoderma 160(1), 47–56 (2010).
52. Vieira, S. R. & Gonzalez, A. P. Analysis of the spatial variability of crop yield and soil properties in small agricultural plots. Bragantia
Campina 62, 127–138 (2003).
53. Batjes, N. H., Ribeiro, E. & van Oostrum, A. Standardised soil profile data to support global mapping and modelling (WoSIS
snapshot 2019). Earth Syst. Sci. Data 12, 299–320. https://doi.org/10.5194/essd-12-299-2020 (2020).
54. Stryjewski, F. Drenowanie (PWN, Warszawa , 1987) ((in Polish)).
55. Chartiera, M. P., Rostagno, C. M. & Pazos, G. E. Effects of soil degradation on infiltration rates in grazed semiarid rangelands of
north-eastern Patagonia, Argentina. J. Arid Environ. 2(75), 656–661 (2011).
56. Lim, T. J., Spokas, K. A., Feyereisen, G. & Novak, J. M. Predicting the impact of biochar additions on soil hydraulic properties.
Chemosphere 142, 136–144 (2016).
57. Lipiec, J. & Usowicz, B. Spatial relationships among cereal yields and selected soil physical and chemical properties. Sci. Total
Environ. 633, 1579–1590 (2018).
58. Ajayi, A. E. & Horn, R. Comparing the potentials of clay and biochar in improving water retention and mechanical resilience of
sandy soil. Int. Agrophys. 30, 391–399 (2016).
59. Becher, M. Properties of organic matter of soil fertilised with spent mushroom (Agaricus L.) substrate. Acta Agrophys. 20(2),
241–252 (2013).
60. Frąc, M., Pertile, G., Panek, J., Gryta, A., Oszust, K., Lipiec, J. & Usowicz, B. Ecological responses of soil fungal community micro-
biome to spent mushroom substrate and chicken manure amendment. Sustainability Science (under review) (2021).
61. Abdollahi, L., Munkholm, L. J. & Garbout, A. Tillage system and cover crop effects on soil quality: II. Pore characteristics. Soil Sci.
Soc. Am. J. 78, 271 (2014).
62. Adetunji, A. T., Ncube, B., Mulidzi, R. & Lewu, F. B. Management impact and benefit of cover crops on soil quality: a review. Soil
Tillage Res. 204, 104717 (2020).
63. Tamm, I. et al. Different leguminous pre-crops increased yield of succeeding cereals in two consecutive years. Acta Agric. Scand.
Sect. B Soil Plant Sci. 66, 593–601. https://doi.org/10.1080/09064710.2016.1205125 (2016).
64. Baumhardt, R. L., Johnson, G. L. & Schwartz, R. C. Residue and long term tillage and crop rotation effects on simulated rain
infiltration and sediment transport. Soil Sci. Soc. Am. J. 76, 1370–1378. https://doi.org/10.2136/1556 (2012).
65. Blanco-Canqui, H. et al. Cover crops and ecosystem services: insights from studies in temperate soils. Agron. J. 107(6), 2449.
https://doi.org/10.2134/agronj15.0086 (2015).
66. Wysokiński, A. & Kuziemska, B. The sources of nitrogen for yellow lupine and spring triticale in their intercropping. Plant Soil
Environ. 65, 145–151 (2019).
67. Hu, T. et al. Converting temperate long-term arable land into semi-natural grassland: decadal-scale changes in topsoil C, N, 13C
and 15N contents. Eur. J. Soil Sci. 70, 350–360. https://doi.org/10.1111/ejss.12738 (2019).
68. Alaoui, A., Lipiec, J. & Gerke, H. H. A review of the changes in the soil pore system due to soil deformation: a hydrodynamic
perspective. Soil Tillage Res. 115–116, 1–15 (2011).
69. Håkansson, I. & Lipiec, J. A review of the usefulness of relative bulk density values in studies of soil structure and compaction.
Soil Tillage Res. 53, 71–85 (2000).
70. Thomasson, A.J. Soils and Field Drainage. Soil Survey Technical Monograph No.7. Soil Survey of England and Wales. (Lawes
Agricultural Trust: Harpenden) (1975).
71. Huber, S., Prokop, G., Arrouays, D., Banko, G., Bispo, A., Jones, R.J.A., Kibblewhite, M.G., Lexer, W., Möller, A., Rickson, R.J.,
Shishkov, T., Stephens, M., Toth, G. Van den Akker, J.J.H., Varallyay, G., Verheijen, F.G.A. & Jones, A.R. (eds) Environmental
Assessment of Soil for Monitoring: Volume I Indicators & Criteria. EUR 23490 EN/1, Office for the Official Publications of the
European Communities, Luxembourg, 339pp. (2008).
Acknowledgements
The work was partially funded by the by HORIZON 2020, European Commission, Programme: H2020-
SFS-2015-2: SoilCare for profitable and sustainable crop production in Europe, project No. 677407
(SoilCare,2016–2021).
Scientific Reports | (2021) 11:8293 | https://doi.org/10.1038/s41598-021-86862-3 11
Vol.:(0123456789)www.nature.com/scientificreports/
Author contributions
B.U. performed the experiments and measurements and carried out data analysis, B.U., J.L. wrote the paper.
Competing interests
The authors declare no competing interests.
Additional information
Correspondence and requests for materials should be addressed to B.U.
Reprints and permissions information is available at www.nature.com/reprints.
Publisher’s note Springer Nature remains neutral with regard to jurisdictional claims in published maps and
institutional affiliations.
Open Access This article is licensed under a Creative Commons Attribution 4.0 International
License, which permits use, sharing, adaptation, distribution and reproduction in any medium or
format, as long as you give appropriate credit to the original author(s) and the source, provide a link to the
Creative Commons licence, and indicate if changes were made. The images or other third party material in this
article are included in the article’s Creative Commons licence, unless indicated otherwise in a credit line to the
material. If material is not included in the article’s Creative Commons licence and your intended use is not
permitted by statutory regulation or exceeds the permitted use, you will need to obtain permission directly from
the copyright holder. To view a copy of this licence, visit http://creativecommons.org/licenses/by/4.0/.
© The Author(s) 2021
Scientific Reports | (2021) 11:8293 | https://doi.org/10.1038/s41598-021-86862-3 12
Vol:.(1234567890)You can also read