MODELING THE EVOLUTION OF SARS-COV-2 USING A FRACTIONAL-ORDER SIR APPROACH
←
→
Page content transcription
If your browser does not render page correctly, please read the page content below
TecnoLógicas
                                                              ISSN: 0123-7799
                                                              ISSN: 2256-5337
                                                              tecnologicas@itm.edu.co
                                                              Instituto Tecnológico Metropolitano
                                                              Colombia

Modeling the Evolution of SARS-CoV-2
Using a Fractional-Order SIR Approach
Quintero, Anderson S.; Gutiérrez-Carvajal, Ricardo E.
Modeling the Evolution of SARS-CoV-2 Using a Fractional-Order SIR Approach
TecnoLógicas, vol. 24, núm. 51, e1866, 2021
Instituto Tecnológico Metropolitano, Colombia
Disponible en: https://www.redalyc.org/articulo.oa?id=344265925015
DOI: https://doi.org/10.22430/22565337.1866

Esta obra está bajo una Licencia Creative Commons Atribución-NoComercial-CompartirIgual 4.0 Internacional.

                                   PDF generado a partir de XML-JATS4R por Redalyc
                    Proyecto académico sin fines de lucro, desarrollado bajo la iniciativa de acceso abierto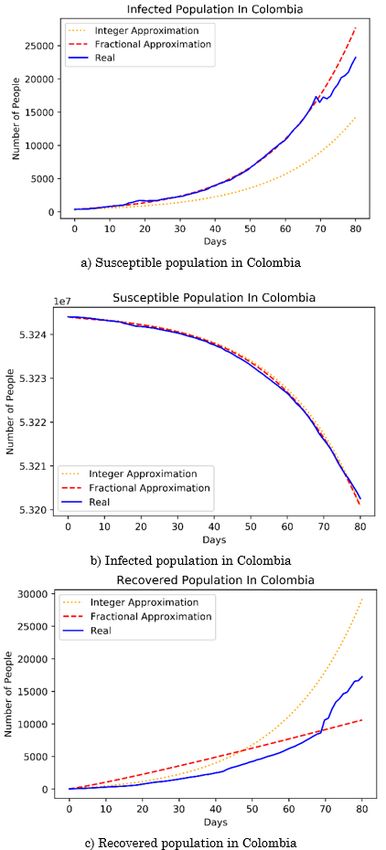
Anderson S. Quintero, et al. Modeling the Evolution of SARS-CoV-2 Using a Fractional-Order SIR App...
Artículos de investigación
Modeling the Evolution of SARS-CoV-2 Using a Fractional-Order SIR Approach
Modelando la evolución del SARS-COV-2 usando una aproximación fraccionaria
Anderson S. Quintero DOI: https://doi.org/10.22430/22565337.1866
Universidad Militar Nueva Granada, Colombia Redalyc: https://www.redalyc.org/articulo.oa?
anderson.quintero@unimilitar.edu.co id=344265925015
https://orcid.org/0000-0002-6562-6245
Ricardo E. Gutiérrez-Carvajal
Universidad Militar Nueva Granada, Colombia
ricardo.gutierrez@unimilitar.edu.co
https://orcid.org/0000-0002-6013-5463
Recepción: 03 Febrero 2021
Aprobación: 04 Junio 2021
Publicación: 12 Julio 2021
Abstract:
To show the potential of non-commensurable fractional-order dynamical systems in modeling epidemiological phenomena, we
will adjust the parameters of a fractional generalization of the SIR model to describe the population distributions generated by
SARS-CoV-2 in France and Colombia. Despite the completely different contexts of both countries, we will see how the system
presented here manages to adequately model them thanks to the flexibility provided by the fractional-order differential equations.
e data for Colombia were obtained from the records published by the Colombian Ministry of Information Technology
and Communications from March 24 to July 10, 2020. ose for France were taken from the information published by the
Ministry of Solidarity and Health from May 1 to September 6, 2020. As for the methodology implemented in this study, we
conducted an exploratory analysis focused on solving the fractional SIR model by means of the fractional transformation method.
In addition, the model parameters were adjusted using a sophisticated optimization method known as the Bound Optimization
BY Quadratic Approximation (BOBYQA) algorithm. According to the results, the maximum error percentage for the evolution
of the susceptible, infected, and recovered populations in France was 0.05%, 19%, and 6%, respectively, while that for the evolution
of the susceptible, infected, and recovered populations in Colombia was 0.003%, 19%, and 38%, respectively. is was considered
for data in which the disease began to spread and human intervention did not imply a substantial change in the community.
Keywords: SARS-CoV-2 modeling, fractional calculus, SIR model (Susceptible-Infected-Recovered), biological system
modeling.
Resumen:
Con el objetivo de exponer el potencial de los sistemas dinámicos de orden fraccionario, inconmensurables para la modelación
de fenómenos epidemiológicos, en este artículo se ajustarán los parámetros de una generalización fraccionaria del modelo SIR
(susceptibles, infectados y recuperados) para describir las distribuciones poblacionales generadas por el SARS-CoV-2 en Francia
y Colombia, dos países cuyos contextos son totalmente diferentes. Asimismo, se mostrará cómo el sistema presentado logra
describir adecuadamente los dos contextos debido a la flexibilidad proporcionada por las ecuaciones diferenciales de orden
fraccionario. Los datos, para Colombia, fueron obtenidos del registro hecho por el Ministerio de Tecnologías de la Información
y las Comunicaciones, considerándose las fechas del 24 de marzo del 2020 hasta el 10 de julio del mismo año. Por su parte, para
Francia, los datos fueron tomados del monitoreo hecho por el Ministerio de Solidaridad y Salud, en un periodo comprendido desde
el 1 de mayo de 2020 hasta el 6 de septiembre del mismo año. La metodología seguida es un análisis exploratorio centrado en la
solución del modelo SIR fraccionario a partir del método de la transformación fraccionaria, ajustado mediante un plan sofisticado
de optimización llamado algoritmo BOBYQA.Los resultados presentados muestran que el porcentaje de error máximo para la
evolución de la población susceptible, infectada y recuperada en Francia es de 0.05 %, 19 % y 6 %, respectivamente. Mientras tanto,
en Colombia se tiene un valor correspondiente de 0.003 %, 19 %, 38 %, esto para datos en los que se inició la dispersión de la
enfermedad, donde la intervención humana no tuvo un cambio contundente en la comunidad.
Palabras clave: Modelamiento del SARS-CoV-2, cálculo fraccionario, modelo SIR (susceptible, infectada, recuperada),
modelamiento de sistemas biológicos.
PDF generado a partir de XML-JATS4R por Redalyc
Proyecto académico sin fines de lucro, desarrollado bajo la iniciativa de acceso abiertoTecnoLógicas, 2021, vol. 24, núm. 51, e1866, Mayo-Septiembre, ISSN: 0123-7799 2256-5337
Highlights
e paper demonstrates the potential of fractional non-commensurable models for fitting natural dynamics.
e model presented is a simple system that adjusts different behaviors to totally different contexts.
e fractional SIR model is an excellent basis for generating more accurate dynamic fitting systems.
1. INTRODUCTION
In 2020, thousands of cases of SARS-CoV-2 infection were reported around the world [1]. e first known
case was identified on December 29th, 2019, in Wuhan, the capital of the Hubei province in China. is
first patient presented symptoms of pneumonia [2]—a pattern increasingly observed in people with SARS-
CoV-2 who had the Middle East Respiratory Syndrome (MERS) in the initial phase [2].
In January 2020, this disease was confirmed to be highly contagious, with a severity ranging from
asymptomatic to lethal [3], [4], which favors its propagation. Its rapid spread around the world forced
governments to restrict economic, social, and cultural activities in the hope of reducing the number of people
affected by it. ese polices, however, negatively affected the global development of cities and communities.
For instance, the demand for tourism and gastronomy decreased, leading to a 20 % reduction in causing the
agricultural production to drop by 20 % [5]. Likewise, due to the implementation of biosafety and physical
distancing protocols seeking to prevent infections, educational institutions had to be closed [6], [5]. is
disease has also had an impact on the current population index. By the end of October 2020, approximately
2.391.405 people in the world had died of SARS-CoV-2 [7].
ese events encouraged researchers to focus on two fundamental topics: (1) developing a vaccine to
prevent the disease and (2) studying its evolution over time in infected individuals. Regarding the latter,
various deterministic [8], [9] and stochastic [10], [11] methodologies and models have been proposed,
which, when applied or adapted to a set of population data and limited to a series of assumptions linked to
the model used, provide tools to adjust and predict the disease dynamics. is, in turn, contributes to a better
decision making and to the analysis of hypothetical situations that help to identify potential risk factors or
improvements, which are aspects that serve as guidelines to devise strategies to counteract the rapid evolution
of the disease and minimize the death rate.
Deterministic models are designed or adapted. eir application demands reconsidering a set of
relationships between variables, as well as several assumptions that delimit and define the situation
to be modeled. ey, thus, result in sophisticated dynamic systems requiring complex analysis of
stability and studies that provide certainty on the proposed model and eliminate the uncertainty of
possible contradictions regarding singularities in their interpretations, as reported in [12]-[14]. Given the
approximation and adaptation process of the classical dynamical models that implement integer differential
operators, we will here focus on a special type of deterministic models: fractional dynamical systems. ese
systems base the structures of immediate change in time on the fractional definitions of the derivative—
a concept that generalizes the classical definition of infinitesimal change given by Newton and Leibniz of
infinitesimal change to non-integer value.
e theory of fractional calculus broadens the possibilities of the classical differential models. It generates
systems whose equations establish dynamics that are more sensitive to change, thereby leading to an
improvement in modeling the coupling of the real phenomena.
is gives consistency to the models-order models because they allow for a more detailed description of
the memory and the hereditary properties of the processes [15]. Nowadays, this generalization of dynamic
systems has proven to be very useful to model not only biological but also physical, chemical, and economic
PDF generado a partir de XML-JATS4R por Redalyc
Proyecto académico sin fines de lucro, desarrollado bajo la iniciativa de acceso abiertoAnderson S. Quintero, et al. Modeling the Evolution of SARS-CoV-2 Using a Fractional-Order SIR App...
systems, among others [15]. us, implementing fractional orders in differential systems not only enables a
wider study of the models but also improves the accuracy of the obtained results due to the limitations of
complex integer models with few coefficients [16], [17], as in the case of SARS-CoV-2 propagation.
Given the difficulties of the Susceptible‐Infectious‐Recovered (SIR) integer model to suit
complex behaviors using few coefficients (such as those that depend on complex interactions among the
community regarding sociological, economic, and political aspects [18]), we propose the use of a fractional
SIR model to describe SARS-CoV-2 propagation in two different countries (France and Colombia) under
two government policy scenarios: ruling during lockdown and ruling before it. France and Colombia were
selected as case studies from Europe and Latin-America, respectively.
1.1 Experimental Setup
e propagation of SARS-COV-2 behaves different in different countries, due to the cultural particularities,
availability of medical resources and applied politics used to deal with the health crisis, among others. e
SIR models are widely used in the literature to describe disease propagation, due to its simplicity and easily
interpretation [19]. Unfortunately, this naive model is not always suitable to fit the real data [20]. In this
work, a fractional order generalization is applied to model the SARS-COV-2, the models were adjusted to
fit the behavior of two datasets from two different countries (France and Colombia), as explained below.
-French dataset: It was obtained from the website of the French Ministry of Solidarity and Health, and
its collection and distribution are led by Etalab. Data started to be collected since May 1st, 2020 and are
updated daily. In this study, we considered data from May 1st to September 6th, 2020 (i.e., 179 days) because
the regulatory policies in France changed dramatically around two weeks aer this latter date. For instance,
movement outside the country was restricted, and citizens were confined to move in their surroundings as
the government imposed a quarantine. For each day, there is a record of the cumulative number of recovered,
infected, and dead cases. e number of susceptible people was calculated by subtracting the number of
recovered infected, and dead individuals from the total French population reported in [21]. Finally, assuming
that the recover people is taken as the quantity that return to their home. e number of people recovered
is obtained by assuming that the infected people is healthy aer 14 days of first infection [22].
-Colombian dataset: It was obtained from the datos.gov.co website run by the Colombian Ministry of
Information Technology and Communications. is public database was specifically created to monitor
the evolution of SARS-CoV-2 within the country. It includes data such as date, department, and patients’
age and status. Data started to be collected since March 6th, 2020 and are updated daily. In this study, we
considered the period during which the population was under quarantine (from March 24th to July 10th,
2020) (i.e., 80 days). Dates outside this range were not considered because the behavior of the virus may
have been different during such days. is dataset monitors 23 variables every day. e number of susceptible
people was calculated as the difference between the total population and the sum of the cumulative number
of infected, recovered, and dead cases. e number of infected individuals was computed by subtracting the
number of deaths and recoveries from the number of daily infected people. Finally, the number of recovered
individuals was estimated by adding the daily number of recovered cases reported on the dataset.
1.2 Fractional SIR Model
In this study, we employ Caputo’s fractional derivate [23] because the initial condition problem can be more
easily solved with it rather than using other definitions of fractional derivatives [24], [25]. Formally, being
PDF generado a partir de XML-JATS4R por Redalyc
Proyecto académico sin fines de lucro, desarrollado bajo la iniciativa de acceso abiertoTecnoLógicas, 2021, vol. 24, núm. 51, e1866, Mayo-Septiembre, ISSN: 0123-7799 2256-5337
the order of the derivative and ## denoting the derivative with respect to Caputo’s derivative, which is defined
as in (1).
Where # – 1 ≤ # ≤ #. e SIR model is the classical model used to analyze the spread of infectious diseases
over time in a community whose population is assumed to be constant and where the reinfection rate is
negligible. It divides the population into three disjointed sets: susceptible (S), infected (I), and recovered (R).
e SIR model considers a one-way infection transition among the populations sets (S, I, and R).
Susceptible individuals could get infected or remain susceptible; infected individuals could only recover or
remain infected; and recovered individuals represent the final stage of the model (see Figure 1).
FIGURE 1.
Structure that models the transition process of an infected individual
Source: Authors’ own work.
To transit from S to I, a ratio of 1 is assumed because the entire S population is vulnerable to contracting
the virus. e probability of infection is calculated by dividing the number of current susceptible individuals,
S(t), by the total number of people, N. Finally, the total population is estimated by multiplying the number
of infected people over time, I(t), by the expected number of people that an individual infects per day (#).
e alpha parameter allows us to model sub-propagations or super-propagations, which are understood as
propagation speeds that are lower or higher than those of an entire model with the same coefficients. is
effect can be observed in the configuration of interactions between individuals, which are not necessarily
homogeneous, and in other factors such as environmental impacts. Formally, the change in the susceptible
population is given by (2).
To transit from I to R, a ratio of #, which will be the proportion of infected individuals recovered per day, is
assumed. e probability of recovering from the disease (that all can recover) is 1. Finally, the total population
is the number of infected individuals over time, I(t). Formally, the change in the recovered population is
given by (3).
Lastly, the equation that represents the infected population is obtained by assuming that the change of
the total population with respect to time is a value that is approximately equal to zero. us, the following
is the expression that models the infected population by (4):
PDF generado a partir de XML-JATS4R por Redalyc
Proyecto académico sin fines de lucro, desarrollado bajo la iniciativa de acceso abiertoAnderson S. Quintero, et al. Modeling the Evolution of SARS-CoV-2 Using a Fractional-Order SIR App...
Where #, #, and # are the order of those derived from the susceptible, infected, and recovered populations,
respectively. Note that if # = # = # = 1, the resulting equation is the classical SIR integer order model.
1.3 Fractional Equation Solution Method
e equations of the fractional SIR model are solved using Riemann–Liouville integration, whose solution
function is generated from a set of fractional power series expressed as seen in (5).
Where ## is an integer value (usually the lowest one) for which aiαi is an integer, and coefficients ##(#) are
given by the fractional transformation of the function defined as in (6).
is is known as the fractional transformation method [26], [27]. Solving systems makes it possible to
establish generalizations of classical models to study problems under a set of specific assumptions required by
the differential system. In broad terms, the solution to non-integer order differential systems provides more
degrees of freedom to classical differential equations whose immediate changes with respect to time are fixed.
We will apply the fractional calculation mechanics presented earlier to fit real data regarding the evolution
of SARS-CoV-2 in its stages of development.
1.4 Evaluation Metrics
e model’s solution offers three uniquely time-dependent functions that describe the evolution of three
population sets over time. As observed in the system, the growth of the recovered set depends on the behavior
of the infected set; and the growth of this latter is conditioned by the development of the susceptible set.
Because of this relationship between the three population sets, we consider that a global evaluation metric
that estimates the dispersion of a model with respect to the real values of a community is the most appropriate
option [28], [29]. erefore, in this study, we calculated the fitting error as shown in (7), (8), (9), and (10).
where S, I, and R are the actual data on population dispersion for the susceptible, infected, and recovered
sets, respectively. In addition, #*, #*, and #* represent the approximate data set by the model for the same
PDF generado a partir de XML-JATS4R por Redalyc
Proyecto académico sin fines de lucro, desarrollado bajo la iniciativa de acceso abiertoTecnoLógicas, 2021, vol. 24, núm. 51, e1866, Mayo-Septiembre, ISSN: 0123-7799 2256-5337
population; and ###, ###, and ###, the actual number of data associated with ######, ######, and ###### at time i,
respectively. Since the solution method is applied using fractional power series, changing a value in the order
of the derivatives implies altering all the set of constants obtained in the power series. A high decimal value in
the derivative could suggest a slow convergence and, therefore, a greater number of monomials to obtain an
approximation, which, in turn, leads to higher computational costs. In this study, we restricted the order of
the differential equations to three decimal places and its fractional expansion to 130 terms because we seek
to maintain a balance between accuracy and computational cost.
2. RESULTS
e solution to the differential equation system under study provides three polynomial equations expressed
by means of fractional power series. Each resulting expression models the evolution of the susceptible,
infected, and recovered populations across different periods of time. erefore, the behavior of each solution
depends on five parameters: the infected and recovered population coefficients (β and γ) and the order of the
derivatives (α, #, and δ). Due to this, there is at least a set of coefficients that fit the solutions to the dataset.
However, since the convergence of the solutions depends on the number of decimal places in the order of
the derivatives, we established the following restrictions to obtain the optimal coefficients with a minimum
computational cost:
-e order of the derivatives must have a maximum of three decimal places.
-e error of each model is the maximum overall relative error.
-e approximations will have polynomials of 130 terms.
-e data used consider only mild changes in behavior, which limits human intervention.
e Bound Optimization BY Quadratic Approximation (BOBYQA) gradient-free minimization
algorithm was used to perform iterative minimization [30]-[32]. We implemented this algorithm because
changes in the order of a derivative produce gaps in calculating the error, thus yielding discontinuity, and
avoiding derivatives in all the intervals of interest. e maximum error for the Colombian model is presented
in Table 1.
TABLE 1.
Percentage of maximum absolute error associated with
the integer and fractional SIR model approximations
Source: Authors’ own work.
2.1 Colombian population
e optimal orders of the derivatives obtained by the algorithm for the fractional model are: 0.52 for the
differential growth of the susceptible population in Colombia, 0.72 for that of the infected population, and
1.12 for that of the recovered population. Regarding the parameters, the number of people infected per day
by a single infected person (i.e., parameter #) was 0.1424499 and the frequency of recovered (i.e., parameter
#) was 0.09640691 for the integer model. For the fractional model, # and γ were 0.35 and 0.23, respectively.
PDF generado a partir de XML-JATS4R por Redalyc
Proyecto académico sin fines de lucro, desarrollado bajo la iniciativa de acceso abiertoAnderson S. Quintero, et al. Modeling the Evolution of SARS-CoV-2 Using a Fractional-Order SIR App...
e order of the fractional differential equation shows that the evolution of the susceptible and infected
populations has a differential behavior that is much lower than that provided by the entire model. is
implies that, although the virus propagation dynamics had no initial control, its propagation was limited
by environmental conditions or factors exogenous to the current model. Moreover, the growth rate of the
recovered population is higher than the integer, which indicates that the Colombian population experiences
an accelerated recovery rate.
e behavior of the recovered population has accelerated the dynamics with respect to the value expected
in the SIR model. is suggests that, although people are infected at a lower rate than expected, they recover
much faster (in very short intervals of time). Figures 2a), 2b), and 2c) provide a better approximation of the
fractional model with respect to the integer model.
FIGURE 2.
Integer and fractional SIR model approximations to the Colombian population
Source: Authors’ own work.
PDF generado a partir de XML-JATS4R por Redalyc
Proyecto académico sin fines de lucro, desarrollado bajo la iniciativa de acceso abiertoTecnoLógicas, 2021, vol. 24, núm. 51, e1866, Mayo-Septiembre, ISSN: 0123-7799 2256-5337
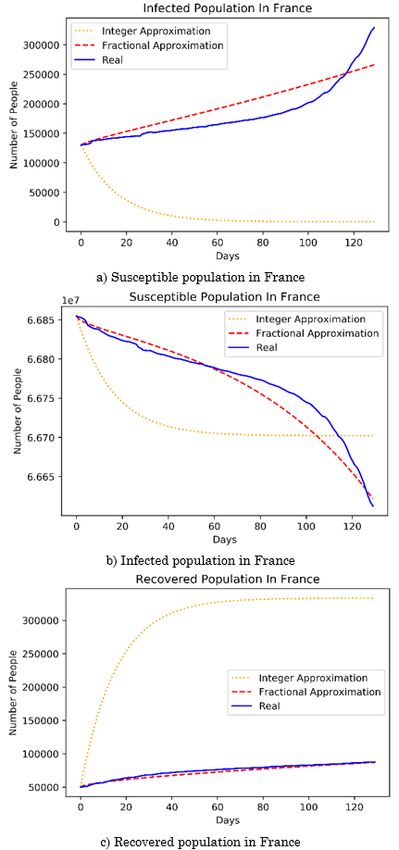
2.2 French population
e optimal orders of the derivatives obtained by the algorithm for the fractional model are: 0.55 for the
differential growth of the susceptible population in France, 0.76 for that of the infected population, and 0.62
for that of the recovered population. Regarding the parameters, the number of people infected per day by a
single infected person (i.e., parameter #) was 0.1731863 and the frequency of recovered (i.e., parameter #) was
0.06761948 for the integer model. For the fractional model, # and # were 0.0267 and 0.0115, respectively.
e growth dynamics of the susceptible population presents significant changes because the differential
order of the non-infected population was considerably below the order expected from the integer model (1).
is means that the French health policies significantly impacted the spread of the disease, as the integer
model provides an estimate of how the contagion might have evolved if there had been no initial restrictive
measures to prevent the spreading of the disease.
e difference between the differential orders of the susceptible and infected populations is determined
for two reasons: (1) due to the difference between the quantities handled by the populations, since the scale
of susceptible individuals is much larger than that of infected individuals; hence, the system proportionally
balances the quantities based on their differential growths, and (2) because exogenous factors (e.g., the
environment and the population density in regions with high infection rates) endorsed a greater survival
of the virus in potential inorganic entities that transmit the disease. Table 2 shows the error comparison
between the integer and fractional models, on the other hand, the Figures 3a), 3b), and 3c) show the
approximation of the fractional model and the integer model fitted to the French data.
TABLE 2.
Percentage of maximum absolute error associated with
the integer and fractional SIR model approximations
Source: Authors’ own work.
PDF generado a partir de XML-JATS4R por Redalyc
Proyecto académico sin fines de lucro, desarrollado bajo la iniciativa de acceso abiertoAnderson S. Quintero, et al. Modeling the Evolution of SARS-CoV-2 Using a Fractional-Order SIR App...
FIGURE 3.
Integer and fractional SIR model approximations to the French population
Source: Authors’ own work.
e models of SAR-COV-2 propagation in Colombia and France reproduce the behavior of the disease
and the distribution of the three population sets. e fitted parameters could be interpreted to improve the
way the disease is handled.
Although the evolution of the susceptible population in Colombia (regulated by parameter ) indicates a
lower expected growth rate, this does not mean that it is due to an adequate handling of the disease but rather
to the fact that it is conditioned by the results of the infected and recovered populations. A slowing effect
of the susceptible population triggers a slow evolution and progress of the infected group, who have more
possibilities of contagion. is is contrasted by the considerably high growth rate of the infected population
(1.2) with respect to the integer model (1). Indeed, under these conditions, the average number of individuals
who are infected by just one person is expected to be around 0.35. is condition makes the susceptible
group to remain approximately constant but the infected population to increase rapidly even during a strict
lockdown.
Moreover, the evolution of the recovered population shows a favorable growing tendency that
overshadows the differential growth of the other two populations (susceptible and infected individuals).
PDF generado a partir de XML-JATS4R por Redalyc
Proyecto académico sin fines de lucro, desarrollado bajo la iniciativa de acceso abiertoTecnoLógicas, 2021, vol. 24, núm. 51, e1866, Mayo-Septiembre, ISSN: 0123-7799 2256-5337
is, in turn, suggests that infected people have a high resistance to the disease and that if there were
eventually no infected individuals or external influences, the pandemic would end satisfactorily in a few
weeks. is is contrasted by #, which indicates that, under the growth distribution of the recovered
population, each infected individual recovers in 4–10 days or, otherwise, dies aer 4–10 days.
In the case of France, the growth of the recovered population, as well as parameters # and γ imply a
different context because the low recovery rate is attributed to the low infection rate. erefore, although
the growth of both populations is similar due to their fractional growth coefficients, the results indicate a
smaller population, which is contrasted by the lower slope and curve of the French population with respect
to that of Colombia.
3. CONCLUSIONS
e data used in this study show different behaviors of SARS-CoV-2 in its initial stages of evolution, thus
demonstrating that the sociopolitical conditions in Colombia and France are quite different. However,
despite these differences, the model was easily adapted because the evolution of the disease exhibited a growth
that was expected for the fractional dynamics. Hence, the use of fractional differential equations to model
dynamical systems is found to be a favorable alternative that improves the accuracy and proximity of the
biological phenomena of disease spread provided by integer models. is can be observed in the results
obtained here regarding SARS-CoV-2 propagation in Colombia and France, where the complexity of the
models did not increase.
e fractional transformation method has proven to be a suitable choice for solving most linear and
nonlinear fractional differential equations; it produces satisfactory results and is employed to develop
extremely useful tools to solve fractional equations. For instance, the BOBYQA optimization algorithm fits
very well in the minimization of orders in fractional equations, as well as in the metrics used to evaluate it.
In addition, it can be easily adapted to other type of complex systems.
Although the fractional model provides a suitable fit to SARS-CoV-2 propagation in two different
countries with very different health policies, the fractional-order SIR model, which can be applied to
multiple contexts due to its flexibility, is only a baseline approximation that makes it possible to describe
the evolutionary nature of the infection. It can be improved or adjusted to address a particular context by
increasing the interaction between populations or by adding more populations, like to the sir model is a
guiding basis for the structuring of more complex models. According to our results, the SIR model had
some restrictions in the curve of the recovered population in Colombia due to a limitation in the model
assumptions.
Acknowledgments
e authors acknowledge the Vice-rectory of research of the Universidad Militar Nueva Granada by funding
the project IMP-ING-2934.
REFERENCES
[1] World Health Organization, “WHO Coronavirus Disease (COVID-19) Dashboard”, 2020. https://covid19.w
ho.int/
[2] Q. Li et al., “Early transmission dynamics in Wuhan, China, of novel coronavirus– infected pneumonia”, N. Engl.
J. Med., vol. 382, no. 13, Mar. 2020. https://doi.org/10.1056/NEJMoa2001316
PDF generado a partir de XML-JATS4R por Redalyc
Proyecto académico sin fines de lucro, desarrollado bajo la iniciativa de acceso abiertoAnderson S. Quintero, et al. Modeling the Evolution of SARS-CoV-2 Using a Fractional-Order SIR App...
[3] World Health Organization, “Novel Coronavirus (2019-nCoV): situation report, 3”, Jan. 2020. https://apps.wh
o.int/iris/bitstream/handle/10665/330762/nCoVsitrep23Jan2020-eng.pdf
[4] R. Lu et al., “Genomic characterization and epidemiology of 2019 novel coronavirus: implications for virus origins
and receptor binding”, e Lancet, vol. 395, no. 10224, pp. 565-574, Feb. 2020. https://doi.org/10.1016/S01
40-6736(20)30251-8
[5] M. Nicola et al., “e socio-economic implications of the coronavirus pandemic (COVID-19): A review”,
International journal of surgery, vol. 78, pp. 185-193, Jun, 2020. https://doi.org/10.1016/j.ijsu.2020.04.018
[6] UNESCO, “UNESCO’s support: Educational response to COVID-19”, 2020. https://en.unesco.org/covid19/e
ducationresponse/support
[7] H. Ritchie et al., “Mortality Risk of COVID-19”, Our World In Data, 2020. https://ourworldindata.org/morta
lity-risk-covid
[8] A. J. Christopher; N. Magesh; G. Tamil Preethi, “Dynamical Analysis of Corona-virus (COVID- 19) Epidemic
Model by Differential Transform Method”, Research Square preprint, (2020). https://www.researchsquare.com
/article/rs-25819/latest.pdf
[9] S. Ahmad; A. Ullah; Q. M. Al-Mdallal; H. Khan; K. Shaha; A. Khand, “Fractional order mathematical modeling
of COVID-19 transmission”, Chaos, Solitons & Fractals, vol. 139, Oct. 2020. https://doi.org/10.1016/j.chaos
.2020.110256
[10] J. L. Romeu, “A Markov Chain Model for Covid-19 Survival Analysis”, Jul. 2020. https://web.cortland.edu/m
atresearch/MarkovChainCovid2020.pdf
[11] R. Takele, “Stochastic modelling for predicting COVID-19 prevalence in East Africa Countries”, Infectious
Disease Modelling, vol. 5, pp. 598–607, 2020. https://doi.org/10.1016/j.idm.2020.08.005
[12] A. Zeb; E. Alzahrani; V. S. Erturk; G. Zaman, “Mathematical model for coronavirus disease 2019 (COVID-19)
containing isolation class”, BioMed research international, 2020. https://doi.org/10.1155/2020/3452402
[13] F. Ndaïrou; I. Area; J. J. Nieto; D. F. M. Torres, “Mathematical modeling of COVID-19 transmission dynamics
with a case study of Wuhan”, Chaos, Solitons & Fractals, vol. 135, Jun 2020. https://doi.org/10.1016/j.chaos.
2020.109846
[14] E. B. Postnikov, “Estimation of COVID-19 dynamics “on a back-of-envelope”: Does the simplest SIR model
provide quantitative parameters and predictions?”, Chaos, Solitons & Fractals, vol. 135, Jun. 2020. https://doi
.org/10.1016/j.chaos.2020.109841
[15] F. A. Rihan, “Numerical modeling of fractional-order biological systems”, Abstract and Applied Analysis, vol. 2013,
Aug. 2013. https://doi.org/10.1155/2013/816803
[16] A. Loverro, “Fractional calculus: history, definitions and applications for the engineer”,
2004. https://www.researchgate.net/publication/266882369_Fractional_Calculus_History_Definitions_and
_Applications_for_the_Engineer
[17] J. A. Tenreiro Machado et al., “Some applications of fractional calculus in engineering”, Mathematical problems
in engineering, vol. 2010, Article ID. 639801, Nov. 2010. https://doi.org/10.1155/2010/639801
[18] Md. Rafiul Islam; A. Peace; D. Medina; T. Oraby, “Integer versus fractional order seir deterministic and stochastic
models of measles”, Int. J. Environ. Res. Public Health, vol. 17, no. 6, Mar. 2020. https://doi.org/10.3390/ijer
ph17062014
[19] M. W. Hirsch; S. Smale; R. L Devaney, Differential equations, dynamical systems, and an introduction to chaos.
Academic press, 2013.
[20] W. C. Roda; M. B.Varughese; D. Han; M. Y. Li, “Why is it difficult to accurately predict the COVID-19
epidemic?”, Infectious Disease Modelling, vol 5, pp. 271- 281, 2020. https://doi.org/10.1016/j.idm.2020.03.001
[21] Worldometer, "Covid-19 Coronavirus Pandemic", 2020. https://www.worldometers.info/coronavirus/
[22] S. A. Lauer; K. H. Grantz; Q. Bi; F. K. Jones; Q. Zheng, “e incubation period of coronavirus disease 2019
(COVID-19) from publicly reported confirmed cases: estimation and application”, Annals of internal medicine,
vol. 172, no. 9, pp. 577–582, May. 2020. https://doi.org/10.7326/M20-0504
PDF generado a partir de XML-JATS4R por Redalyc
Proyecto académico sin fines de lucro, desarrollado bajo la iniciativa de acceso abiertoTecnoLógicas, 2021, vol. 24, núm. 51, e1866, Mayo-Septiembre, ISSN: 0123-7799 2256-5337
[23] E. C. De Oliveira; J. A. Tenreiro Machado, "A review of definitions for fractional derivatives and integral”,
Mathematical Problems in Engineering, vol. 2014, Jun. 2014 . https://doi.org/10.1155/2014/238459
[24] I. Podlubny, Fractional differential equations: an introduction to actional derivatives, actional differential
equations, to methods of their solution and some of their applications, vol 198, Elsevier, 1998.
[25] Z. M. Odibat, “Computing eigenelements of boundary value problems with fractional derivatives”, Applied
Mathematics and Computation, vol 215, no. 8, pp. 3017–3028, Dec. 2009. https://doi.org/10.1016/j.amc.200
9.09.049
[26] A. Arikoglu; I. Ozkol, “Solution of fractional differential equations by using differential transform method”,
Chaos, Solitons & Fractals, vol. 34, no. 5, pp. 1473–1481, Dec. 2007. https://doi.org/10.1016/j.chaos.2006.0
9.004
[27] V. S. Erturk; S. Momani, “Solving systems of fractional differential equations using differential transform
method”, Journal of Computational and Applied Mathematics, vol. 215, no. 1, pp. 142–151, May. 2008. https:
//doi.org/10.1016/j.cam.2007.03.029
[28] C. Jacques Kat; P. S. Els, “Validation metric based on relative error”, Mathematical and Computer Modelling of
Dynamical Systems, vol. 18, no. 5, pp. 487–520, Mar. 2012. https://doi.org/10.1080/13873954.2012.663392
[29] W. L. Oberkampf; M. F. Barone, “Measures of agreement between computation and experiment: validation
metrics”, Journal of Computational Physics, vol. 217, no. 1, pp. 5–36, Sep. 2006. https://doi.org/10.1016/j.jcp
.2006.03.037
[30] M. J. D. Powell, “e BOBYQA algorithm for bound constrained optimization without derivatives”, Cambridge
NA Report NA2009/06, University of Cambridge, Cambridge, 2009. https://www.damtp.cam.ac.uk/user/na
/NA_papers/NA2009_06.pdf
[31] C. Cartis; L. Roberts; O. Sheridan-Methven, “Escaping local minima with derivative-free methods: a numerical
investigation”, arXiv preprint arXiv:1812.11343. Oct. 2019. https://arxiv.org/pdf/1812.11343.pdf
[32] C. Cartis; J. Fiala; B. Marteau; L. Roberts, “Improving the flexibility and robustness of model-based derivative-
free optimization solvers”, ACM Transactions on Mathematical Soware, vol. 45, no. 3, pp. 1–41, Aug. 2019. h
ttps://doi.org/10.1145/3338517
Notes
- CONFLICT OF INTEREST
e authors declare that they have no conflict of interest.
- CONTRIBUTION OF THE AUTHORS
Anderson, S, Quintero: Computational implementation of solution algorithms and optimization application.
R.E. Gutiérrez-Carvajal: Proposal, analysis, verification, interpretation of models, results, study context and project
coordination.
Información adicional
Cómo citar / How to cite: A. S. Quintero; R. E. Gutiérrez-Carvajal, “Modeling the Evolution of SARS-CoV-2
Using a Fractional-Order SIR Approach”, TecnoLógicas, vol. 24, no. 51, e1866, 2021. https://doi.org/10.2
2430/22565337.1866
PDF generado a partir de XML-JATS4R por Redalyc
Proyecto académico sin fines de lucro, desarrollado bajo la iniciativa de acceso abiertoYou can also read