An Efficient way of Predicting Covid-19 using Machine and Deep Learning Algorithms - eudl
←
→
Page content transcription
If your browser does not render page correctly, please read the page content below
An Efficient way of Predicting Covid-19 using
                             Machine and Deep Learning Algorithms
                                                Meenakshi N1, Kumaresan Angappan2,Sandhya
                                                     A3,NagaSusmitha V4,Vaishnavi K5
                                   {abu221985@gmail.com1, kummaresan@gmail.com2,
                                           chenchusandhya1999@gmail.com3,
                          susmithasubramanyam1234@gmail.com4, vaishnavi12345@gmail.com5}

                                            Department of Information Technology, Hindustan Institute
                                                 of Technology and Science, Chennai, India1,2,3,4

                                    Abstract- Recently the novel coronavirus disease pushed the world into the dramatic
                                situation. The tough thing to deal with novel corona virus is the prediction. In the
                                beginning RT PCR test is the golden standard test for the prediction of COVID, which
                                takes more time, more licensed laboratories, trained personnel and prediction accuracy
                                will be not fruitful. In our System, We used current technology for the prediction, which
                                involves: An Efficient Random Forest, a machine learning classification model which
                                predicts whether the person is Corona affected or not using routine blood reports and a
                                deep learning model, Modified DenseNet121 which was pre-trained to predict theCovid
                                using CT scan images. To analyze the machine learning model performance, 5744 blood
                                report samples have been collected from Kagglerepository;similarly, 2482 CT
                                scan samples have been collected from the Kaggle repository, for prediction using
                                Random Forest and DenseNet121 model. The proposed model which is developed using
                                machine and deep learning techniques can be deployed easily and can be used for rapid
                                and accurate prediction of Covid19.

                                Keywords— COVID-19, clinical data analysis, Machine Learning, Deep Learning,
                                Blood test, CT scan, Efficient Random Forest, Modified DenseNet121.

                       1 Introduction

                            COVID 19 [1][2] is an infection which occurs atrespiratory organs caused by SARS-
                       CoV-2 virus. This novel coronavirusseverely affects the acute respiratory syndrome
                       coronavirus 2 which is first appeared in Wuhan, China in December 2019.On 11th
                       March,2020 WorldHealth Organization(WHO) announced upsurgeof Covid19 as pandemic in
                       the global level. The growth of Coronavirus will be more when people come contact with
                       other people directly. So, there it was mandatory to stop people travelling from one location
                       to the other. And it is advised to wash the hands repeatedly for every 1 hour. This step may
                       not prevent Corona however make us safe from being Corona affected. The general

I3CAC 2021, June 07-08, Chennai, India
Copyright © 2021 EAI
DOI 10.4108/eai.7-6-2021.2308785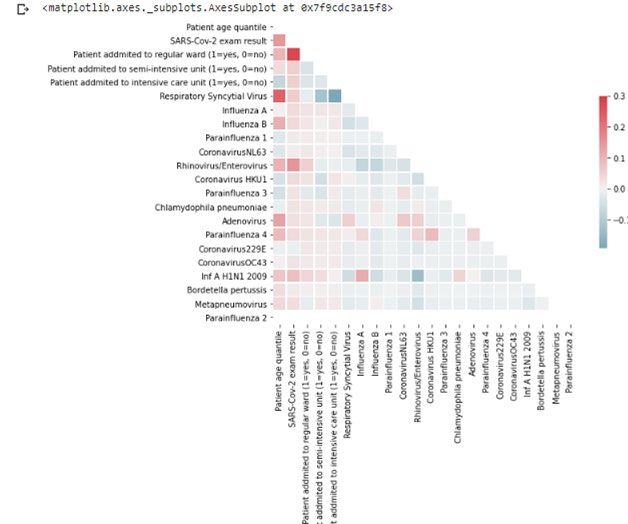
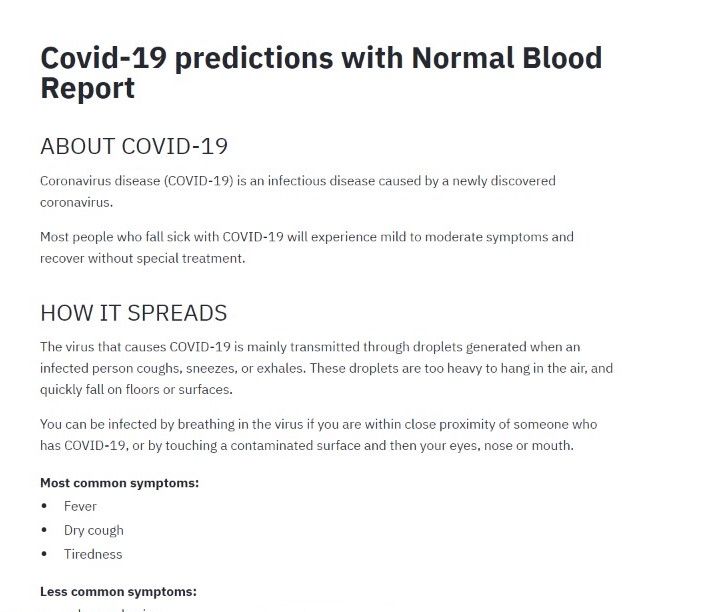
symptoms which was exhibited in many people are cough and fever and other symptoms may
occur, including chest discomfort, sputum development.
     The Coronavirus disease first started as an infection in throat along with any of the
following symptoms : Cough, fever, body pains, headache, loss of smell and taste. It will
easily spreads from one person to another person when they make direct contact with covid-
19 infected patients. Jiang and his team [3] conducted a research and found 4.5 % as death
rate with Covid19 infection across the world. Covid positive patients with age range of 70 to
79 years the death rate is 8.0%, and for patients above 80 years the death rate is 14.8%. It is
also confirmed that the risk prediction of Corona Virus is at peek zone for the patients who
are above the age of 50 years with chronic illnesses therefore they should take
special precautions, care and attention. One of the pressing issue with Covid 19 is rapid
spread of the disease that means if around 20 people are affected with COVID-19 positive,
then they are more likely to infect 25–45 other people [4] within their community. Therefore,
COVID 19 can be affected to large group of people with in less span of time until or unless
some preventive measures are implemented.
     At the beginning of the pandemic, RT-PCR [5], a gold standard test which is used to
detect COVID-19 infection. Real-time Reverse Transcription Polymerase Chain Reaction
(RT-PCR), generally this test analysis the De-oxyribo Nucleic Acids (DNA), however
DNA is not collected directly, RNA is collected and then the collected RNA has to be
converted to DNA because of this it is “Reverse Transcription”. In this test first swab test is
performed to collect nasalsecrations and then the secrataions are analysed to find the Corona.
But, lack of equipment and high standard Isolated laboratories for screening limited the fast
and accurate testing. Later, the reverse transcription polymerase chain reaction (RT-PCR) [5]
also giving false results.
     In Wuhan China, clinical study with 1015 patients has shown that chest computed
tomography(CT) analysis can achieve 0.97 of sensitivity, 0.68 of accuracy , 0.25 of
specificity to detect COVID 19 disease, with RT-PCR [6]. Symptoms of coronavirus in
lower parts of lungs gives more accuracy by using CT Scan[7][8][9] than using RT-PCR. To
assist radiologists for the prediction of COVID 19 using CT Scan, we need to improve the
system speed(prediction of COVID 19). This can be done by using Automatic
diagnostic system, uses Machine Learning (changes in blood parameters of COVID-19
patients plays an important role in predicting coronavirus infection) and Deep Learning
algorithms. Even for an experienced physicianit is difficult to extract all the
necessary information from blood tests. Machine Learning algorithms can learn and
distinguish various patterns from blood report analysis. Blood tests based ML System
approach for Covid detection provides easy to use, a fast, accessible less expensive and
more accessible less alternative to costly and time taking methods(like imaging based
method and RT-PCR test. This approach is to decrease the mortality rate, the time , spread
ratio and efforts by narrow down the testing time and produce fast and accurate results.
     In our Model we are using :
     - Machine Learning and Deep Learning algorithms[7] based diagnostic system used for
early detection and fast assessment of risk detection in Coronavirus infection and it can be
easily deployed.
     - The ML Algorithms we are used : Random Forest[10], Decision Tree[11], Logistic
Regression, Support Vector Machine[12] to detect negative/positive results of COVID-19
patients from blood reports and found Random Forest as best algorithm
     - And DL Algorithm Modified DENSENET 121 is used for diagnosis of COVID-19
infection through CT Scan images.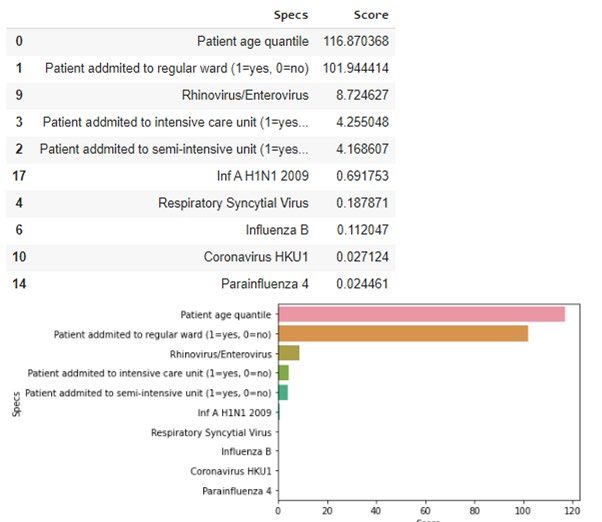
- Integration of blood reports( laboratory/clinical blood reports) and radiological data (CT
Scan) used to detect the Coronavirus presence.
    In this Model, we concluded that Machine Learning and Deep Learning based classifier
provides a diagnostic tool for prediction of COVID-19 using blood report samples,and CT
Scan images.

2 RELATED WORKS

     Beginning from the flare-up of the Covid numerous specialists are dealing with this,
finding a wide range of ways for recognizing Coronavirus and just as for its cure. It is hard to
distinguish uncovered people since they don’t show infection indications right away. Along
these lines, it is important to discover a strategy for assessing the quantity of conceivably
contaminated people consistently to receive the suitable measures. Machine Learning and
Deep Learning can be utilized to inspect an individual for Coronavirus as an option in
contrast to customary techniques which are tedious and expensive. Although there are a
few investigations on Coronavirus, this examination zeroed in on the utilization of ML in
diagnosing patients for Coronavirus disease through Blood Reports, and CT Scan pictures.
     Many researches have been done in this area(Machine Learning) and found the greatest
advantage of Machine Learning, which can be trained with the existing data, further we can
use that trained model for the prediction of the Covid 19. In our Model, Machine Learning
was implemented by considering blood report samples to predict whether a patient is positive
for COVID-19 and used Deep Learning based Densenet technique by using CT Scan pictures.
2.1COVID-19 DIAGNOSIS USING DEEP LEARNING MODEL :

     It has been observed that the usage of Artificial Intelligence, Machine and Deep
Learning has been increasing day by day in various field (example: medicine ,malware
detection )[13],[14]. In 2012, deep learning a modern Machine learning system
was introduced, which is based on Densely connected convolutional network a model of Deep
Learning[20]. Deep learning consists of different techniques to deal with various problems, it
comprises various layers for learning the data hidden in the images and from that learning it
takes some decisions which we can use those decisions for the prediction. According to Le
Cun and his team members[15], deep-learning techniques provides more accuracies and can
speedup the output when compared with humans
2.1.1CT Scan Diagnosis Using Deep Learning Model :
    Godfrey Hounsfield and Allan Cormack developed CT Scan 1972. The main advantage
of CT scanning does not involve any pain, helps for precise prediction, consists of three-
dimensional images [16 [17].
    Jiang and his team[18] compared RT-PCR and CT Scans for 51 patients which comprises
29 men and 22 women with the history of travel to or residency in pandemic areas and
founded that they are exhibiting the symptoms of fever and their CT Scan reports
showed that they are having respiratory infection. They found sensitivity of the CT Scan
reports as 98%, while the sensitivity of the golden standard RT-PCR found to be 71%.
    Wang and his team [19] developed a deep-learning approach to extract the information(
to understand the Covid19 features) from CT scans. Their study included a collection of 453
CT scans from 99 patients. They extracted 195 regions of interest (ROIs) of sizes ranging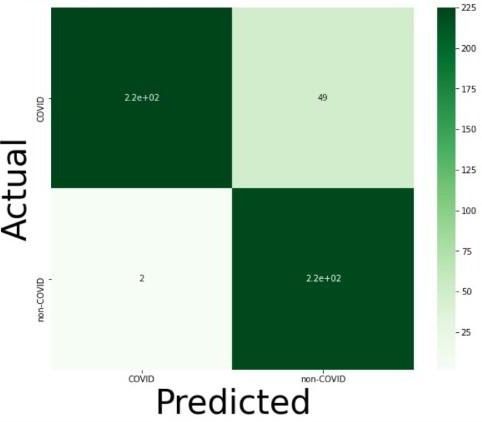
from 395×223 to 636×533 pixels from the CT scans of 44 COVID-19-positive pneumonia
patients and 258 ROIs from those of 50 COVID-19-negative patients. They have applied a
modified network inception model and gained an accuracy of 82.9% for the internal
validation with a specificity of around 80.5% and sensitivity of the model stand up at 84%.
They tested the model with external dataset and that testing showed results as 73.1 % as total
accuracy and specificity and sensitivity of the model is 67% and 74% respectively.
2.2COVID-19          INFECTION              PREDICTION            USING         MACHINE
LEARNINGTECHNIQUES:
     Machine Learning is one of the largest technology in the Artificial Intelligence which
comprises Deep Learning. It uses the concepts of mathematics like regression, probability etc
to learn and analyze the interesting patterns from the data. Machine learning models
are applied to a system and patterns are recongnised, the obtained validation data are then
divided according to the patterns learned during the learning or training process. Hence
machine learning can be used to predict the behavior from blood reports to decrease the
spreading of virus in the early stages.
     Wu along with his team members made the first study with the help of Random Forest
Algorithm, a classification model of Machine Learning algorithm to detect covid 19 from
samples of blood reports. They collected dataset which comprises of 253 blood report data of
which 105 blood report data consists of COVID-19 cases, the data is collected from different
hospitals in Lanzhou, China. From the sample blood report they identified 11 features as key
features out of 49 features which they examined. Some of the key features are Leukocytes,
Monocytes, Red Blood Cells etc.
     Then the Random Forest model is built and then trained with 11 key features and resulted
are noted. In results we can observe that model showed sensitivity of 95.12%, and specificity
around 96.97% comprising the overall accuracy of the model as 96.95%.
     However the performance of the model with the external data is not compromising, it
was bit lower compared with trained result.
     In addition to that the dataset is biased towards covid 19 positive data therefore the
performance of the model will suffer for non Covid patient sample blood report s in the
dataset.

3 An Efficient Random Forest Algorithm and Modified Densenet-121
Architecture

     In our Model, we are using two algorithms. Machine Learning Algorithm(An Efficient
Random Forest) was implemented by considering blood report samples and Deep Learning
based Densenet technique implemented by using CT Scan picturesto predict whether a patient
is positive for COVID-19 or not.
3.1Efficient Random Forest Algorithm:

     Random Forest is one of the machine learning model which is used for classification. It is
supervised learning model which means the model is trained with the training data and is
tested with new sample of data (test data).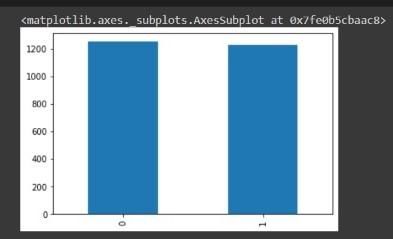
It is used for classification purpose and regression purpose and it is an ensemble learning
model, it supports hyper parameter tuning all these together make the model more efficient.As
the name suggests it considers multiple decision tree output to produce the final output, this is
the advantage of the efficient Random Forest algorithm, it considers the output with majority
votes by not depending on the single tree output. Thus increases the accuracy of the Random
Forest Algorithm. The greater number of trees in theforest leads to higher accuracy and
prevents the problem of overfitting byaveraging the result . One more advantage with Random
Forest is, itsupports Hyper Parameter tuning whichagain increases thePrediction accuracy.
     Efficient Random Forest Algorithm consists of two steps,
     Creation of Random Forest
           ii) Predicting from the created Random Forest

                                Fig. (1) Random Forest Model
The table shows the list of 21 attributes that are significant for the experiment.
                            #        Feature            Description
                           1.         age               Age in years
                           2.       Patient admitted to
                                     semi-intensive unit[0= No/Not admitted; 1= Yes/admitted]
                           3.       Patient admitted to
                                     regular ward                      [0= No/Not admitted; 1=
                           Yes/admitted]
                           4.       Patient admitted to
                                     Intensive-care     unit    [0=      No/Not      admitted;   1=
                           Yes/admitted]
                           5.       Respiratory syncytial
                                            virusdetected/Not-detected
                           6.          Influenza A        detected/not-detected
                           7.        Influenza B        detected/not-detected
8. Parainfluenza 1 detected/not-detected
9. coronavirusNL63detected/not-detected
10. Rhinovirus/Enterovirusdetected/not-detected
11. Coronavirus HKU1 detected/not-detected
12. Parainfluenza 2 detected/not-detected
13. Parainfluenza 3 detected/not-detected
14. Adenovirus detected/not-detected
15. Parainfluenza 4 detected/not-detected
16. Coronavirus 229E detected/not-detected
17. CoronavirusOC43 detected/not-detected
18. Inf A H1N1 2009 detected/not-detected
19. Metapneumovirusdetected/not-detected
20. Bordetella pertussis detected/not-detected
21. Chlamydophiladetected/not-detected
Pneumoniae
Table. (1) List of attributes
In the Hyper Parameter Tuning (used to inform the model how fastly it has to learn, it is
like controlling the behavior of the model) we used number of estimators as “600” and criteria
to be followed as “Gini Index”, minimum number of splits is 5, and minimum sample leaves
is 1, and maximum features has to be learned is auto and random_state to be 1.
- We used dataset consisting of 5644 data
- We considered more number of attributes which enables the model to predict accuracy.
3.2MODIFIEDDENSE NET ARCHITECTURE (DENSENET 121):
Densenet(121) is the Deep Learning Architecture (transfer model) which is pertained on
huge Image dataset. It is especially designed for Image Classification and Prediction.
Modified Denset 121 is a part of Convolutional Neural Network, in this DenseNet the layers
are connected to each other through Dense Blocks. Each layer in the architecture produces the
output in which this output is considered as input for the succeeding layers. Dense net consists
of layers as a block (Dense Block), where layers are densely connected to each other, so this
makes the algorithm to learn the features fastly and accurately.
The main components in theModified DenseNet architecture are:
1.Dense Blocks and 2.Transition Layers.
1. DenseBlock : It consists of multiple convolution blocks (layers ) each one having the
equal number of output channels, but, in the channel dimension we combines both input and
output channels.
2. Transition Layers : If we increase the dense block then the number of channels will
also be increasing which in turn makes the model complex. To reduce them we use Transition
layers . So basically it is used to control the model complexity along with that it reduces the
channel number. To achieve this ot uses the concept of 1*1 convolution layer.Fig. (2) Modified Densenet-121 Model
To predict Covid19 usingCTSCan our denset121 architecture consists of following
layers:
Input Layer : Image height, image width and number of input channels (red, green ,blue
are considered for our image which is 3).We used image size as 64*64.
ii. Conv 2d (convolutional 2D): We are using CT Scan because the effectiveness of
prediction of Covid19 will be great and in general to predict presence of Covid19 using CT
Scan requires doctors keen observation and sometimes doctors prediction might go wrong.
Here the technology comes into picture.With the help of Deep Learning Convolution
NeuralNetworks(DenseNet121) we can reduce the task for the doctor and prediction will be
accurate as we are training more dataset and tested to guarantee the accuracy of the model.
iii.GlobalAverage_Pooling:In transition layers we are reducing number of channels to
half of the excisting channels. Here, there are 1*1 conv layer and 2*2 average_pooling layer
with stride of size 2.At last, we have globalAveragepooling, followed by final output
layer.GlobalAveragePooling is applied on denseblock to make the connections.
4 METHODOLOGY :
4.1 . Dataset:
The dataset which was used to train the model is to predict COVID-19 and was gathered
from Kagglerepository.It contains 5644 data about COVID-19 infected patients with 111
attributes, but all the the experiments refer to use a subset of 21 attributes. The attributes arecategorical, real and integer values. The dataset classify into two i.e., training and testing
dataset.
And also we collected a datasets containingCT scan images to predict covid-19 from
Kaggle Repository which contains 2 classes I.eCovid, Non-Covid.Because of limited
availability of ct scan images we applied dataaugumentation.Data Augumentation methods are
used commonly in Machine Learning to address class Imbalance problems,overfitting can be
reduced in deep learning and improves convergence, which ultimately gives better results.
4.2 Data analysis
Data analysis performs major tasks such as data cleaning and integration, identification of
missing values and removing the redundant data. Pandas recognizes all the features as
numerical either as integers or floats. But some of the attributes are categorical in the dataset
as their numbers represent mappings to a real-world phenomenon. Hence, Exploratory Data
analysis is performed where first, the list of all the features which are numerical is saved in a
column in order to not mix in the analysis with categorical variables. Using Pandas Profiling,
distribution of each variable is visualized and a detailed profile report is generated with
inference type, quantile statistics, descriptive statistics etc. for exploratory data analysis.
The interactions between each variable is defined with their correlations such as Pearson's
correlation coefficient for the measure of linear correlation between two variables; Spearman's
correlation coefficient for detecting the nonlinear monotonic correlations between the
variables and Cramer’s V coefficient for association measure of nominal random variables.
To pick the features that have best relationship with the performance variable, statistical
tests are used. The SelectKBest class from the scikit-learn library is used to select features of
different statistical tests. The proposed system uses the Chi-Squared test for non-negative
features to select best features from the dataset and then ranks the features according to their
importance as shown in Fig. (3).
Fig. (3) Feature Importance - Efficient Random Forest Algorithm
Using the Model Characteristics property, the significance of each feature of
theblood_reports Dataset is gained. To extract the top features from the dataset, the Extra TreeClassifier is used where feature importance is a built-in class with Tree Based classifiers. A
score for every function is given by the Feature value and it determines the significance of the
performance variable.
With the seaborn library, the correlation matrix with Heatmap is generated to indicate
how the features are related to each other as well as the target variable. Fig. (4) shows the
correlation values between the variables, which are positive or negative in nature.
Fig. (4) Correlation Coefficient of attributes
4.3 Experimental Analysis
I. An Efficient Random Forest Algorithm:
Step- 1: Identified dataset from Kaggle.
Step- 2: Read the dataset using Pandas.
Import pandas as p
data = p.read_csv(“dataset.csv”)
Step 3: Findout the missing values using
data.isnull().sum()
Step- 3: Drop non required columns likes serial number etc using
data.drop(columnname)
Step- 4: Drop the columns which are having missing rate(null values of the data) > 20%
using
data.drop()
step- 5: Find the datatype of the attributes ( We need to use integer for better prediction.)
dat = data.select_dtypes([‘data type name’]) to display all available attributes of that data
type.
Step- 6: Convert them to Integer data type using Label Encoder.le = preprocessing.LabelEncoder()
step- 7: Plot the heatmap to find the corelation between featureswith
cmap = sns.diverging_palette(220, 10, as_cmap=True)
sns.heatmap(corr, mask=mask, cmap=cmap, vmax=.3,
center=0,square=True, linewidths=.5, cbar_kws={"shrink": .5})
Step- 7: Find out the importance of from the available features Using SelectKBest.
X = data.loc[:, data.columns != 'SARS-Cov-2 exam result']
y = data['SARS-Cov-2 exam result']
betfea = SelectKBest(score_func=chi2, k=10)
Here we need to identify the predicting variable from our dataset and has to be stored in
separate variable and then we need to perform the ChiSquareTest .
Plot a bar graph to understand the feature importance visually.
sns.barplot(x="Score", y="Specs", data=featurescore)
Step- 8: Find the ratio of values present in predicting variable, it should be almost same
else the prediction of the model is going to be biased. To avoid those scenarios we need to
perform:
Find the ratio values present in predicting variable
If the ratio is almost same then
Skip this step
Else then
Perform Sampling.
To our dataset we are using RandomSampler.
rus = RandomUnderSampler(random_state=42).
Step- 9: Split the datset into 2 parts among which one is used for training and other one
will be used for testing.
X_train, X_test, y_train, y_test = train_test_split(X_re_s, y_re_s,
test_size=0.1, random_state=42)
We splitted the data in the ratio of 90:10 in which
90% iis used for training and 10% of data is usedfor testing.
Step- 10: Build and Train the model.
model_random= RandomForestClassifier(criterion="gini",n_est
imators=600,min_samples_split=5,min_samples_leaf=1,
max_features="auto",oob_score=True,random_state=1)
model_random.fit(X_train, y_train)
Step-11:Calculate and display the precision,recall and ROC:
Precision: scores.get('test_precision').mean())
Recall: scores.get('test_recall').mean())
ROC_ACU: scores.get('test_roc_auc').mean())
II. MODIFIEDDENSE NET ARCHITECTURE (DENSENET 121):
Step-1: First, we load the dataset then split it into covid and non covid (Using head and
tail method)
Step-2: Then plot the count plot for finding the sampling.
Step-3: if(data is undersampled):
dodataagumentation process
else if (data is oversampled):
remove unnecessary data
else:go to next step
Step-4: Resize the given images to standard pixels(i.e 64)
Step-5.Resize the images using resize().
Step-6.Split the dataset into train and test in the ratio of 80:20 using test_train_split()
Step-7. Now, set values:
BATCH_SIZE = 64
EPOCHS = 25
SIZE=64
N_chen =3
Step-8.Build the model() by using following inbuilt functions:
a. input()
b. convolution()
c. densnet()
d. GlobalAveragePooling2D()
e. BatchNormalization()
f. Dropout()
g. Dense()
h. BatchNormalization()
i. dropout()
Step-9.stores the model using model variable
Step-10.optimize the model using adam optimizer
Step-11.run the model to findout the accuracy
Step-12. Testing the model
a.fit the model with test data using test dataset
b.Store the results
Fig. (5) Model Output4.4
Simulation And Analysis:
Fig.Metric
Table 2.Comparison using Performance (6) Samplified data
– accuracy
Algorithm Accuracy
Gradient Boost Classification 76.6%
Logistic Regression 65.22%
Decision Tree Algorithm 69.57%
Support Vector Machine 79.82%
Random Forest Algorithm 80%
An Efficient Random Forest Algorithm 82.1%
From the above table.2 we concluded that Efficient Random Forest Algorithm is giving
high accuracy than the other algorithms.An accuracy of 82.1% has been achieved after
implementing Efficient Random Forest Algorithm on the blood_test_reports dataset.
Fig. (7)Efficient Random Forest Confusion MatrixThe Confusion Matrix shows the True Positive value and true Negative value.The ROC
for Efficient Random Forest Algorithm is found and the Area under curve of the ROC is also
found as best which says that the predictions are excellently made by the classifier.
Fig. (8)Modified Densenet121 Confusion Matrix
The Confusion Matrix shows the True Positive value and true Negative values of the
model.
Fig. (9)ModifiedDensenet 121 Model AnalysisThe ROC for Densenet-121 Architecture Modelfound and the Area under curve of the
ROC is also found as best which says that the predictions are excellently made by the
classifier.
A web app has been deployed on the predictive model for the diagnosis of Covid patients.
The web application takes the following features as input: Age, influenza, ,Adenovirus,
parainfluenza etc. These are the most important features in predicting the risk of Covid-19
infection. After the input is gathered, the model runs and predicts whether the person is covid
affected or not in an effective manner.
Fig. (10) Webapp Screenshot-1
Fig. (11) Webapp screenshot-2Fig. (12) Webapp screenshot-3
Fig. (13) Webapp CT-Scan Screenshot
Conclusion
In the rapidly spreading of global pandemic there is a need to improve current testing
methods by implementing Machine Learning in the medical field. Which will give fast and
accurate results in short period of time. And also helps in early prediction of the virus. Our
experimental outputs showing that the proposed methods(machine learning algorithm
I.e..EfficientRandom Forest and deep learning algorithm I.e..ModifiedDensenet-121)was
trained properly with large dataset.In future work we want to implement same procedure to
predict covid-19 using CT Scan images.ACKNOWLEDGEMENTS The final outcome and success of this project required a lot of assistance and guidance and we are extremely privileged to have this along the completion of the project. All that we have done is only due to such assistance and supervision and we thank our guides Dr. Meenakshi N and Dr. Kumaresan A for the support. References : [1] C. Wang, P. W. Horby, F. G. Hayden, and G. F. Gao, “A novel coronavirus outbreak of global health concern,” Lancet, vol. 395, no. 10223, pp. 470–473, Feb. 2020. [2] C. Huang et al., “Clinical features of patients infected with 2019 novel coronavirus in Wuhan, China,” Lancet, vol. 395, no. 10223, pp. 497–506, Feb. 2020. [3] F. Jiang, L. Deng, L. Zhang, Y. Cai, C. W. Cheung, and Z. Xia, "Review of the clinical characteristics of coronavirus disease 2019 (COVID-19)," Journal of General Internal Medicine, pp. 1-5, 2020. [4] Z. Wu and J. M. McGoogan, "Characteristics of and important lessons from the coronavirus disease 2019 (COVID-19) outbreak in China: summary of a report of 72 314 cases from the Chinese Center for Disease Control and Prevention," Jama, 2020. [5] World Health Organization, "Laboratory testing for coronavirus disease 2019 (COVID-19) in suspected human cases: Interim guidance, 2 March 2020," World Health Organization, World Health Organization, 2020. [6] T. Ai et al., “Correlation of chest CT and RT-PCR testing in coronavirus disease 2019 (COVID-19) in China: A report of 1014 cases,” Radiology, vol. 2019, Feb. 2020, Art. no. 200642. [7] L. Li, L. Qin, Z. Xu, Y. Yin, X. Wang, B. Kong, J. Bai, Y. Lu, Z. Fang, Q. Song, K. Cao, D. Liu, G. Wang, Q. Xu, X. Fang, S. Zhang, J. Xia, and J. Xia, ‘‘Artificial intelligence distinguishes COVID-19 from community acquired pneumonia on chest CT,’’ Radiology, vol. 296, Mar. 2020. [8] S. Ahuja, B. Panigrahi, N. Dey, T. Gandhi, and V. Rajinikanth, ‘‘Deep transfer learning-based automated detection of COVID-19 from lung CT scan slices,’’ Techrxiv, 2020 [9] M. Anthimopoulos, S. Christodoulidis, L. Ebner, A. Christe, and S. Mougiakakou, ‘‘Lung pattern classification for interstitial lung diseases using a deep convolutional neural network,’’ IEEE Trans. Med. Imag., vol. 35, no. 5, pp. 1207–1216, May 2016.
[10] Safavian SR, Landgrebe D. A survey of decision tree classifier methodology.IEEE transactions on
systems, man, and cybernetics. 1991;21(3):660–674. doi: 10.1109/21.97458.

[11]    Kam H.T.: Random decision forest.. In: Proceedings of the 3rd International Conference on
Document Analysis and Recognition, Montreal, Canada, August, vol 1416, p 278282, 1995

[12] Schölkopf B, Smola A.J., Bach F., et al., 2002 Learning with kernels: support vector machines,
regularization, optimization, and beyond. MIT press

[13]    A. A. Ogunleye and W. Qing-Guo, "XGBoost model for chronic kidney disease diagnosis,"
IEEE/ACM transactions on computational biology and bioinformatics, 2019.

[14]    M. Kim, J. Yun, Y. Cho, K. Shin, R. Jang, H.-J. Bae, and N. Kim, ‘‘Deep learning in medical
imaging,’’ Neurospine, vol. 16, no. 4, pp. 657–668, 2019

[15] Y. LeCun, Y. Bengio, and G. Hinton,"Deep learning," nature, vol. 521, pp. 436-444, 2015

[16]    C. Feng, A. Elazab, P. Yang, T. Wang, F. Zhou, H. Hu, et al., "Deep Learning Framework for
Alzheimer’s Disease Diagnosis via 3D-CNN and FSBi-LSTM," IEEE Access, vol. 7, pp. 63605-63618,
2019.

[17] C. Rachna. (2020, 15 April 2020). Difference betweenX-ray and CT Scan.

[18]     F. Jiang, L. Deng, L. Zhang, Y. Cai, C. W. Cheung,and Z. Xia, "Review of the clinical
characteristics of                 coronavirus disease 2019 (COVID-19)," Journal of General Internal
Medicine, pp. 1-5, 2020.

[19] S. Wang, B. Kang, J. Ma, X. Zeng, M. Xiao, J. Guo, et al., "A deep learning algorithm using CT
images to screen for Corona Virus Disease (COVID-19)," medRxiv, 2020.

[20] P. K. Sethy and S. K. Behera, "Detection of coronavirus Disease (COVID-19) based on Deep
Features," 2020.

[21] Gino Sophia, Ceronmani Sharmila, "Recognition, Classification for Normal,Contact and
Cosmetic Iris Images using Deep Learning", International Journal of Engineering and Advanced
Technology, Vol. No. 8, Issue No. 3, ISSN : 2277-3878, pp. 4334-4340, September 2019.
You can also read