The Impact of the Coronavirus Disease 2019 Pandemic on Investor Sentiment-Evidence From A-Share Listed Companies in China
←
→
Page content transcription
If your browser does not render page correctly, please read the page content below
ORIGINAL RESEARCH
                                                                                                                                           published: 13 September 2021
                                                                                                                                         doi: 10.3389/fpsyg.2021.743306

                                                The Impact of the Coronavirus
                                                Disease 2019 Pandemic on Investor
                                                Sentiment—Evidence From A-Share
                                                Listed Companies in China
                                                Yuegang Song 1 , Xiazhen Hao 1 and Zhou Lu 2*
                                                1
                                                 School of Business, Henan Normal University, Xinxiang, China, 2 School of Economics, Tianjin University of Commerce,
                                                Tianjin, China

                                                In a DID model, this study examines the impact of the coronavirus disease 2019
                                                (COVID-19) pandemic on the investor sentiment in the financial market of China using
                                                monthly panel data on newly listed Chinese companies between October 2019 and
                                                June 2020. The outbreak of the pandemic is shown to exert a significant negative
                                                impact on investor sentiment. A future industry heterogeneity analysis shows that the
                                                pandemic has driven up investor sentiment in the pharmaceutical sector while having
                                                a significantly negative impact on non-pharmaceutical sectors. The pandemic is shown
                                                to have a negative impact on the private sector and foreign-invested sector in China
                          Edited by:
                       Giray Gozgor,            while a significantly positive impact on the state-owned sector. This study contributes to
 Istanbul Medeniyet University, Turkey          the existing literature on the investigation of how significant the impact of public health
                       Reviewed by:             emergencies on investor sentiment is.
                          Ren Zhang,
 Texas State University, United States          Keywords: investor sentiment, COVID-19 pandemic, difference-in-differences model, financial market, A-share
                               Lili Zhu,        listed companies
Shenandoah University, United States

                  *Correspondence:
                            Zhou Lu             INTRODUCTION
                luzhou59@tjcu.edu.cn
                                                The 2020 outbreak of the coronavirus disease 2019 (COVID-19) pandemic, a global public health
                   Specialty section:           crisis, has hit the Chinese economy and the world economy hard. According to the WHO statistics,
         This article was submitted to          the pandemic has swept across more than 200 countries, causing a total of 83 million people
           Environmental Psychology,            worldwide with confirmed infection while killing over 1.8 million people.
               a section of the journal             The impact of the COVID-19 pandemic on the financial market of China is substantial. Shanghai
               Frontiers in Psychology
                                                Composite dipped by around 7.7%, a 5-year single-day low. At the same time, CSI Aggregate Bond
             Received: 18 July 2021             rose by about 0.62%, a second decade-high. The forex market and currency market are also hit
         Accepted: 16 August 2021               to various extents. Investor sentiment can reflect the general market trend and market vitality
      Published: 13 September 2021
                                                (Yu et al., 2020). Then, does the pandemic exert an impact on investor sentiment? If the answer
                             Citation:          is yes, then how should we measure the impact? Does investor sentiment vary across firm types
   Song Y, Hao X and Lu Z (2021) The
                                                and industries? How should China respond to the change? The answers to the above questions
    Impact of the Coronavirus Disease
           2019 Pandemic on Investor
                                                may help policymakers take measures to stabilize the financial market and formulate solutions to
  Sentiment—Evidence From A-Share               financial market turmoil. However, there is a minimal existing research literature on the impact
           Listed Companies in China.           of major public health events on investor sentiment. This study is intended to contribute to the
           Front. Psychol. 12:743306.           understanding of this issue by looking at the impact of the COVID-19 pandemic on investor
     doi: 10.3389/fpsyg.2021.743306             sentiment in the financial market of China.

Frontiers in Psychology | www.frontiersin.org                                         1                                     September 2021 | Volume 12 | Article 743306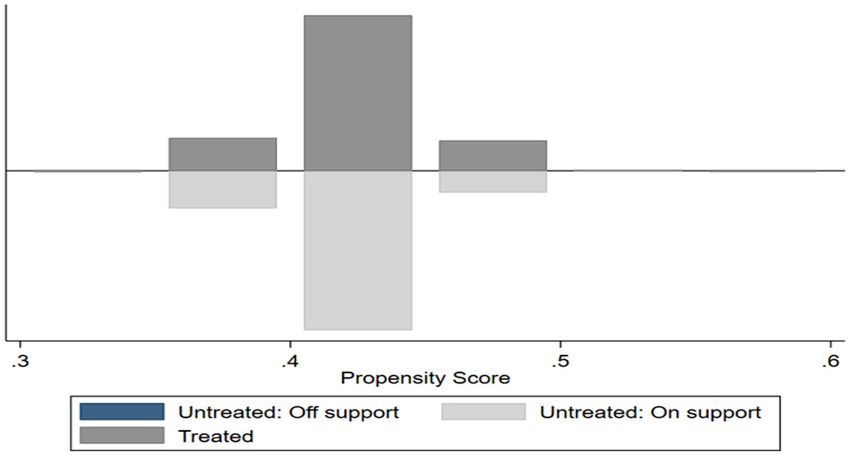
Song et al.                                                                                                     COVID-19 and Investor Sentiment

   This study uses a difference-in-difference (DID) model to             2000). In studying the correlation of asset pricing with investor
study the impact of the COVID-19 pandemic on investor                    sentiment, Brown and Cliff (2005) suggested the latter indicator
sentiment in the financial market of China. The improved                 has an impact on the former, i.e., investor sentiment change leads
turnover rate is used to measure the investor sentiment on               to stock fluctuation. Based on the statistics of the Chinese stock
individual stocks. This study focuses on the following variables:        market, Xie and Tang (2021) concluded that positive investor
trading volume, free float equity, market value, financial               sentiment can drive up the yield rate to some degree and this
indicators, etc., trying to study the impact of major economic           impact can last for around a year. Gozgor et al. (2019) pointed
shocks on investor sentiment in theA-share market of China.              out that economic policy uncertainty affects gold returns, which
This study has important policy value for economic policies in           in turn affects investor behavior and investor sentiment. During
responding to major public health incidents, stabilizing the A-          periods of high economic policy uncertainty, especially during
share market, and safeguarding economic development in China.            the early 2020s and the COVID-19 pandemic, economic policy
   The rest of the study is roughly organized as follows. The            uncertainty exerts a considerable impact on the financial stock
“Literature review” section reviews the previous studies. The            market and affects investment returns (Wu et al., 2021). Li et al.
“Model, variable selection, and data sources” section explains           (2017) and Zhang et al. (2021) constructed investment sentiment
the model, variable, and data. The “Empirical analysis and               indicators and analyzed the impact of external shocks on the
findings” section provides the details of the empirical analyses.        sentiment of Chinese investors.
The “Conclusion” section concludes.

                                                                         Literature on the Impacts of Major Public
LITERATURE REVIEW
                                                                         Health Events
Investor Sentiment Literature                                            Since the twenty-first century, there have been five grave
Behavioral finance theories imply a considerable impact of               pandemics of infectious diseases defined by WHO as major
the psychological factors of the investor on the financial               public health events on a global scale or higher. Many scholars
market. Existing approaches to measuring investor sentiment              have assessed the impact of these events on the growth of the
include direct proxy, indirect proxy, and text mining. In direct         economy as a whole (Brainerd and Sieglar, 2003; Wu, 2003;
proxy, Brown and Cliff (2005) used a questionnaire survey                Hanna and Huang, 2006). Barro et al. (2020), based on the death
to understand the outlooks of the investor on market trends.             toll during the 1918–1929 influenza pandemic and the death
Kenneth and Meir (2000) categorized the investors into three             toll in World War I, estimated the death toll of the COVID-
subcategories, namely, large investors, medium-size investors,           19 pandemic and its economic impact, finding the severely
and small investors. Jiang et al. (2021) regarded the Baidu index        impacted countries registered a 6% drop and an 8% drop in GDP
as an indicator of investor sentiment and believed that investor         and consumption, respectively. The outbreak of the COVID-19
sentiment is usually affected by the information provided by the         pandemic interrupts the product supply chain, and the global
Baidu search engine, which may cause stock prices to fluctuate.          economy is in face of a recession (Shang et al., 2021). Brem et al.
As single-indicator-based measurement may be subjected to                (2021) discussed 10 technologies that play a major role in the
bias, some scholars constructed an index system to measure               COVID-19 crisis and found that technological innovation has a
investor sentiment. Baker and Wurgler (2006) and Yi and                  key role in response to the epidemic and subsequent economic
Mao (2009) cited six independent proxy indices to construct              recovery. Cai et al. (2021) analyzed the impact of the explosive
the investor sentiment composite index based on principal                pandemic on the labor market of China. The results showed that
component analysis.                                                      under the impact of the pandemic, overall employment assumed
   Individual investor sentiment is measured primarily based on          a “V”-shaped trend. Based on the monthly panel data of Chinese
big data analysis methods as data analysis and text mining. Baker        provinces and cities, Zhang and Zhu (2021) used DID model to
and Stein (2004) pointed out that liquidity measured by turnover         analyze the impact of the pandemic on various industries and
rate can be an indicator of investor sentiment. Das and Chen             concluded that the pandemic has a significant negative impact
(2008) proposed a method of gauging the sentiment of small               on international trade and the road freight industry.
investors from a web-based message board by comparing the                    External shocks tend to exert a significant impact on the
optimistic and pessimistic views. Balke et al. (2017) and Zhang          financial stock market (Baker et al., 2020; Zhao et al., 2021).
(2019) provided methods to measure sentiment based on surveys            Chen (2020) used the event analysis method to analyze the
and government policies. Yang et al. (2016) used big data mining         impact of the pandemic on the stock market of China, and the
to measure the investor sentiment index using big data mining            results showed that the return rate of the market at large had
from around 900,000 posts issued by listed companies on the              dropped significantly during the pandemic and impacted on
website of Eastmoney Securities. Fang et al. (2020) used the data        different types of firms to varying degrees. Wang et al. (2020)
from Baidu, the leading search engine in China, to construct an          used the panel VAR model and dynamic econometric model to
indicator of investor sentiment for forecasting of returns of the        evaluate the impact of the COVID-19 on stock price fluctuation
Chinese stock market.                                                    and concluded that fear and anxiety from the pandemic may
   The existing literature also investigates how investor                drive investors to sell stocks and to cause price fluctuation. Sun
sentiment exerts an impact on the stock market and what factors          et al. (2021) studied the impact of investor sentiment during the
drive investor sentiment (Delong et al., 1990; Fisher and Statman,       pandemic on pharmaceutical stock trading in mainland China,

Frontiers in Psychology | www.frontiersin.org                        2                                September 2021 | Volume 12 | Article 743306
Song et al. COVID-19 and Investor Sentiment
Hong Kong, South Korea, Japan, and the United States, and the TABLE 1 | The time series of confirmed cases with a cumulative number of over
results showed that ERAs had a significant positive effect on 1,000 in the provinces.
pharmaceutical investment portfolios in these markets. Province Number of confirmed Number of confirmed Time
The related investigations focus on investor sentiment mainly cases in province cases nationwide
from the perspective of investor attention metrics and the impact
of investor sentiment on the financial stock markets; major Hubei 7,153 11,791 2020/01
public health events are studied based on the impact on the Guangdong 1,349 79,824 2020/02
economy and the financial market. Few studies employ investor Henan 1,272 79,824 2020/02
sentiment as an explained variable to study the impact of the Zhejiang 1,205 79,824 2020/02
pandemic as an external shock on investor sentiment. Our study Hunan 1,018 81,554 2020/03
is intended to make three contributions to the existing literature.
First, we introduced the listed firms on the A-share stock market
of China as the research object and analyzed the impact of
the pandemic on investor sentiment at the firm level. Second, if postit = 0 and treatit = 1, the firm falls into the pre-pandemic
the authors introduced new research methods by considering treatment group; if postit = 1 and treatit = 0, the firm falls
the pandemic as a quasi-natural experiment and building a into the post-pandemic control group; and if postit = 0 and
DID model intended to assess the impact of the pandemic on treatit = 0, the firm falls into the pre-pandemic control group. In
investor sentiment. Meanwhile, the propensity score matching- this study, the core explanatory variable was postit × treat it , and
difference-in-difference (PSM-DID) method and the placebo- β 1 measures the impact of the pandemic on investor sentiment.
controlled test were used to conduct a series of robustness If β 1 0, the pandemic on its full-
being built to illustrate the impact of the pandemic on investor scale tends to increase the turnover rate. Besides, Xit is a series of
sentiment based on the firm type and industry differences. control variables, νi is the individual fixed effects, µt is the time
fixed effects, and εit is the random error term.
MODEL, VARIABLE SELECTION, AND
Variable Selection
DATA SOURCES sentiment, used in this study as an explained variable, refers
Model Building to theoretically inexplicable factors that drive investors make
In January 2020, the pandemic first broke out in Wuhan, China stock market forecasts based on macroeconomics and company
and then quickly spread to other cities. However, the Chinese data. It can be seen as a specific risk in connection with
government decisively adopted strict lockdown measures, which capital market development and reflects the market forecasts
resulted in effective control of the spread of the virus. To analyze and confidence of investors in their own investment strategy.
the impact of the pandemic on domestic investor sentiment, we The turnover rate is an indicator normally used in measuring
took the 2020 outbreak as the start time, regarded the pandemic investor sentiment on an individual stock and is calculated
as an external shock, and studied investor sentiment based on a generally as trading volume divided by total equity. However,
DID model. This model is widely used to evaluate the effects of a vast number of the stocks on the A-share stock market
policies in different pilot regions. Similar to the implementation are traded off the exchange. In this study, we improved the
of policies in different pilot regions, the outbreak of the COVID- approach to measuring investor sentiment on individual stocks.
19 pandemic in different regions can also be regarded as a We used turnover divided by free float as the proxy variable
quasi-natural experiment. for investor sentiment. We do not include (i) the free floats of
We considered those Chinese provinces with a cumulative shareholders who held more than 5% of the outstanding shares
number of confirmed infection cases notSong et al. COVID-19 and Investor Sentiment
TABLE 2 | The description and definitions of main variables.
Variable category Variable name Meaning Calculation method
Explained variable Sent Investor sentiment Trading volume/free float equity
Explanatory variables Post Time of the outbreak The time when the epidemic occurred, after the new
crown pneumonia epidemic event, it was 1, and before
it was 0
Treat Epidemic shock For the listed companies in the treatment group, the
value of Treat is 1, and the value of other
companies is 0
Control variable Size Enterprise size Ln(Enterprise total assets)
Indep Proportion of independent directors Total number of independent directors/total number of
board of directors
Lnage Business age Ln(Years of listing)
Top1 Shareholding ratio of the company’s largest The largest shareholder’s shareholding ratio
shareholder
Mvba Book value Enterprise market value/total assets
Epa Corporate Accounting Performance Corporate return on equity
Lev Corporate financial leverage Total liabilities/total assets
TABLE 3 | The descriptive analysis.
Variable N Mean SD Min Max
Sent 16,983 0.610 0.663 0.005 8.269
Indep 16,983 0.380 0.056 0.250 0.800
Epa 16,983 0.018 0.222 −9.179 1.978
Size 16983 22.260 1.273 18.13 29.710
Lev 16,983 0.410 0.194 0.008 0.978
Top1 16,983 0.316 0.140 0.030 0.882
Mvba 16,983 0.197 0.213 0.004 3.343
Lnage 16,983 2.916 0.296 0 4.111
Source: CSMAR database.
and the Chinese New Year fell on January 2020, this study on the A-share stock market and led to pessimistic investor
eliminated the possible impact of such factors on the A- sentiment. The second column, including control variables,
share stock market by excluding the data on January 2020. In shows significant results, which indicate that in those provinces
addition, considering the importance of accuracy and robustness hit harder by the pandemic, the listed firms are subject to a
of the research findings, we processed the initial samples by more negative shock on investor sentiment. This was due to
excluding real property developers, financial institutions, ST waning confidence and an overall pessimistic outlook on the
stocks, ∗ ST stocks, samples with data missing, and samples financial market.
traded forSong et al. COVID-19 and Investor Sentiment
sentiment between the treatment groups and the control groups. some degree thanks to government policy support and effective
In April 2020, the impact on investor sentiment rebounded to control measures.
Heterogeneity Analysis
TABLE 4 | Benchmark model regression results.
The impact of the pandemic on investor sentiment may vary with
the characteristics of the listed firms; therefore, the impact of
Variables (1) (2) the pandemic is analyzed from the perspective of the sector and
Sent Sent firm ownership.
The impact of the pandemic on investor sentiment also varies
Post × treat −0.0552*** −0.0262** across industries, i.e., the pharmaceutical or non-pharmaceutical
(0.014) (0.012) sector. This study divided the listed firms on the A-share
Indep 0.2613 stock market into the pharmaceutical sector and the non-
(0.164) pharmaceutical sector. As shown in Table 5, when it comes to
Epa 0.0199
the pharmaceutical sector, the outbreak of the pandemic had a
(0.018)
significantly positive impact on investor sentiment, but when it
Size −0.1112***
comes to the non-pharmaceutical sector, there was a significantly
(0.008)
negative impact. This result makes sense as the pandemic leads
Lev 0.3592***
(0.054)
to an upsurge in demand for medical supplies. The government
Top1 −0.1272*
invested more in the pharmaceutical sector, and the investors also
(0.066) expect the sector to be promising.
Mvba 0.9582*** This study classified the firms traded on the A-share stock
(0.038) market based on firm ownership. Firms involving a state-owned
Lnage −0.2402*** stake were categorized as a state-owned firm, firms involving
(0.030) a privately owned stake were categorized as a privately owned
Constant 0.4250*** 3.2275*** firm, and firms involving a foreign-owned stake were categorized
(0.015) (0.200) as a foreign-owned firm. In Table 6, columns 1–3 show the
Individual fixed effects Yes Yes regression results of the firms of different ownerships. For the
Time fixed effects Yes Yes privately owned and foreign-owned firms, investor sentiment has
Observations 16,983 16,983
a negative coefficient. In contrast, for the state-owned firms, the
Within_R2 0.1302 0.1686
investor sentiment coefficient was significantly positive at a 1%
Between_R2 0.0059 0.1911
level. For the foreign-owned firm, the negative impact of the
Overall_R2 0.0535 0.1552
pandemic on investor sentiment makes sense mainly because the
***, **, and * denote significance at 1, 5, and 10%, respectively. The SEs are in parentheses. pandemic is an international public health event. The pandemic
FIGURE 1 | Parallel trend test.
Frontiers in Psychology | www.frontiersin.org 5 September 2021 | Volume 12 | Article 743306Song et al. COVID-19 and Investor Sentiment
TABLE 5 | Regression results (the pharmaceutical sector vs. the TABLE 6 | Ownership regression results (state-owned firm vs. privately owned
non-pharmaceutical sector). firm vs. foreign-owned firm).
Variables (1) (2) Variables (1) (2) (3)
Pharmaceutical Non-pharmaceutical State- Privately Foreign-
industry industry owned owned firms owned
firm firm
Post × treat 0.1155*** −0.0351***
(0.043) (0.013) Post × treat 0.1137*** −0.0431*** −0.0370
Indep −0.3468 0.3007* (0.015) (0.016) (0.046)
Indep 0.1316 0.2105 0.0294
(0.543) (0.170)
(0.162) (0.241) (0.623)
Epa 0.0521 0.0166
Epa −0.0640 0.0188 0.0081
(0.059) (0.018)
(0.054) (0.025) (0.034)
Size −0.1198*** −0.1057***
Size −0.0543*** −0.1287*** −0.0861***
(0.029) (0.009)
(0.008) (0.014) (0.032)
Lev 0.3681** 0.3545***
Lev 0.3196*** 0.4374*** 0.1071
(0.174) (0.056)
(0.061) (0.075) (0.193)
Top1 −0.0379 −0.1416**
Top1 −0.2607*** −0.0322 −0.0540
(0.237) (0.068)
(0.070) (0.098) (0.214)
Mvba 0.2062** 1.1044***
Mvba 1.1059*** 1.0299*** 0.5097***
(0.087) (0.042)
(0.081) (0.050) (0.097)
Lnage −0.0479 −0.2308***
Lnage −0.0270 −0.1973*** −0.6222***
(0.107) (0.032)
(0.035) (0.043) (0.110)
Constant 3.0777*** 3.0568***
Constant 1.4236*** 3.4446*** 4.0787***
(0.726) (0.208)
(0.219) (0.325) (0.786)
Individual fixed effects Yes Yes
Individual fixed effects Yes Yes Yes
Time fixed effects Yes Yes Time fixed effects Yes Yes Yes
Observations 1,533 15,450 Observations 4,319 11,070 1,594
Within_R2 0.2099 0.1700 Within_R2 0.0690 0.1879 0.1069
Between_R2 0.0885 0.2116 Between_R2 0.2017 0.1231 0.2001
Overall_R2 0.1440 0.1702 Overall_R2 0.1413 0.1227 0.1328
***, **, and * denote significance at 1, 5, and 10%, respectively. The SEs are in parentheses. ***, **, and * denote significance at 1, 5, and 10%, respectively. The SEs are in parentheses.
began to sweep across China in early 2020 and from March 2020, and Technology, promote technological innovation, improve
transmitted on a large scale to other countries. The pandemic their own anti-risk capabilities, and increase investor confidence
worsened quickly and countries worldwide took emergency in them.
measures in response. Hence, the world economy faced a
recession, international demand shrank by a large margin, and
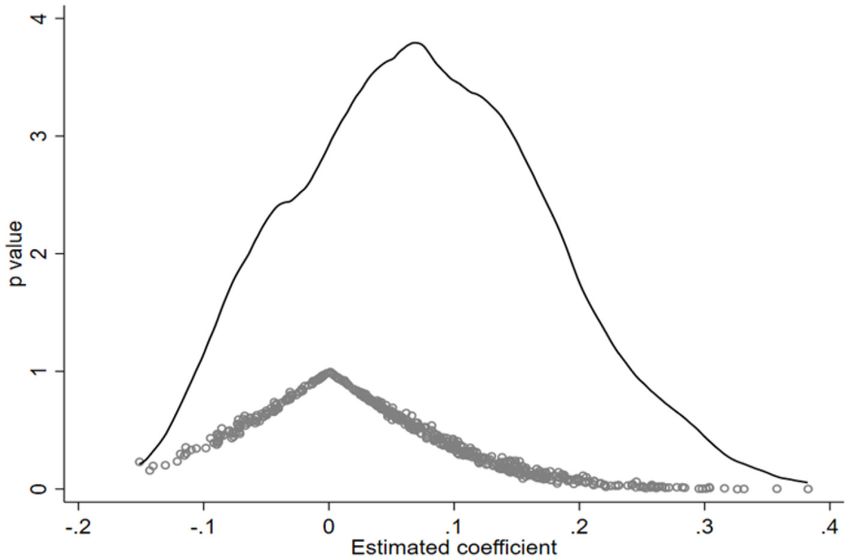
import and export markets of China suffered heavily. Therefore, Placebo-Controlled Test
the investors had a generally prudential, or pessimistic, attitude To test if investor sentiment is driven by other unobservable
to invest in these firms. Privately owned firms were generally factors, a certain number of groups were sampled on a
weak in risk resistance, so they were the most impacted. In random basis for the purpose of the robustness test. In this
quite a few provinces, the SMEs went broke under heavy impact. study, 500 random samplings were conducted and for each
Compared with the privately owned firm and the foreign-owned sampling, some of the provinces sampled served as the treatment
firm, the state-owned firm was less hit by the pandemic because groups and randomly sampled months between October 2019
of government backing as an advantage. When the panic about and April 2020 served as the time of the outbreak. Our
the pandemic enshrouded the whole market, the market investors analysis gives the estimated coefficient of investor sentiment
chose to buy in more stocks of the state-owned firm, hence its as a dependent variable. Based on the basic regression of
high turnover rate. The investors were, in themselves, optimistic statistics as shown in Table 4, the estimated coefficient with
about the state-owned firm. Therefore, the ability of the privately investor sentiment as the dependent variable was −0.0552,
owned firm and the foreign-owned firm to adapt to external obviously different from the coefficient returned by the
shocks should be improved. When a major crisis breaks out, placebo-controlled test as shown in Figure 2. Therefore, the
the government should increase its support for such enterprises. existence of other unobservable factors on investor sentiment
The enterprises themselves should increase investment in Science was insignificant.
Frontiers in Psychology | www.frontiersin.org 6 September 2021 | Volume 12 | Article 743306Song et al. COVID-19 and Investor Sentiment FIGURE 2 | Placebo-controlled test. FIGURE 3 | Overlapping assumption test. PSM-DID Test i.e., the overlapping assumption was fulfilled. Also, addressing This study conducted a PSM analysis of investor sentiment to selection bias with PSM has to fulfill the balance assumption, reduce the selection bias associated with sampling. The various i.e., except for investor sentiment, there should be no significant matching variables, i.e., lnage, size, the debt-to-asset ratio, and difference between the treatment groups and the control groups. mvba, were used as a basis for PSM to select appropriate control It is generally supposed that a post-matching SD
Song et al. COVID-19 and Investor Sentiment
TABLE 7 | Balancing assumption test.
Covariate Unmatched U/matched M Treatment group mean Control group mean %bias t value p value
Lnage U 2.9098 2.9203 −3.5 −2.29 0.022
M 2.9098 2.9085 0.4 0.26 0.795
Size U 22.203 22.293 −7.1 −4.59 0.000
M 22.203 22.177 1.9 1.17 0.241
Lev U 0.41154 0.40863 1.5 0.97 0.332
M 0.41154 0.4084 1.6 0.98 0.327
Mvba U 0.20247 0.1922 4.8 3.10 0.002
M 0.20247 0.19979 1.3 0.75 0.455
TABLE 8 | Propensity score matching test (nearest neighbor matching vs. radius matching vs. kernel matching).
Variables (1) (2) (3) (4) (5) (6)
Nearest Nearest Radius Radius Kernel Kernel
neighbor neighbor matching matching matching matching
matching matching
Post × treat −0.0556*** −0.0268** −0.0556*** −0.0270** −0.0552*** −0.0262**
(0.014) (0.012) (0.014) (0.012) (0.014) (0.012)
Indep 0.2513 0.2591 0.2613
(0.164) (0.164) (0.164)
Epa 0.0211 0.0566** 0.0199
(0.018) (0.024) (0.018)
Size −0.1123*** −0.1118*** −0.1112***
(0.008) (0.008) (0.008)
Lev 0.3700*** 0.3666*** 0.3592***
(0.054) (0.054) (0.054)
Top1 −0.1330** −0.1295** −0.1272*
(0.066) (0.066) (0.066)
Mvba 0.9709*** 0.9605*** 0.9582***
(0.038) (0.038) (0.038)
Lnage −0.2408*** −0.2401*** −0.2402***
(0.030) (0.030) (0.030)
Constant 0.4250*** 3.2526*** 0.4251*** 3.2386*** 0.4250*** 3.2275***
(0.015) (0.202) (0.015) (0.200) (0.015) (0.200)
Individual fixed effects Yes Yes Yes Yes Yes Yes
Time fixed effects Yes Yes Yes Yes Yes Yes
Observations 16,970 16,970 16,977 16,977 16,983 16,983
Within_R2 0.1302 0.1690 0.1303 0.1690 0.1302 0.1686
Between_R2 0.0057 0.1910 0.0059 0.1913 0.0059 0.1911
Overall_R2 0.0534 0.1556 0.0535 0.1557 0.0535 0.1552
***, **, and * denote significance at 1, 5, and 10%, respectively. The SEs are in parentheses.
were implemented. Table 8 shows the relative regression results, research on the performance of the A-share stock market
which shows that the coefficient of the variable post × treat of China during the pandemic by doing a quasi-experiment
remained significantly at a 1% level. based on the pandemic. Besides, the DID model was used to
investigate the impact of the arrived at three conclusions. First,
the pandemic drove down the turnover rate on the A-stock
CONCLUSION market and made the investors pessimistic, so those currently
without holdings did not involve themselves in market trading.
To evaluate how and to what extent the COVID-19 pandemic Second, the pandemic impacted negatively on investor sentiment
exerts an impact on investor sentiment, this study conducted and brought it down significantly when it comes to the privately
Frontiers in Psychology | www.frontiersin.org 8 September 2021 | Volume 12 | Article 743306Song et al. COVID-19 and Investor Sentiment
owned firms and the foreign-owned firms; in contrast, the state- on investor sentiment, the pandemic was inversely correlated
owned firms attracted many individual investors on the strength with the pharmaceutical industry and the state-owned firms,
of their unique advantages. Third, the outbreak of the pandemic i.e., investigation of investor sentiment at the firm level could
drew broad attention to the pharmaceutical industry from the be important. Stringent pandemic control measures should be
government and people, so it boosted up investor sentiment in combined with other measures in favor of effective optimistic
the pharmaceutical industry while having a significantly negative investor sentiment.
impact on the non-pharmaceutical industry.
In general, considering the pandemic as an external shock DATA AVAILABILITY STATEMENT
that exerts a substantial impact on investor sentiment, the
Chinese government and the competent regulatory agencies The original contributions presented in the study are included
should implement regulations and establish an early risk warning in the article/supplementary material, further inquiries can be
system. Education and protection should be provided for directed to the corresponding author/s.
individual investors to maintain financial security and stability.
Based on the aforesaid research findings, this study proposed
the following three policy recommendations. First, an early AUTHOR CONTRIBUTIONS
risk warning mechanism and a set of emergency measures
should be introduced to the A-share stock market, so in the YS: conceptualization, methodology, formal analysis,
event of the outbreak of major incidents, i.e., the COVID- writing—original draft preparation, and funding acquisition.
19 pandemic, market risk associated with investor sentiment XH: data processing, formal analysis, and writing—original
fluctuations can be precluded; besides, appropriate regulatory draft preparation. ZL: methodology, project management, and
intervention should be made to limit irrational A-share stock funding acquisition. All authors contributed to the article and
market trading and make the stock market stabler. Second, approved the submitted version.
the competent regulatory agency should educate the investors
pertinently, improve their expectations, and guide them to FUNDING
respond reasonably to the external shock of the market. Investor
sentiment is an important factor that causes financial stock This study obtained the financial support of the National Social
market volatility under the pandemic. Therefore, psychological Science Foundation (the impact of heterogeneity of regional
monitoring or emotional management intervention during a trade in service agreements on the reconstruction of the global
pandemic outbreak helps people not only to identify mental value chain of the manufacturing industry in China; Project No:
health problems but also to control their emotions and 20BJY091) and the innovation team project of Philosophy and
avoid unreasonable investment behaviors. Third, the impact Social Sciences in Colleges and Universities of Henan Province
of the pandemic on investor sentiment should be looked at (coordinated development of urban and rural areas and rural
reasonably. In general, although there was a negative impact revitalization; Project No: 2021-CXTD-04).
REFERENCES Cai, F., Zhang, D. D., and Liu, Y. X. (2021). The impact of COVID-19 on
the chinese labor market—a comprehensive analysis based on the individual
Baker, M., and Stein, J. C. (2004). Market liquidity as a sentiment indicator. J. tracking survey. Econ. Res. J. 56, 4–21.
Financial Mark. 7, 271–299. doi: 10.1016/j.finmar.2003.11.005 Chen, F. G. (2020). The heterogeneous impact of COVID-
Baker, M. P., and Wurgler, J. (2006). Investor sentiment and the cross-section of 19 on Chinese enterprises—empirical research based on the
stock returns. J. Finance 61, 1645–1680. doi: 10.1111/j.1540-6261.2006.00885.x perspective of stock price fluctuations. Ind. Technol. Econ. 39,
Baker, S. R., Bloom, N., Davis, S. J., Kost, K. J., Sammon, M. C., and Viratyosin, T. 3–14. doi: 10.3969/j.issn.1004-910X.2020.10.001
(2020). The unprecedented stock market impact of COVID-19. Rev. Asset Pric. Das, S. R., and Chen, M. Y. (2008). Yahoo! For Amazon: Sentiment extraction from
Stud. 10, 742–758. doi: 10.1093/rapstu/raaa008 small talk on the web. Oper. Res. 48, 601–602. doi: 10.1287/mnsc.1070.0704
Balke, N. S., Fulmer, M., and Zhang, R. (2017). Incorporating the beige book Delong, J. B., Shleifer, A., Summers, L. H., and Robert, J. W. (1990). Noise trader
into a quantitative index of economic activity. J. Forecast. 36, 497–514. risk in financial markets. J. Polit. Econ. 98, 703-738. doi: 10.1086/261703
doi: 10.1002/for.2450 Fang, G., Gozgor, G., Lau, C., and Lu, Z. (2020). The impact of Baidu index
Barro, R. J., Ursúa, J. F., and Weng, J. (2020). The coronavirus and the great sentiment on the volatility of China’s stock markets. Finance Res. Lett.
influenza pandemic: lessons from the“Spanish Flu” for the Coronavirus’s 32:101099. doi: 10.1016/j.frl.2019.01.011
potential effects on mortality and economic activity. NBER Working Paper, No. Fisher, K. L., and Statman, M. (2000). Investor sentiment and stock returns.
26866. doi: 10.3386/w26866 Financial Anal. J. 56, 16–23. doi: 10.2469/faj.v56.n2.2340
Brainerd, E., and Sieglar, M. V. (2003). The economic effects of the 1918 influenza Gozgor, G., Lau, C. K. M., Sheng, X., and Yarovaya, L. (2019). The role
epidemic CEPR Discussion Paper, No. 3791. of uncertainty measures on the returns of gold. Econ. Lett. 185:108680.
Brem, A., Viardot, E., and Nylund, P. A. (2021). Implications of the doi: 10.1016/j.econlet.2019.108680
coronavirus (COVID-19) outbreak for innovation: which technologies Hanna, D., and Huang, Y. (2006). The impact of SARS on asian economies. Asian
will improve our lives? Technol. Forecast. Soc. Change 163:120451. Econ. Pap. 3, 102–112. doi: 10.1162/1535351041747978
doi: 10.1016/j.techfore.2020.120451 Jiang, B., Zhu, H., Zhang, J. H., Yan, C., and Shen, R. (2021). Investor sentiment
Brown, G. W., and Cliff, M. T. (2005). Investor sentiment and asset valuation. J. and stock returns during the COVID-19 pandemic. Front. Psychol. 12:708537.
Bus. 78, 405–440. doi: 10.1086/427633 doi: 10.3389/fpsyg.2021.708537
Frontiers in Psychology | www.frontiersin.org 9 September 2021 | Volume 12 | Article 743306Song et al. COVID-19 and Investor Sentiment
Kenneth, L., and Meir, S. (2000). Investor sentiment and stock returns. Financ. Yi, Z. G., and Mao, N. (2009). Research on the measurement of investor sentiment
Anal. J. 56, 16–23. in Chinese Stock market: the CICSI’s construction. J. Financ. Res. 11, 174–184.
Larrain, B., and Urzúa, F. (2013). Controlling shareholders and market timing in Yu, C., Zhang, R., An, L., and Yu, Z. X. (2020). Has China’s belt and road initiative
share issuance. J. Financ. Econ. 109, 661–681. doi: 10.1016/j.jfineco.2013.03.013 intensified bilateral trade links between China and the involved countries?
Li, Z. W., Kang, C. Y., and Mao, X. X. (2017). The impact of external Sustainability 17, 1–19. doi: 10.3390/su12176747
shocks on chinese investors’ sentiment. J. Dalian Univ. Technol. 38, 71–76. Zhang, B. O., Hu, W. X., and Yang, X. A. (2021). Research on the formatting
doi: 10.19525/j.issn1008-407x.2017.02.012 mechanism of investor sentiment. Chin. J. Manag. Sci. 29, 185–195.
Shang, Y., Li, H., and Zhang, R. (2021). Effects of pandemic outbreak on doi: 10.16381/j.cnki.issn1003-207x.2021.01.018
economies: evidence from business history context. Front. Public Health Zhang, J. P., and Zhu, Y. X. (2021). The impact of COVID-19 epidemic
9:632043. doi: 10.3389/fpubh.2021.632043 on China’s service economy in post epidemic era—a study based on
Sun, Y., Bao, Q., and Lu, Z. (2021). Coronavirus (Covid-19) outbreak, a multi period double difference model. Ind. Technol. Econ. 40, 58–67.
investor sentiment, and medical portfolio: evidence from China, Hong doi: 10.3969/j.issn.1004-910X.2021.04.007
Kong, Korea, Japan, and U.S. Pacific. Basin Finance J. 65:101463. Zhang, R. (2019). News shocks and the effects of monetary policy. Macroecon. Dyn.
doi: 10.1016/j.pacfin.2020.101463 10, 1–41. doi: 10.2139/ssrn.3348466
Tian, X., Kou, G., and Zhang, W. (2020). Geographic distance, venture capital Zhao, Y. N., Ozdemir, Zhang, R., and An, L. (2021). Outward foreign direct
and technological performance: evidence from Chinese enterprises. Technol. investment of China’s banking sector: determinants and motivations. Available
Forecast. Social Change 158, 120–155. doi: 10.1016/j.techfore.2020.120155 online at: SSRN 3780899. doi: 10.2139/ssrn.3780899
Wang, Q., Wang, Z. L., Li, S. X., and Xue, F. Z. (2020). The immediate impact
of COVID-19 on China’s stock price fluctuation. Rev. Econ. Manag. 6, 16–27. Conflict of Interest: The authors declare that the research was conducted in the
doi: 10.13962/j.cnki.37-1486/f.2020.06.002 absence of any commercial or financial relationships that could be construed as a
Wang, Y. F., and Wang, Y. M. (2014). The role of investor potential conflict of interest.
sentiment in asset pricing[J]. Manage. Rev. 26, 42–55.
doi: 10.14120/j.cnki.cn11-5057/f.2014.06.039 Publisher’s Note: All claims expressed in this article are solely those of the authors
Wu, Q. F. (2003). Empirical study on impact of SARS epidemic on the equity funds and do not necessarily represent those of their affiliated organizations, or those of
in China. Manag. Rev. 15, 8–11.
the publisher, the editors and the reviewers. Any product that may be evaluated in
Wu, W., Tiwari, A. K., Gozgor, G., and Leping, H. (2021). Does economic
this article, or claim that may be made by its manufacturer, is not guaranteed or
policy uncertainty affect cryptocurrency markets? Evidence from
twitter-based uncertainty measures. Res. Int. Bus. Finance 58:101478. endorsed by the publisher.
doi: 10.1016/j.ribaf.2021.101478
Xie, S. Q., and Tang, S. S. (2021). The impact of investor sentiment and macro Copyright © 2021 Song, Hao and Lu. This is an open-access article distributed
economy fluctuations on stock market returns. Macroeconomics 2, 99–109. under the terms of the Creative Commons Attribution License (CC BY). The use,
doi: 10.16304/j.cnki.11-3952/f.2021.02.00 distribution or reproduction in other forums is permitted, provided the original
Yang, X. L., Shen, H. B., and Zhu, Y. (2016). The effect of local bias in investor author(s) and the copyright owner(s) are credited and that the original publication
attention and investor sentiment on stock markets: evidence from online in this journal is cited, in accordance with accepted academic practice. No use,
forum. J. Financ. Res. 438, 143–158. distribution or reproduction is permitted which does not comply with these terms.
Frontiers in Psychology | www.frontiersin.org 10 September 2021 | Volume 12 | Article 743306You can also read