Prior selection prevents the loss of an ecosystem cycle during acidification - bioRxiv
←
→
Page content transcription
If your browser does not render page correctly, please read the page content below
bioRxiv preprint doi: https://doi.org/10.1101/2020.01.27.921437. The copyright holder for this preprint (which was not peer-reviewed) is the
                              author/funder. It is made available under a CC-BY-NC-ND 4.0 International license.

                  Prior selection prevents the loss of an ecosystem cycle
                                                   during acidification

           Sofia J. van Moorsel1,2, Justin N. Marleau1, Jorge O. Negrín Dastis1, Charles Bazerghi1,
                           Vincent Fugère1,3, Owen L. Petchey2,4 and Andrew Gonzalez1

     1
         Department of Biology, Quebec Centre for Biodiversity Science, McGill University,
     Montreal, QC, Canada
     2
         URPP Global Change and Biodiversity, University of Zurich, Switzerland
     3
         Department of Biology, Université de Quebec à Montreal (UQAM), Montreal, QC, Canada
     4
         Department of Evolutionary Biology and Environmental Sciences, University of Zurich,
     Switzerland

     E-mail addresses for correspondence:
     sofia.vanmoorsel@mail.mcgill.ca
     andrew.gonzalez@mgcill.ca

                                                                                                                                     1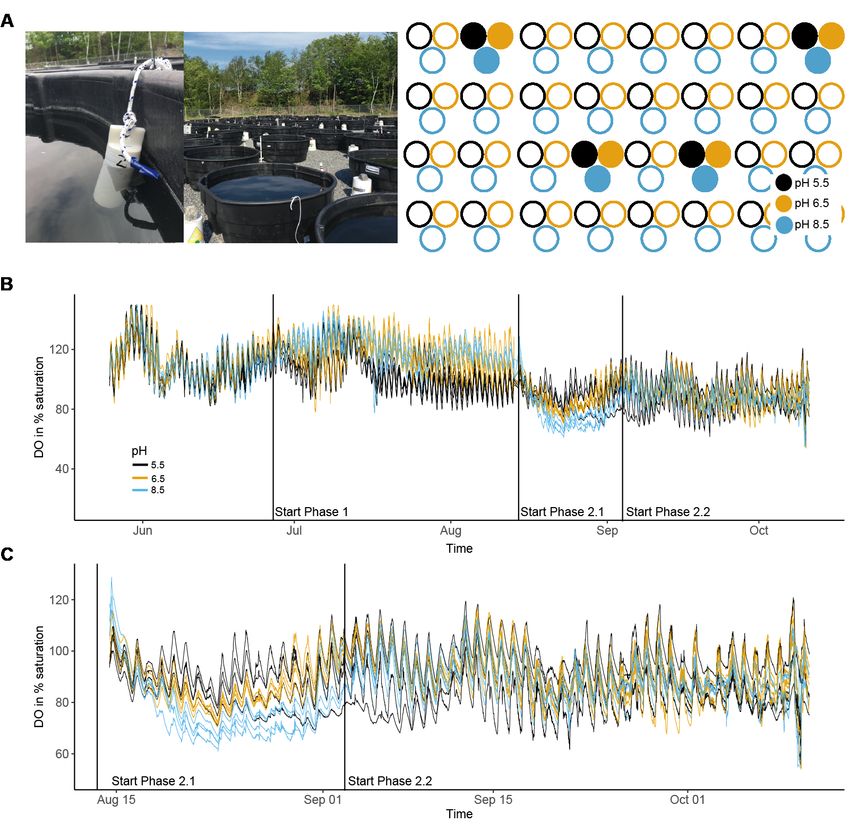
bioRxiv preprint doi: https://doi.org/10.1101/2020.01.27.921437. The copyright holder for this preprint (which was not peer-reviewed) is the
                              author/funder. It is made available under a CC-BY-NC-ND 4.0 International license.

                                                                Abstract
     Ecosystem processes vary temporally due to variation in environmental variables, such as
     when diurnal variation in sunlight causes diurnal cycles in net primary production. This
     variability can be characterized by its frequency and amplitude, used to define “normal”
     functioning of an ecosystem. Relatively little research has addressed how normal modes of
     variability, such as diurnal cycles, are lost or recovered, following anthropogenic stress. We
     conducted an aquatic mesocosm experiment to test whether prior application of
     environmental stress, in the form of moderate acidification, affected the diurnal cycle of
     dissolved oxygen when exposed to severe acidification. High-frequency data from sensor
     loggers deployed in 12 mesocosms showed that severe acidification caused a temporary loss
     of diurnal variation in dissolved oxygen concentration. However, pre-exposure to an acidic
     environment resulted in the persistence of the diurnal cycle. We hypothesize that pre-
     exposure shifted the community to acid tolerant genotypes and/or species of algae and other
     photosynthetic organisms. Our findings suggest that the stability of ecosystem cycles is
     intrinsically liked to the stress tolerance of the species assemblage.

                                                                                                                                     2
bioRxiv preprint doi: https://doi.org/10.1101/2020.01.27.921437. The copyright holder for this preprint (which was not peer-reviewed) is the
author/funder. It is made available under a CC-BY-NC-ND 4.0 International license.
INTRODUCTION
Anthropogenic sources of environmental stress such as acidification affect the
structure and function of ecosystems by impacting their geochemistry and species
composition. Stressors can drive the loss of intolerant species and depending on the degree of
compositional turnover, incur a suite of different destabilizing effects such as a loss of
diversity (Geelen and Leuven 1986, Niyogi et al. 2003) and/or keystone species (Cuenca
Cambronero et al. 2018) and a synchronization of its constituent populations (Thompson et al.
2015). A community that has experienced a stressor may differ in structure, function, and
stability (e.g. variability stability, or resistance) to those that have not experienced the stress
(Ives and Cardinale 2004, Keitt 2008).
Ecosystem processes are known to vary over a range of time scales. Some scales of
variability arise from periodic responses to natural cycles in the environment, while others are
scales reflect the aggregate response of the community to stochastic variation in the
environment (Blasius et al. 1999, Gilg 2003, Keitt 2008). Because scale-specific responses to
the environment occur at different periods and amplitudes, it is necessary to assess ecosystem
stability at different time scales (Downing et al. 2008). Cyclical responses to natural
environmental changes depend on the time scale in focus, from daily (night/day), seasonal
(length of day) and annual (length of growing season) fluctuations. For example, freshwater
ecosystems are characterized by strong daily fluctuations in oxygen production (Schindler et
al. 2017). During the day, when light is present, algal production of oxygen via
photosynthesis can be greater than all organismal consumption of oxygen via respiration,
leading to increase in dissolved oxygen concentration. In contrast, at night, in the absence of
photosynthesis, organismal respiration decreases dissolved oxygen. The higher the primary
productivity, the stronger these diurnal cycles (Schindler et al. 2017).
The growth of stress tolerant species can recover ecosystem processes from a certain
degree of stress (Rapport et al. 1985). However, at doses initially lethal for all species only
rapid evolution can allow the recovery of an exposed community (unless the system is open to
immigration of resistant genotypes). Previous work has shown that exposure to nonlethal
stress can pre-adapt populations to a subsequent exposure to otherwise lethal press
perturbation allowing resident species and genotypes to adjust their physiology and
demographic rates (Bell and Gonzalez 2009, 2011, Low-Décarie et al. 2015, Fugère et al.
2020). Exposure to a stressor may thus reduce the effects of subsequent exposure to the same
stressor (Bell and Gonzalez 2009, 2011, Low-Décarie et al. 2015, Fugère et al. 2020) due to
selection for tolerant/resistant genotypes within the populations comprising the community.
3bioRxiv preprint doi: https://doi.org/10.1101/2020.01.27.921437. The copyright holder for this preprint (which was not peer-reviewed) is the
author/funder. It is made available under a CC-BY-NC-ND 4.0 International license.
The diurnal cycle of DO is a metric for ecosystem functioning (Venkiteswaran et al.
2008, Demars et al. 2015, Schindler et al. 2017) capturing the activity of aquatic species
across trophic levels from decomposers to zooplankton (Cowan et al. 1996). We therefore
tested the hypothesis that a pre-selective environment could enable communities to maintain
their diurnal DO cycle when subsequently exposed to a lethal level of stress, i.e. maintain a
‘normal’ (as measured in controls) frequency and magnitude of diurnal variability of the DO
cycle during the press acidification treatment. We take a "black-box" approach with this
whole-ecosystem approach, which comes at the expense of specific mechanisms. We used a
high-resolution DO time series from a 5-month long experiment in mesocosms containing
1000 liters of lake water and natural plankton communities. We carried out a multi-phase
experiment using acidification as the stressor. In phase 1, we imposed selective environments
by manipulating pre-exposure to sublethal stress (with weekly addition of sulfuric acid to the
ponds). Then, in phase 2, all ponds were exposed to a one-time lethal dose of sulfuric acid
resulting in pH 3 continuously for several weeks.
METHODS
Field site and design
This mesocosm study was conducted within the Large Experimental Array of Ponds
(LEAP) platform at the Gault Nature Reserve in Mont-St-Hilaire, QC, Canada (45°32' N,
73°08' W, 122 m a.s.l.). The experiment was run between May and October 2018 for a total of
147 days. On 24 May 2018, 105 mesocosms (1100L stock tanks, Rubbermaid, Huntersville,
NC, USA), henceforth referred to as ponds, were filled with approximately 1000 liters of
unfiltered lake water from nearby oligotrophic Lac Hertel, located 1 km upstream of the
experimental facility. Lac Hertel is situated within a UNESCO biosphere reserve and has a
fully forested and protected watershed, free of agricultural run-off and other pollution. The
lake has no recorded history of acidification. One day after the ponds were filled, all ponds
received 50 ml of a nutrient solution containing nitrogen and phosphorus (86.128 g/l KNO3,
1.78 g/l KH2PO4, 2.24 g/l K2HPO4, which resulted in the total addition of 596.45 g of N and
39.8 g of P) to increase nutrient levels and stimulate primary production.
As a measure of ecosystem functioning, we used dissolved oxygen (DO). DO is both
determined by biological factors (e.g. community biomass and composition) and by
environmental factors such as water temperature (Belley et al. 2016), as the solubility of
oxygen decreases as temperature increases (Wetzel 2001). We tracked DO dynamics in
twelve ponds using sensor loggers (MiniDOTs, PME, Vista, California, USA) attached to the
4bioRxiv preprint doi: https://doi.org/10.1101/2020.01.27.921437. The copyright holder for this preprint (which was not peer-reviewed) is the
author/funder. It is made available under a CC-BY-NC-ND 4.0 International license.
side of the ponds with rope and positioned into the water column at a depth of approximately
20 cm. We focus our analysis on this subset of 12 mesocosms that generated high frequency
time series of DO. Water temperature (°C) and dissolved oxygen (in mg/l) was measured
every 20 minutes. Ponds were covered with 1 mm netting (vegetable garden netting) to
prevent insects, foliage, and debris from entry. Periphyton growth on the side of the ponds or
on the loggers was minimal. Four loggers were in mesocosms at pH 5.5, four at pH 6.5 and
four at pH 8.5 (see Fig. 1). We present dissolved oxygen corrected for temperature as %
saturation in Fig 1 and all subsequent analyses (described below) focused on temperature-
corrected values (% saturation). Outlier values > 4 standard deviations away from the mean
DO across all data points (98 %) were attributed to temporary probe disturbance or
malfunction and were thus excluded from analyses of DO across time and mean DO per
phase. These values (DO saturation < 40 % or > 150%) represented 0.4 % of all data points.
Due to the robustness of the wavelet analysis, no data points were excluded from those
analyses. We assumed that all ponds had a similar wind exposure and gas exchange
coefficient, and thus did not correct oxygen data for gas exchange with the atmosphere.
Acidification treatment
During the four weeks of phase 0 from 24 May to 26 June ecosystems were at their
natural pH (phase 0, mean pH = 9.03± 0.17 on June 7, 8.27± 0.15 on June 12 and 8.81± 0.26
on June 26, Fig. S2). We acidified the pond to induce selection on community composition.
Acidification is harmful for freshwater systems causing population declines for higher trophic
levels (e.g. fish and zooplankton ) and shifts towards a simplification of community
composition for lower trophic levels, such as phytoplankton (Locke and Sprules 1994,
Schindler et al. 1996, Weiss et al. 2018). On day 34 of the experiment (26 June 2018), we
acidified the ponds to start our selection treatment (phase 1). Using sulfuric acid, four ponds
were acidified to pH 5.5 and four ponds were acidified to pH 6.5. The remaining four ponds
were left as they were at pH 8.5. Sulfuric acid was gradually added to the ponds using a
pipette and stirred. pH was measured using a multiparameter sonde (YSI, Yellow Springs,
OH, USA). Weekly acidification maintained the pH around the target pH-value. Initially
strong buffering capacity resulted in weekly increases of the pH, but we succeeded in
establishing three distinct pH levels during phase 1 (Figure S2).
On day 83 of the experiment (14 August 2018), we started phase 2 of the experiment.
All ponds were acidified using sulfuric acid to pH 3, except pond A4 which was accidentally
acidified to pH 2.5 because the pH sensor malfunctioned (see Figure S2). On August 16, we
5bioRxiv preprint doi: https://doi.org/10.1101/2020.01.27.921437. The copyright holder for this preprint (which was not peer-reviewed) is the
author/funder. It is made available under a CC-BY-NC-ND 4.0 International license.
acidified again to ensure that all ponds were +/- 0.1 from pH 3; pH remained stable thereafter
until the end of the experiment. The pH in Pond A4 never recovered and remained at pH 2.5
so we conducted our analyses with and without this pond for comparison (Figure S2).
Figure 1. (A) Photographs of the field site and spatial arrangement of the experimental
ponds. Filled circles indicate the ponds in which the miniDOT sensor loggers were
deployed. (B) Dissolved oxygen in % saturation over time according to pH treatment
during phase 1. (C) Close up of phase 2 for DO in % saturation. The start of phase 1 and
2 are indicated with a dashed vertical line. Black lines, pH 5.5, orange lines, pH 6.5 and
blue lines, pH 8.5.
6bioRxiv preprint doi: https://doi.org/10.1101/2020.01.27.921437. The copyright holder for this preprint (which was not peer-reviewed) is the
author/funder. It is made available under a CC-BY-NC-ND 4.0 International license.
Wavelet analysis
Under normal conditions the ponds exhibit a daily cycle in DO due to daily cycles in
the amount of photosynthesis occurring, hence we were interested in identifying if this daily
cycle persisted throughout the acidification treatments across the phases of the experiment.
We were also interested in whether the degree of persistence and cycle amplitude depended
on the acid pre-exposure treatment. To detect change in the daily period and its amplitude
over time we used two continuous wavelet transform algorithms (Grinsted et al. 2004) in
Matlab (v2018a) that allowed us to both detect oscillations at multiple frequencies as well as
locate their occurrence in time. For our main results, we used the Morlet wavelet (Fig. 2;
Grinsted et al. 2004) and the Morse wavelet (Fig. 3; Lilly and Olhede 2012), which lead to
similar scalograms, but different normalization schemes, indicating robust results (see
Supplementary Information for more details). To identify whether peaks in variability at
particular frequencies were statistically significant we used autocorrelated noise as the null
variation (Grinsted et al. 2004). With the Morse wavelet transform algorithm, we could
extract the amplitude of the daily oscillations for each pond over each phase of the experiment
by taking the modulus (or absolute value) of the complex coefficients of the wavelet
transform. The period was 1.02 days (closest possible to 24 hours) because of the way the
algorithm partitions the periods.
Statistical analysis
We tested the hypothesis that the daily DO cycle would change with pH pre-exposure
treatment over the phases of the experiment. Our expectation was that the daily DO cycles
would be stronger in ponds that had been pre-exposed to lower pH values 5.5>6.5>8.5 during
phase 1. The time series was split into four phases and analyzed separately for each phase:
phase 0 refers to the time period when no stressor was applied, phase 1 to the time period
when the stressor was applied to a subset of the ponds at sub-lethal levels. The initial response
of an ecosystem to a pulse perturbation can strongly differ from its long-term response
(Arnoldi et al. 2018). Therefore, we separated phase 2 into two sub-phases: phase 2.1 refers to
the first approximately three weeks immediately after acidification to pH 3 (August 14 to Sept
3) and phase 2.2, which refers to the rest of the field season from Sept 4 to Oct 15.
Effects of treatments on the extracted amplitudes (modulus) from the wavelet
transform at a period of 1.02 days were analyzed using mixed-effects models with pH during
phase 1 as a fixed-effect term (pH 5.5 vs. pH 6.5 vs. pH 8.5) and pond (n=12) as random-
effect term. Mixed models using residual maximum likelihood (REML) were fitted using the
7bioRxiv preprint doi: https://doi.org/10.1101/2020.01.27.921437. The copyright holder for this preprint (which was not peer-reviewed) is the
author/funder. It is made available under a CC-BY-NC-ND 4.0 International license.
package nlme for R (Pinheiro et al. 2019). All statistical analyses were conducted using the
software R version 3.6.1 (R Development Core Team 2019).
Figure 2. Magnitude scalograms for all ponds with Morlet wavelet. Left row, ponds at pH
5.5, middle row, ponds at pH 6.5 and right row, ponds at pH 8.5 during phase 1. Dashed lines
indicate the start of phase 1 (day 34), the start of phase 2.2 (day 83) and the start of phase 2.2
(day 103). Yellow colors show high energies (“high variation”) and blue colors show low
energies (“low variation”). Significant variances are circled in black. The time scale increases
vertically. The cone depicts the significant area, values outside are based on too little data. See
Fig. S5 for visualization of the 1-day period.
8bioRxiv preprint doi: https://doi.org/10.1101/2020.01.27.921437. The copyright holder for this preprint (which was not peer-reviewed) is the
author/funder. It is made available under a CC-BY-NC-ND 4.0 International license.
RESULTS
DO in % saturation was on average 105 % for the pH treatment 5.5 during phase 1,
whereas the DO in pH treatment 6.5 was on average 117 % and thus comparable to the
control treatment (pH 8.5) at 118 % saturation (Fig. 1, Table S2, Fig. S4). Upon acidification
to pH 3, however, DO values were significantly higher for the two pH treatments that
experienced a lower pH during phase 1 for both DO in % saturation and DO in mg/l (phase
2.1, P = 0.032 and P = 0.025, respectively, Table S2, Fig. S4).
Irrespective of the pH treatment during the pre-selective phase (phase 1), all ponds
demonstrated significant daily cycles in DO (yellow band surrounded by black lines at period
of 1 day, Fig. 2). Following acidification to pH 3, those ponds pre-exposed to pH 6.5 (a very
mild acidic environment), or not pre-exposed to acid at all, lost their daily DO cycle for
approximately two weeks (Fig. 2). In contrast, after exposure to pH 3, three out of the four
ponds previously exposed to pH 5.5 during phase 1 maintained their daily DO cycle. The
exception was pond “A4”, which was accidentally acidified to pH 2.5 and therefore lost its
daily cycle, thus showing response more comparable with that of ponds either pre-exposed to
pH 6 or not pre-exposed to an acidic environment at all. Ponds pre-exposed to pH 5.5 showed
greater variation over the 24 hours after acidification to pH 3 (phase 2.1, Fig. 3B), however
the effect was only significant when the outlier pond A4 was excluded (Fig. 3C, Table S1).
At the end of the experiment (phase 2.2 in Fig. 1) we observed the recovery of the
daily DO cycle in all twelve ponds.
DISCUSSION
DO is one of the most important indicators of the functioning of aquatic systems
(Rajwa-Kuligiewicz et al. 2015). The amount of dissolved oxygen in the water, and in
particular, the diurnal cycle of DO are measures of ecosystem metabolism and ecosystem
health (Venkiteswaran et al. 2008, Demars et al. 2015, Schindler et al. 2017). We found that
ponds which were pre-adapted to pH 5.5 maintained their natural DO cycle throughout the
acidification, whereas ponds held at 6.5 and 8.5 did not. One might even say that the diurnal
cycle of dissolved oxygen is the “heart-beat” of aquatic ecosystems. The observed crash of
diurnal variability in the mesocosms held at pH 6.5 during phase 1 is thus indicative of the
effect of the stress on the maintenance of ecosystem functioning. Acidification can have
negative consequences for aquatic life, either via direct physiological impacts on organisms
9bioRxiv preprint doi: https://doi.org/10.1101/2020.01.27.921437. The copyright holder for this preprint (which was not peer-reviewed) is the
author/funder. It is made available under a CC-BY-NC-ND 4.0 International license.
(Schindler 1985), selection driven mortality, and via changes in species abundances, and
community diversity and composition (Geelen and Leuven 1986, Locke and Sprules 1994).
Despite being exposed to severe stress, we observed a recovery of the DO cycle, at the
end of the experiment (phase 2.2 in Fig. 1), although the amplitudes and pattern of
fluctuations differed among ponds. Because the DO cycle is mainly driven by phytoplankton
(Smith and Piedrahita 1988), we also measured total algal community biomass over time,
albeit at a much lower temporal resolution than DO. Acidification generally has a strong
effect on algal community composition and can reduce species diversity, but at the same time
Figure 3. (A) The modulus (absolute value) of the complex coefficients for the Morse
wavelet at the 1.02-period scale for each pond over time. The modulus acts like an
‘amplitude envelope’ capturing the real part of the wavelet coefficient (see Fig. S7) and
describes the magnitude of the daily variation across a one-day window. (B) and (C) show
means and the associated standard error for the moduli for each phase separately. In (B), the
outlier pond A4 is included, in (C) it is excluded. Black lines and points, pH 5.5; orange10
lines and points, pH 6.5; blue lines and point, pH 8.5.bioRxiv preprint doi: https://doi.org/10.1101/2020.01.27.921437. The copyright holder for this preprint (which was not peer-reviewed) is the
author/funder. It is made available under a CC-BY-NC-ND 4.0 International license.
it was shown that community biomass is usually little effect (Geelen and Leuven 1986). We
found that the loss of the DO cycle was accompanied by a temporary and strong reduction in
algal biomass (Fig. S5) and that the recovery of the DO cycle was paralleled by a recovery of
algal biomass during phase 2.1. It is possible that a pure ecological process via sorting could
have led to a loss of diversity, but rapid growth of the remaining tolerant algal species quickly
compensated the loss of species (Klug et al. 2000). Alternatively, species may have rapidly
adapted through phenotypic plasticity (Chevin et al. 2013) or evolution, either via selection on
standing genetic variation (Barrett and Schluter 2008) or de novo mutations. Thus,
preselection to stress may allow a degree of community tolerance, through a combination of
ecological sorting and evolutionary selection which can also maintain ecosystem function
(Bell et al. 2019, Fugère et al. 2020). Phytoplankton typically double population sizes within
one to a few days, depending on the environmental conditions (Reynolds 1984). It is thus
conceivable that selection pressures had an immediate evolutionary impact on the community
which resulted in the DO cycle being restored.
We showed very weak effects of pre-exposure to pH 6. In part this might be because
the buffering capacity of the ponds resulted in an actual pH close to 6.5. A pH of 6.5 is
circumneutral and commonly experienced in Lac Hertel, the source for our ponds (Kalff
1972). Therefore, a pH of 6.5 was likely insufficient to induce a community wide tolerance to
acidification. In contrast, acidification to pH 5.5 is known to reduce phytoplankton diversity
and change phytoplankton community composition (Geelen and Leuven 1986) and likely
constituted a stronger selective condition.
Explicit consideration of time scale is critical to modeling associations between
variables measured because patterns can change both qualitatively and quantitatively with the
scale of analysis (Keitt and Urban 2005, Keitt and Fischer 2006). The loss of diurnal
variability represents a loss of function for these aquatic ecosystems, but over longer time
scales the maintenance of cycle stability is an indication of community resistance. The
wavelet analysis revealed the temporal scales at which acidification had the strongest impact.
As per our hypothesis, pH strongly influenced daily fluctuations in dissolved oxygen. A
coarser dataset (e.g. daily or weekly averages of DO) would have obscured our key finding.
An important general conclusion is that the analysis of community and ecosystem stability
requires the measurement of dynamics at multiple temporal scales, and at frequencies that can
detect changes expected at the shortest scales.
11bioRxiv preprint doi: https://doi.org/10.1101/2020.01.27.921437. The copyright holder for this preprint (which was not peer-reviewed) is the
author/funder. It is made available under a CC-BY-NC-ND 4.0 International license.
Conclusions
The rapid and severe ecological impacts associated with the human-caused
contamination of aquatic ecosystems make it ever more important to study the conditions
allowing communities persist and recover (Bell and Gonzalez 2011, Vander Wal et al. 2012,
Geerts et al. 2015). We found that the temporal stability of the DO cycle could be maintained
when exposed to extreme stress if the ponds were pre-exposed to intermediate stress
(MacGillivray et al. 1995, Flöder and Hillebrand 2012, Wright et al. 2015). Prior exposure to
acid stress can attenuated the impact of strong acidification on the DO cycle’s persistence and
amplitude. Given the strength of the responses we hypothesize that the persistence of the DO
cycle involved a joint ecological and evolutionary sorting of the phytoplankton community
resulting in an acid tolerant community capable of maintaining a normal ecosystem cycle
even at pH 3. More work is required to uncover the contribution of ecological and
evolutionary processes to rapid adaptation and to quantify their ability to restore ecosystem
stability in a stressful environment.
Data availability
All data presented, and all code used will be archived on an online repository upon
manuscript acceptance.
References
Arnoldi, J.-F., A. Bideault, M. Loreau, and B. Haegeman. 2018. How ecosystems recover
from pulse perturbations: A theory of short- to long-term responses. Journal of
Theoretical Biology 436:79–92.
Barrett, R., and D. Schluter. 2008. Adaptation from standing genetic variation. Trends in
Ecology & Evolution 23:38–44.
Bell, G., V. Fugère, R. Barrett, B. Beisner, M. Cristescu, G. Fussmann, J. Shapiro, and A.
Gonzalez. 2019. Trophic structure modulates community rescue following
acidification. Proceedings of the Royal Society B: Biological Sciences 286:20190856.
Bell, G., and A. Gonzalez. 2009. Evolutionary rescue can prevent extinction following
environmental change. Ecology Letters 12:942–948.
Bell, G., and A. Gonzalez. 2011. Adaptation and evolutionary rescue in metapopulations
experiencing environmental deterioration. Science 332:1327–1330.
12bioRxiv preprint doi: https://doi.org/10.1101/2020.01.27.921437. The copyright holder for this preprint (which was not peer-reviewed) is the
author/funder. It is made available under a CC-BY-NC-ND 4.0 International license.
Belley, R., P. V. R. Snelgrove, P. Archambault, and S. K. Juniper. 2016. Environmental
Drivers of Benthic Flux Variation and Ecosystem Functioning in Salish Sea and
Northeast Pacific Sediments. PLOS ONE 11:e0151110.
Blasius, B., A. Huppert, and L. Stone. 1999. Complex dynamics and phase synchronization in
spatially extended ecological systems. Nature 399:354–359.
Chevin, L.-M., R. Gallet, R. Gomulkiewicz, R. D. Holt, and S. Fellous. 2013. Phenotypic
plasticity in evolutionary rescue experiments. Philosophical Transactions of the Royal
Society B: Biological Sciences 368.
Cowan, J., J. Pennock, and W. Boynton. 1996. Seasonal and interannual patterns of sediment-
water nutrient and oxygen fluxes in Mobile Bay, Alabama (USA):regulating factors
and ecological significance. Marine Ecology Progress Series 141:229–245.
Cuenca Cambronero, M., H. Marshall, L. De Meester, T. A. Davidson, A. P. Beckerman, and
L. Orsini. 2018. Predictability of the impact of multiple stressors on the keystone
species Daphnia. Scientific Reports 8.
Demars, B. O. L., J. Thompson, and J. R. Manson. 2015. Stream metabolism and the open
diel oxygen method: Principles, practice, and perspectives: Problems in stream
metabolism studies. Limnology and Oceanography: Methods 13:356–374.
Downing, A. L., B. L. Brown, E. M. Perrin, T. H. Keitt, and M. A. Leibold. 2008.
Environmental Fluctuations Induce Scale-Dependent Compensation and Increase
Stability in Plankton Ecosystems. Ecology 89:3204–3214.
Flöder, S., and H. Hillebrand. 2012. Species traits and species diversity affect community
stability in a multiple stressor framework. Aquatic Biology 17:197–209.
Fugère, V., M.-P. Hébert, N. B. Costa, C. C. Y. Xu, R. D. H. Barrett, B. E. Beisner, G. Bell,
G. F. Fussmann, J. Shapiro, V. Yargeau, and A. Gonzalez. 2020. Community rescue in
experimental phytoplankton communities facing severe herbicide pollution. Nature
Ecology & Evolution accepted.
Geelen, J. F. M., and R. S. E. W. Leuven. 1986. Impact of acidification on phytoplankton and
zooplankton communities. Experientia 42:486–494.
Geerts, A. N., J. Vanoverbeke, B. Vanschoenwinkel, W. Van Doorslaer, H. Feuchtmayr, D.
Atkinson, B. Moss, T. A. Davidson, C. D. Sayer, and L. De Meester. 2015. Rapid
evolution of thermal tolerance in the water flea Daphnia. Nature Climate Change
5:665–668.
Gilg, O. 2003. Cyclic Dynamics in a Simple Vertebrate Predator-Prey Community. Science
302:866–868.
13bioRxiv preprint doi: https://doi.org/10.1101/2020.01.27.921437. The copyright holder for this preprint (which was not peer-reviewed) is the
author/funder. It is made available under a CC-BY-NC-ND 4.0 International license.
Grinsted, A., J. C. Moore, and S. Jevrejeva. 2004. Application of the cross wavelet transform
and wavelet coherence to geophysical time series. Nonlinear Processes in Geophysics
11:561–566.
Ives, A. R., and B. J. Cardinale. 2004. Food-web interactions govern the resistance of
communities after non-random extinctions. Nature 429:174–177.
Kalff, J. 1972. Net Plankton and Nanoplankton Production and Biomass in a North Temperate
Zone Lake. Limnology and Oceanography 17:712–720.
Keitt, T. H. 2008. Coherent ecological dynamics induced by large-scale disturbance. Nature
454:331–334.
Keitt, T. H., and J. Fischer. 2006. Detection of Scale-Specific Community Dynamics Using
Wavelets. Ecology 87:2895–2904.
Keitt, T. H., and D. L. Urban. 2005. SCALE-SPECIFIC INFERENCE USING WAVELETS.
Ecology 86:2497–2504.
Klug, J. L., J. M. Fischer, A. R. Ives, and B. Dennis. 2000. Compensatory dynamics in
planktonic community responses to pH perturbations. Ecology 81:387–398.
Lilly, J. M., and S. C. Olhede. 2012. Generalized Morse Wavelets as a Superfamily of
Analytic Wavelets. IEEE Transactions on Signal Processing 60:6036–6041.
Locke, A., and W. G. Sprules. 1994. Effects of Lake Acidification and Recovery on the
Stability of Zooplankton Food Webs. Ecology 75:498–506.
Low-Décarie, E., M. Kolber, P. Homme, A. Lofano, A. Dumbrell, A. Gonzalez, and G. Bell.
2015. Community rescue in experimental metacommunities. Proceedings of the
National Academy of Sciences 112:14307–14312.
MacGillivray, C. W., J. P. Grime, and T. I. S. P. (ISP) Team. 1995. Testing Predictions of the
Resistance and Resilience of Vegetation Subjected to Extreme Events. Functional
Ecology 9:640–649.
Niyogi, Lewis, and McKnight. 2003. Effects of Stress from Mine Drainage on Diversity,
Biomass, and Function of Primary Producers in Mountain Streams. Ecosystems
6:540–550.
Pinheiro, J., D. Bates, S. DebRoy, D. Sarkar, and R Core Team. 2019. nlme: Linear and
Nonlinear Mixed Effects Models.
Rajwa-Kuligiewicz, A., R. J. Bialik, and P. M. Rowiński. 2015. Dissolved oxygen and water
temperature dynamics in lowland rivers over various timescales. Journal of Hydrology
and Hydromechanics 63:353–363.
14bioRxiv preprint doi: https://doi.org/10.1101/2020.01.27.921437. The copyright holder for this preprint (which was not peer-reviewed) is the
author/funder. It is made available under a CC-BY-NC-ND 4.0 International license.
Rapport, D. J., H. A. Regier, and T. C. Hutchinson. 1985. Ecosystem Behavior Under Stress.
The American Naturalist 125:617–640.
Reynolds, C. S. 1984. The Ecology of Phytoplankton. Cambridge University Press.
Schindler. 1985. Long-Term Ecosystem Stress: The Effects of Years of Experimental
Acidification on a Small Lake. Science 228:1395–1401.
Schindler, D. E., K. Jankowski, Z. T. A’mar, and G. W. Holtgrieve. 2017. Two-stage
metabolism inferred from diel oxygen dynamics in aquatic ecosystems. Ecosphere
8:e01867.
Schindler, D. W., Curtis, Parker, and Stainton. 1996. Consequences of climate warming and
lake acidification for UV-B penetration in North American boreal lakes. Nature:705–
708.
Smith, D. W., and R. H. Piedrahita. 1988. The relation between phytoplankton and dissolved
oxygen in fish ponds. Aquaculture 68:249–265.
Thompson, P. L., B. E. Beisner, and A. Gonzalez. 2015. Warming induces synchrony and
destabilizes experimental pond zooplankton metacommunities. Oikos 124:1171–1180.
Vander Wal, E., D. Garant, M. Festa-Bianchet, and F. Pelletier. 2012. Evolutionary rescue in
vertebrates: evidence, applications and uncertainty. Philosophical Transactions of the
Royal Society B: Biological Sciences 368:20120090–20120090.
Venkiteswaran, J. J., S. L. Schiff, and L. I. Wassenaar. 2008. Aquatic Metabolism and
Ecosystem Health Assessment Using Dissolved O2 Stable Isotope Diel Curves.
Ecological Applications 18:965–982.
Weiss, L. C., L. Pötter, A. Steiger, S. Kruppert, U. Frost, and R. Tollrian. 2018. Rising pCO 2
in Freshwater Ecosystems Has the Potential to Negatively Affect Predator-Induced
Defenses in Daphnia. Current Biology 28:327-332.e3.
Wetzel, R. G. 2001. Limnology: Lake and River Ecosystems. Gulf Professional Publishing.
Wright, A. J., A. Ebeling, H. de Kroon, C. Roscher, A. Weigelt, N. Buchmann, T. Buchmann,
C. Fischer, N. Hacker, A. Hildebrandt, S. Leimer, L. Mommer, Y. Oelmann, S. Scheu,
K. Steinauer, T. Strecker, W. Weisser, W. Wilcke, and N. Eisenhauer. 2015. Flooding
disturbances increase resource availability and productivity but reduce stability in
diverse plant communities. Nature Communications 6:6092.
15bioRxiv preprint doi: https://doi.org/10.1101/2020.01.27.921437. The copyright holder for this preprint (which was not peer-reviewed) is the
author/funder. It is made available under a CC-BY-NC-ND 4.0 International license.
Acknowledgements
The Canadian Foundation for Innovation and the Liber Ero Chair in Biodiversity Conservation
provided funding to A.G. to construct the LEAP pond facility. S.J.V.M. was funded by the
Swiss National Science Foundation (grant number P2ZHP3_L81462). O.L.P and S.J.V.M.
would like to thank the URPP GCB of the University of Zurich for financial support. We are
very grateful to Jihane Benbahtane, Rachel Rolland, Aseel Shakra, Kaushar Kagzi for data
collection and David Maneli for technical support in the field.
Author contributions
A.G., O.L.P, & S.J.V.M designed the study, S.J.V.M., C.B. & J.O.N.D. carried out the
experiment, S.J.V.M, J.M. & V.F. analyzed data, S.J.V.M. wrote the paper with substantial
contributions of all authors
16You can also read