Why does the COVID-19 outbreak in Mexico seem to be slower? Some hypotheses for testing
←
→
Page content transcription
If your browser does not render page correctly, please read the page content below
Why does the COVID-19 outbreak in Mexico seem to
be slower? Some hypotheses for testing
Manuel Elías-Gutiérrez
El Colegio de la Frontera Sur https://orcid.org/0000-0003-2562-4584
Manuel Mendoza-Carranza ( mcarranza@ecosur.mx )
El Colegio de la Frontera Sur https://orcid.org/0000-0001-8216-2115
Umon Takahashi-Aguilar
Martha Valdez-Moreno
El Colegio de la Frontera Sur
Jenny Alexandra Prado-Bernal
Clínica Carranza
Claudia Mora-Loya
Clínica Carranza
Research Article
Keywords: Ultraviolet Index, data de ciency, vaccination, public transportation.
DOI: https://doi.org/10.21203/rs.3.rs-51450/v1
License: This work is licensed under a Creative Commons Attribution 4.0 International License.
Read Full License
Page 1/15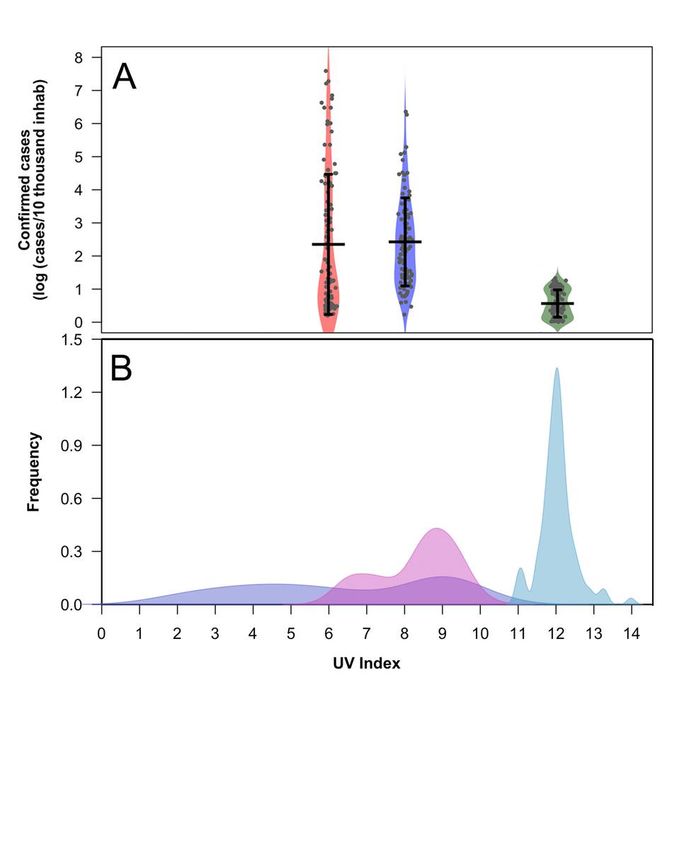
Abstract
Aim: The current paper aims to present and discuss some hypothesis about why in Mexico and in
particular the Mexico City the epidemy of COVID-19 seems to be slower than other countries.

Subject and methods: We compared daily UVI maximum and the reported COVID cases in Mexico City,
New York, and Los Angeles and performed an ADONIS permutation test to look for signi cant differences
between case numbers and its relationship with the UV index. We performed a quantile regression to
explain the relation between UVI and daily COVID cases. We also investigated and analyzed other
possible factors contributing to this slowdown because UVI cannot be the only explanation.

Results: Although Mexican authorities have applied one of the smaller numbers of tests in the world, it is
possible to identify a slowdown in Mexico's rate of infections. We found a negative and signi cant
difference between the UV and registered cases among the three cities analyzed. However, this slowdown
cannot be explained by a single factor. It is possible to hypothesize about the con uence of other factors
as Vitamin D levels in Mexican population, lack of central air conditioning and the ventilation in houses
and metropolitan transportation systems. Also, the Bacillus Calmette–Guérin vaccination could be part of
the explanation of this phenomenon.

Conclusions: Single parameter models as solar irradiation can explain partially the complicated spread of
COVID-19 in different parts of the world. However, it is necessary to extend our scienti c understanding of
environmental effects, city infrastructure, population age, vaccination schemes, socioeconomic
conditions, social and political behavior on COVID-19 epidemic dynamics.

Introduction
The rate of infection of COVID-19, is accelerating in most countries, particularly in the United States. In
contrast, the infection rate appears to be slower in Mexico, despite populated areas of the country being
ripe for wide-spread infection. For example, the Mexico City Metropolitan Area hosts, together with the
suburbs in the State of Mexico, more than 20 million people (CONAPO 2010) in about 7954 km2, making
human-to-human transmission highly favorable. The populace itself should also be highly susceptible to
complications from COVID-19 due to limited sanitary services, poor air quality due to pollution, rampant
diabetes, and obesity. Additionally, while the federal government initially explained that they were
sampling accordingly with the Sentinel Surveillance model, developed by the World Health Organization
(WHO) for other pandemics, it seems that strategy was abandoned following an intense polemic.

Mexico is one of the principal economies in Latin America and the tenth most populous in the world with
129 million people. However, COVID-19 studies are scarce and most of them are descriptions about the
general situation and development of the pandemic (e.g. Centeno 2020; Ñamendys-Silva 2020; Ramos
2020). Consequently, possible causes of the growth epidemic rate of Mexico cases are unknown, being
the lowest in the world for testing (Table 1). Taken together, one would expect this country to have a high
number of COVID-19 cases, and the outbreak should certainly not be slowing for no reason this early in
                                                   Page 2/15
the pandemic. In this article, we sought to understand the reasons for this phenomenon better. Our goal
was to inquiry why the reported number of infections in Mexico is lower than expected based on
population size and the aforementioned factors. We focused our discussion in a series of potential
environmental factors that could be related with the lower rate of infections observed especially in
Mexico City, as the solar UV irradiation (Sagripanti and Lyte 2007; Gunthe et al. 2020), the ventilation of
houses and public transport, and Mexican vaccination scheme. It is important to highlight a possible gap
in epidemic statistics based in the low number of COVID-19 tests in relation to population size in Mexico
(Theodoros et al. 2020).
Materials And Methods
Checking if there is a slowdown
We determined the number of patients in hospitals in Mexico City, using COVID-19 tracking apps
developed by the government (Gobierno de la Ciudad de México 2020a) and examined several
institutions as the National Institute of Respiratory Diseases. Also, we examined the number of casualties
in the whole country.
Comparisons
We focused on Mexico City and compared it with two cities in the United States (New York and Los
Angeles). We compared the whole country with other Latin American countries. We concede that no
country can know their correct number of cases, as that would require continuous testing of every
individual in their population. However, the number of cases in Mexico is assumed to be much higher
than reported because of Mexico’s below-average testing.
UV Irradiance
We inquiry, among other factors, that there might be a causal relationship between local UV index (UVI)
and the number of COVID cases. To test this hypothesis, we used as model the maximum daily UVI and
reported COVID positive cases in Mexico City (CDMX), New York (NY), and Los Angeles (LA) from March
12th to June 26th, 2020.
Data Acquisition
All data used here are public. UV index (UVI) values were obtained for New York (NY) and Los Angeles
(LA) from the UV-B Monitoring and Research Program of the Colorado State University (Colorado State
University 2020). For Mexico City (CDMX), UVI values were obtained from two sources: 1) the solar
radiation records of the CDMX Government (Gobierno de la Ciudad de México 2020b) for March data; and
2) the Weather online website (WeatherOnline Ltd 2020) for April and May data. Con rmed COVID cases
for NY and LA data were obtained from the NYC Health Department (2020) and Department of Public
Page 3/15Health (2020) respectively. Mexico COVID data were obtained from the COVID-19 information site from
Mexican Government (Gobierno de México 2020).
Statistical Analysis
Daily case numbers were standardized to cases per ten thousand inhabitants (=10ti). An ADONIS
permutation (1000) test was performed to look for signi cant differences between the number of COVID
cases and its relationship with the UV index. Finally, a quantile regression analysis was performed to
explain the relation between maximum daily UVI and daily COVID cases per ten thousand inhabitants
(Koenker and Hallock 2001; Koenker 2005), good of t was measured using the pseudo R1 calculation
(Koenker and Machado 1999).
Source of Information for Hypotheses Proposed
Finally, we consulted the Web of Science (https://webofknowledge.com) to gather all COVID-19 updates
until June 15th, 2020, mainly related to UV, BCG vaccination, and other themes that could help to explain
the slowdown of the pandemics in Mexico.
Results
Slowdown of Infections in Mexico
From 78 hospitals designated as COVID-19 in CDMX (a low gure for the size of the city), 18 were still
with places, according to the o cial site of the Mexican Government (Gobierno de la Ciudad de México
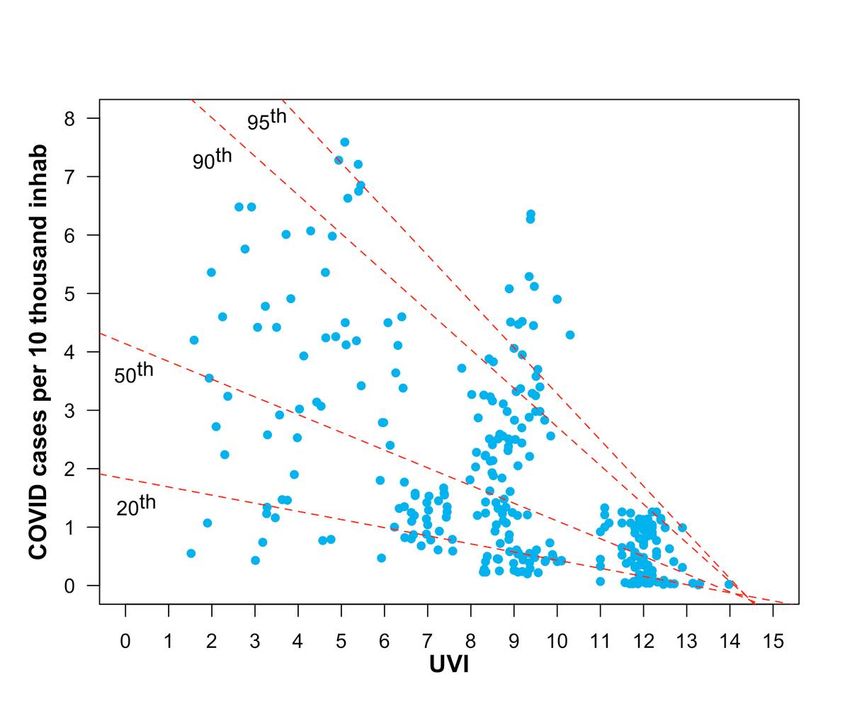
2020a). The average daily COVID cases for CDMX were 0.56 ± 0.41 cases per 10ti, while LA had 2.42 ±
1.33 cases per 10 ti, and NY had 2.35 ± 2.11 cases per 10 ti (Fig. 1A). Total number of deaths in Mexico
by June 23th was 22,580, a higher number in proportion to detected cases than most countries (Roser et
al. 2020).
UV index and COVID relation
Average UVI followed the opposite trend, with CDMX having the highest score (12.01 ± 0.47), followed by
LA (8.26 ± 1.23) and NY (6.37 ± 2.6) (Fig. 1B). The Adonis permutation test indicates signi cant
differences among positive COVID cases numbers between the three cities (p= 0.0009) and UVI scores
(p=0.0009). In addition, we found an independent effect of the UVI on the number of COVID cases
between each city (p=0.0009, Table 2) and the effect of City and UV (P=0.0009). Quantile regression
analysis shows a negative relation between COVID case number and the increase of UVI. The pseudo R1
value is increased in relation with quantile increase reaching a maximum R1 of 0.36 for 90 and 95th
quantiles (Table 3, Fig. 2).
Discussion
Page 4/15Gunthe et al. (2020) suggest a possible negative relationship between UV radiation, temperature, and
COVID case numbers. However, their data are not conclusive because the adjusted curve diminishes on
both sides around a peak, making it di cult to interpret. In China, Yao et al. (2020) found no relationship
between average UVI and COVID case numbers, but in one region (Hubei), these authors show a possible
negative correlation. Other unpublished studies have tried to resolve weather effects on a pandemic, with
no conclusive results (Xu et al. 2020). Some possible bias in mentioned studies could be the use of daily
UV averages. We used the maximum UVI per day (that goes from zero to maximum), producing a
comprehensive relation between UVI and positive COVID-19 cases.
Despite the observed relation, it is important to remark that the UVI is only one part of the explanation to
the low prevalence of COVID cases in CDMX compared to similar cities as NY and LA. Paradoxically,
CDMX has ideal conditions for a rapid spread of any pandemic due to population density and other
factors as high prevalence of chronic diseases and hotspots of people accumulation, as the subway
system (Metro). In addition to the UV effect, it is necessary to consider other factors that can explain the
behavior of the COVID epidemic in CDMX and most of the country. One factor related to high UVI,
additional to latitude, is the altitude above sea level. In the case of the Mexican Plateau, where CDMX and
other major cities such as Toluca, Puebla, Querétaro, and Morelia are found, the average elevation is
≥2000 masl. For example, the UVB levels in a station located about 60 km southeast of CDMX
(Tlamacas, at 4000 masl) had a maximum average irradiance of 400 mW/m2 of UVB in March, with a
minimum near 250 mW/m2 in January. Two other localities at the same latitude, but at sea level, have
around 300 mW/m2 (Manzanillo and Veracruz), with a minimum of about 150 mW/m2 on the same
dates (Valdes-Barron et al. 2013). In addition to the amount of UV reaching the surface, the type of it also
affects its capacity to inactivate pathogens. UV is found in the environment in three forms: UVA, UVB, and
UVC. Each of these will reach the surface in different quantities after atmospheric ltration, so the type of
UV reaching the surface (and subsequent germicidal effect) is also affected by altitude over sea level
(Dwivedi et al. 2018).
The effect of natural and arti cial UV on virus inactivation has been extensively studied. For example, the
in uenza virus is inactivated by up to 99% if exposed to full sunlight during a single day in Mexico City,
but this value lowers to 66% in the winter (Sagripanti and Lyte 2007; Sagripanti and Lytle 2020). Another
study demonstrated that aerosolized MHV Coronavirus could be highly sensitive to 254 nm UV-C, but it is
dependent on the culture medium (Walker and Ko 2007). The effect of the UV on viral inactivation is
thought to be through uracil dimerization in the RNA (Woo et al. 2012). These authors also found that
UVC inactivates a bacteriophage virus more e ciently in aerosols (with differences depending on the
media) than droplets.
Other Factors Proposed to Explain the Slowdown
Differences in the behavior of COVID-19 development in Mexico (and possibly other countries at a similar
latitude) compared to more northern countries can only be partially explained by the UV effect and
altitude.
Page 5/15We suggest some other factors that need to be included in a more holistic model to explain the slowdown
COVID-19 infection in Mexico and CDMX. A possible link between solar radiation-Vitamin-D production
and the increase of immunological defenses against viruses (Grant 2008). Although controversial, the
effect of vitamin D deserves further study because it seems to have a positive result against this type of
infection (Kakodkar et al. 2020). Laird et al. (2020) suggest a positive relation between immune system
and vitamin D regulating cytokine response to pathogens, fact con rmed by Daneshkhah et al. (2020)
Another factor in uencing the COVID-19 epidemic behavior in Mexico could be the vaccination scheme.
Recently, researchers have suggested that Bacillus Calmette-Guérin (BCG) vaccination against
tuberculosis could diminish the spread of COVID-19 (Gupta 2020). This factor has three possible
explanations: 1. The molecular similarity between BCG antigens and viral antigens. After vaccination,
memory B and T cells recognize both BCG and respiratory pathogens; 2. BCG could lead to antigen-
independent activation of bystander B and T cells; and 3. Long-term activation and reprogramming of
innate immune cells called trained immunity. Monocytes undergo epigenetic histone modi cations at
promoter sites of genes encoding in ammatory cytokines, leading to long-term changes in their ability to
respond to novel stimuli (Redelman-Sidi 2020). This effect leads the activation of Th1 immunity and
downregulation of Th2, and the consequent reduction of local tissue destruction by SARS-Cov-2 (Gupta
2020). Indeed, there appears to be a signi cantly lower prevalence of COVID-19 in countries where it is
mandatory for BCG vaccination. In Mexico, massive vaccination with BCG started in 1951 and continues
up to the present (Hurtado-Ochoterena and Matías-Juan 2005).
It is also essential to notice that most houses in Mexico City have no central air conditioning or insulation
system, unlike the northern temperate regions with severe weather. As a result, Mexican houses are sunny
and well ventilated. Th air currents inside houses do not allow small particles to remain inside rooms or
houses for a long time, diminishing the probability of infection. This hypothesis was analyzed, albeit only
in a small number of studies (Hobday and Dancer 2013). Despite the effect of sunlight inside houses is
not currently known it is possible that play a similar role as in the environment, neutralizing virus particles
by UV radiation. Additionally, a sunny house represents a key element in preventing depression (An et al.
2016; Fleming et al. 2018) reinforcing the immune system (Szałach et al. 2019; Cruz-Pereira et al. 2020).
Similarly, the primary modes of metropolitan public transportation in Mexico also lack air conditioning,
including the vast subway system (Metro) of CDMX used by hundreds of thousand people daily. These
transportation systems always operate with the windows open and air circulation inside tunnels is
enhanced using ventilation system. Overall, the citizens of Mexico live under conditions less favorable to
virus survival on outdoor/public surfaces.
As we present along this paper, there are evidences that mentioned factors (UVI, vaccination scheme,
air ow) could reduce the spread velocity of COVID-19 infection. However, no current models or data exist
to explain how these factors affect the spread velocity of COVID-19 infection in large cities as CDMX.
This city has a high density of population, with many people having pre-existing chronic diseases as
Page 6/15diabetes, high blood pressure and obesity making them more susceptible to viral diseases (Gnatiuc et al.
2019; Rodríguez-Torres and Casas-Patiño 2019)
We do not know precisely how each factor mentioned here contributes to lessening the spread of COVID-
19. Nevertheless, the possible synergy of all of them appears to slower this pandemic. Currently, no model
exists that can take all these factors into account. We, therefore, consider the aforementioned ideas as
requiring rigorous testing.
Remarks on Data Gathered
A common weakness of any model is the lack of data. In the case of COVID-19, we can be con dent that
this is the principal limitation in explaining the epidemic development in Mexico and elsewhere (Burdorf
et al. 2020; Naudé 2020). If we add the asymptomatic people not reported but still contagious (Bai et al.
2020), the uncertainty may be higher. It is known that people’s behavior is related to COVID-19 spread
rates (Van Bavel et al. 2020). However, in certain conditions it is tough to calculate this relation, which is
another source of uncertainly in the prediction models.
It has been suggested that the number of fatalities could be three times higher than it currently is in
Mexico (Ahmed 2020). This gure would show 10-12,000 fatalities for the country and is currently not
supported by hard data by May 8th. Except for Brazil, most Latin American countries are experiencing a
slow spread of COVID-19. However, these data can be misleading due to a lack of testing, which is low in
every Latin American country (Table 1). Despite a lack of testing, the pandemic's true extent will
eventually become evident if COVID-19 cases overwhelm hospitals and funerary services, as they have in
Ecuador (mainly in the city of Guayaquil).
We presume this slowdown will slow the rate of infection but also make it continuous throughout the
summer complicating the function of sanitary services, including hospitals. Mexican authorities are
working to solve the lack of services and resources needed to confront a massive infection of COVID-19,
but already several hospitals have become a point of infection due to the lack of materials and poor
installations (Kitroeff and Villegas 2020).
Conclusions
Single parameter models can explain partially the complicated spread patterns of COVID-19 in different
parts of the world. We expect that the hypotheses presented here and other efforts will help to establish
the causes of the differential epidemic spread observed. Other authors have marginally discussed part of
the ideas exposed here (Zhang et al. 2020), although their work is controversial.
Finally, we need to extend our scienti c understanding of environmental effects, city infrastructure,
population age, vaccination schemes, socioeconomic conditions, social and political behavior on COVID-
Page 7/1519 epidemic dynamics. Otherwise, the decisions taken by the governments and people will be uninformed
and potentially erroneous.
Declarations
ACKNOWLEDGEMENTS
Sean Prosser (University of Guelph) critically reviewed the manuscript and assisted us with the English
version.
Competing Interests
The authors declare they have no competing interests
References
Ahmed A. (2020) Hidden Toll: Mexico Ignores Wave of Coronavirus Deaths in Capital. New York Times.
https://www.nytimes.com/2020/05/08/world/americas/mexico-coronavirus-count.html Accessed 9 May
2020
An M, Colarelli S M, O’Brien K, Boyajian M E (2016) Why we need more nature at work: Effects of natural
elements and sunlight on employee mental health and work attitudes. PLoS One 1:e0155614.
https://doi.org/10.1371/journal.pone.0155614
Bai Y, Yao L S, Wei T, Tian F, Jin D Y, Chen L J, Wang M Y (2020) Presumed Asymptomatic Carrier
Transmission of COVID-19. Jama-Journal Am Med Assoc. 323:1406–1407.
https://doi.org/10.1001/jama.2020.2565.
Van Bavel J J, Baicker K, Boggio P S, Capraro V, Cichocka A, Cikara M, Crockett M J, Crum A J, Douglas K
M, Druckman J N (2020) Using social and behavioural science to support COVID-19 pandemic response.
Nat Hum Behav. 4:460–471. https://doi.org/10.1038/s41562-020-0884-z
Burdorf A, Porru F, Rugulies R (2020) The COVID-19 (Coronavirus) pandemic: consequences for
occupational health. Scand J Work Environ Health. 46:229–230. https://doi.org/10.5271/sjweh.3893
Centeno J E O. (2020) El coronavirus 19 (COVID 19) en México. Rev Chil Salud Pública. 24:72–73.
Colorado State University (2020) UV-B Monitoring and Research Program , Natural Resource Ecology
Laboratory. https://uvb.nrel.colostate.edu/UVB/da_UvIndex.jsf. Accessed 5 July 2020
CONAPO (2010) DELIMITACIÓN DE LAS ZONAS METROPOLITANAS DE MÉXICO 2010.
http://www.conapo.gob.mx/en/CONAPO/Zonas_metropolitanas_2010. Accessed 5 July 2020
Page 8/15Cruz-Pereira J S, Rea K, Nolan Y M, O’Leary O F, Dinan T G, Cryan J F (2020) Depression’s unholy trinity:
dysregulated stress, immunity, and the microbiome. Annu Rev Psychol. 71:49-78.
https://doi.org/10.1146/annurev-psych-122216-011613
Daneshkhah A, Eshein A, Subramanian H, Roy H K, Backman V (2020) The Role of Vitamin D in
Suppressing Cytokine Storm in COVID-19 Patients and Associated Mortality. medRxiv.
https://doi.org/10.1101/2020.04.08.20058578.
Department of Public Health (2020) Statewide Statistics. 2020.
https://www.cdc.gov/mmwr/statehealth/index.html Accessed 25 Jun 2020
Dwivedi A, Tripathi A K, Singh J, Pal M K (2018) Ultraviolet Radiation (UVR): An Introduction BT -
Photocarcinogenesis & Photoprotection. In (ed) Ray R S, Haldar C, Dwivedi A, Agarwal N, Singh J.
Springer Singapore, Singapore pp 1-8.
Fleming D, Grimes A, Lebreton L, Maré D, Nunns P (2018) Valuing sunshine. Reg Sci Urban Econ. 68:268–
276. https://doi.org/ 10.1016/j.regsciurbeco.2017.11.008
Gnatiuc L, Alegre-Díaz J, Wade R, Ramirez-Reyes R, Tapia-Conyer R, Garcilazo-Ávila A, Chiquete E,
Gonzáles-Carballo C, Solano-Sanchez M, Clarke R (2019) General and Abdominal Adiposity and Mortality
in Mexico City: A Prospective Study of 150 000 Adults. Ann Intern Med. 171:397–405. https://doi.irg/ doi:
10.7326/M18-3502
Gobierno de la Ciudad de México (2020a) Capacity in general care beds in Covid-19 Hospitals.
https://hospitales.covid19.cdmx.gob.mx/public/hospitales/EstatusHospitales.xhtml. Accessed 4 July
2020
Gobierno de la Ciudad de México (2020b) Radiación Solar (UVB).
http://www.aire.cdmx.gob.mx/default.php?opc=%27aKBhnmI=%27&opcion=bQ== Accessed 31 June
2020
Gobierno de México (2020) Covid-19 México. https://coronavirus.gob.mx/datos/#DownZCSV Accessed
28 June 2020
Grant W B (2008) Hypothesis-ultraviolet-B irradiance and vitamin D reduce the risk of viral infections and
thus their sequelae, including autoimmune diseases and some cancers. Photochem Photobiol. 84:356–
365. https://doi.org/10.1111/j.1751-1097.2007.00266.x.
Gunthe S S, Swain B, Patra S S, Amte A (2020) On the global trends and spread of the COVID-19 outbreak:
preliminary assessment of the potential relation between location-speci c temperature and UV index. J
Public Heal. 24:1-10. https://doi.org/10.1007/s10389-020-01279-y.
Gupta A (2020) Is Immuno-modulation the Key to COVID-19 Pandemic? Indian J Orthop. 54:394-397.
https://doi.org/10.1007/s43465-020-00121-7.
Page 9/15Hobday R A, Dancer S J (2013) Roles of sunlight and natural ventilation for controlling infection:
historical and current perspectives. J Hosp Infect. 84:271–282.
https://doi.org/10.1016/j.jhin.2013.04.011.
Hurtado-Ochoterena C A, Matías-Juan N A (2005) Historia de la vacunación en México. Rev Mex Pueric y
Pediatría. 13:47–52.
Kakodkar P, Kaka N, Baig M N (2020) A Comprehensive Literature Review on the Clinical Presentation, and
Management of the Pandemic Coronavirus Disease 2019 (COVID-19). Cureus 12:e7560.
https://doi.org/10.7759/cureus.7560.
Kitroeff N, Villegas P (2020) ‘It’s Not the Virus’: Mexico’s Broken Hospitals Become Killers, Too. New York
Times. https://www.nytimes.com/2020/05/28/world/americas/virus-mexico-doctors.html. Accessed 20
May 2020.
Koenker R. (2005) Quantile Regression in R: A Vignette. In: Kroenker R (ed) Quantile Regression.
Econometric Society Monographs. Cambridge University Press, Cambridge, Pages 295–316.
Koenker R, Hallock K F (2001) Quantile regression. J Econ Perspect. 15:143–156.
https://doi.org/10.1257/jep.15.4.143.
Koenker R, Machado J A F (1999) Goodness of t and related inference processes for quantile regression.
J Am Stat Assoc. 94:1296–1310 https://doi.org/10.2307/2669943.
Laird E, Rhodes J, Kenny R A (2020) Vitamin D and in ammation: potential implications for severity of
COVID-19. Irish med J. 113:P81.
Ñamendys-Silva S A (2020) Respiratory support for patients with COVID-19 infection. Lancet Respir Med.
8:e18. https://doi.org/10.1016/S2213-2600(20)30110-7
Naudé W (2020) Arti cial intelligence vs COVID-19: limitations, constraints and pitfalls. Ai Soc., 1:1-5.
https://doi.org/10.1007/s00146-020-00978-0
NYC Health Department (2020) COVID-19 Data. 2020. https://www1.nyc.gov/site/doh/covid/covid-19-
data.page Accessed 27 Jun 2020
Ramos C (2020) Covid-19: la nueva enfermedad causada por un coronavirus. Salud Publica Mex.
62:225–227.
Redelman-Sidi G (2020) Could BCG be used to protect against COVID-19? Nat Rev Urol. 17:316-317.
https://doi.org/10.1038/s41585-020-0325-9.
Rodríguez-Torres A, Casas-Patiño D (2019) Social determinants of obesity in Mexico. Rev Enfermería del
Inst Mex del Seguro Soc. 26:281–290.
Page 10/15Roser M, Ritchie H, Ortiz-Ospina E, Hasell J (2020) Statistics and Research Coronavirus Pandemic
(COVID-19). https://ourworldindata.org/ Accessed 25 Jun 2020
Sagripanti J L, Lyte D L (2007) Inactivation of In uenza Virus by Solar Radiation. Photochem Photobiol.
83:1278–1282. https://doi.org/DOI: 10.1111 ⁄ j.1751-1097.2007.00177.x.
Sagripanti J, Lytle C D (2020) Estimated Inactivation of Coronaviruses by Solar Radiation With Special
Reference to COVID‐19. Photochem Photobiol. Accepted Author Manuscript,
https://doi.org/10.1111/php.13293
Szałach Ł P, Lisowska K A, Cubała W J (2019) The in uence of antidepressants on the immune system.
Arch Immunol Ther Exp (Warsz). 67:143–151. https://doi.org/ 10.1007/s00005-019-00543-8
Theodoros V G, Sussman R A, Mier J M, Odriozola M D, Poulas K, Farsalinos K (2020) Characteristics and
risk factors for COVID-19 diagnosis and adverse outcomes in Mexico. JAMA 323:2052–2059.
https://doi.org/10.1101/2020.06.04.20122481
Valdes-Barron M, Pelaez-Chavez J C, Bonifaz-Alfonzo R, Riveros-Rosas D, Velasco-Herrera V, Estevez-
Perez H (2013) UVB solar radiation climatology for Mexico. Geo s Int 52:31–42.
https://doi.org/10.1016/s0016-7169(13)71460-0.
Walker C M, Ko G (2007) Effect of ultraviolet germicidal irradiation on viral aerosols. Environ Sci Technol
41:5460–5465. https://doi.org/10.1021/es070056u.
WeatherOnline Ltd (2020) Weather Online. 2020.
https://www.weatheronline.co.uk/weather/maps/forecastmaps?
LANG=en&CONT=mxmx&MAPS=uv&LOOP=0&LAND=__&MORE=1&UP=0&R=0&DAY=0 Accessed 30 June
2020
Woo M H, Grippin A, Anwar D, Smith T, Wu C Y, Wander J D (2012) Effects of Relative Humidity and
Spraying Medium on UV Decontamination of Filters Loaded with Viral Aerosols. Appl Environ Microbiol
78:5781–5787 https://doi.org/10.1128/aem.00465-12.
Xu B, Gutierrez B, Mekaru S, Sewalk K, Goodwin L, Loskill A, Cohn E L, Hswen Y, Hill S C, Cobo M M,
Zarebski A E, Li S R, Wu C H, Hulland E, Morgan J D, Wang L, O’Brien K, Scarpino S V, Brownstein J S,
Pybus O G, Pigott D M, Kraemer M U G (2020) Epidemiological data from the COVID-19 outbreak, real-
time case information. Sci Data 7. https://doi.org/10.1038/s41597-020-0448-0.
Yao Y, Pan J H, Liu Z X, Meng X, Wang W D, Kan H D, Wang W B (2020) No association of COVID-19
transmission with temperature or UV radiation in Chinese cities Eur Respir J. 55: 2000517.
https://doi.org/10.1183/13993003.00517-2020.
Zhang R, Li Y, Zhang A L, Wang Y, Molina M J (2020) Identifying airborne transmission as the dominant
route for the spread of COVID-19. Proc. Natl. Acad. Sci 117:14857-14863.
Page 11/15https://doi.org/https://www.pnas.org/cgi/doi/10.1073/pnas.2009637117.
Tables
TABLE 1 Total COVID-19 tests per thousand people by June 8th or 9th in some countries of the Americas.
*People tested; **Units unclear ***Samples tested +Tests performed.
Country Total Tests/1,000 persons Date of the last report (2020)
Canada 75.43 Jul 2
United States 101.09 Jul 2
Peru 7.76 Jul 3
Colombia 15.69 Jul 2
Ecuador 6.82 Jul 2
Mexico 4.04 Jun 26
Bolivia 6.63 Jul 1
TABLE 2 ADONIS permutation test results for COVID cases number in New York, Los Angeles and Mexico
Cities.
Main effect d.f. SS MS F.model R2 Pr(>F)
City 2 11.61 5.80 58.19 0.221 0.0009
UV index 1 3.15 3.15 31.62 0.060 0.0009
City*UV index 2 7.59 3.79 38.03 0.144 0.0009
Residuals 183 30.13 0.09 0.574
Error 188 52.48 1.0
TABLE 3 Quantile regression estimates of B0 and B1, 95% con dence intervals for B1, pseudo R1 and P
for Ho: B1 = 0 for four regression quantiles between UVI and COVID positive cases per 10 thousand
inhabitants in New York, Los Angeles and Mexico City.
Page 12/15T (quantile) Bo B1 95% CI for B1 R1 p
20 th 1.82 –0.13 –0.16 – 0.12 0.19 P < 0.001
50 th 4.13 –0.30 –0.35 –0.23 0.23 P < 0.001
90 th 9.33 -0.66 –0.83 –0.53 0.36 P < 0.001
95 th 11.18 –0.79 –0.87 –0.34 0.36 P < 0.001
Figures
Page 13/15Figure 1
Daily con rmed cases/10,000 inhabitants in NY (magenta), LA (blue), and CDMX (green) from March 9th
to June 26th and maximum daily in the same dates for UV index. Number of cases of cities are located in
axis x at the average UVI index for each.
Page 14/15Figure 2
UVI index versus positive COVID cases by 10 thousand inhabitants. Red lines are the 20th, 50th, 90th and
95th quantile regressions
Page 15/15You can also read