Canterbury City Council - Corporate Plan 2016 to 2020 - canterbury.gov.uk
←
→
Page content transcription
If your browser does not render page correctly, please read the page content below
CANTERBUr:v
                              CITY COUNCIL

Canterbury City Council
Corporate Plan 2016 to 2020

canterbury.gov.uk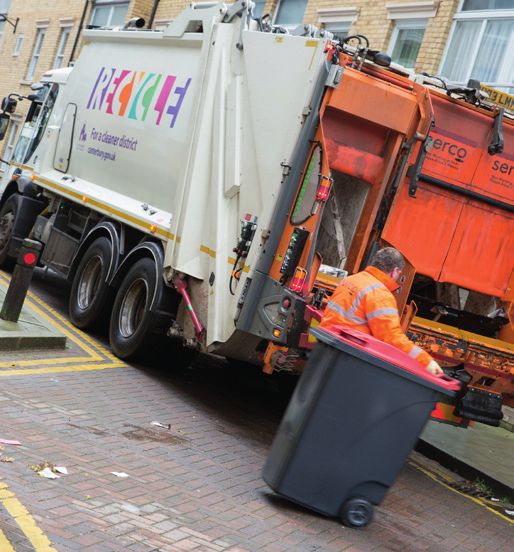
Corporate Plan 2016 to 2020
Welcome to Canterbury City Council Corporate Plan 2016 to 2020 which sets out the vision, ambitions and objectives of the Council up to
2020.

Contents                                                                                                                                                                                              Page
1. Introduction......................................................................................................................................................................... 2 to 3

2. Principles ................................................................................................................................................................................. 4

3.    Residents Priorities .................................................................................................................................................................. 5

4.    Plan on a page ......................................................................................................................................................................... 6

5. What we aim to achieve by 2020 ..................................................................................................................................................... 7
   Working to achieve enough high quality housing to meet everyone’s needs .................................................................................. 7
   Contributing to the good health of local people ............................................................................................................................... 8
   Focussing our community support on those in most need of it........................................................................................................ 9
   Acting with others to protect communities from flooding, crime and anti-social behaviour ........................................................ 10
   Inspiring people through a wide range of cultural activities and opportunities .............................................................................. 11
   Making our city, towns and villages places to be proud of .............................................................................................................. 12
   Keeping our district clean ................................................................................................................................................................. 13
   Protecting and enhancing our open spaces, heritage and wildlife .................................................................................................. 14
   Supporting business growth ............................................................................................................................................................. 15
   Enabling infrastructure improvements to regenerate our urban spaces and deliver economic growth ........................................ 16
   Our effectiveness as an organisation................................................................................................................................................ 17

6. About our District ................................................................................................................................................................... 18
           ............................................................................................................................................................................................... 18
   Places ................................................................................................................................................................................................ 21
People
   Prosperity .......................................................................................................................................................................................... 23

                                                                                                              1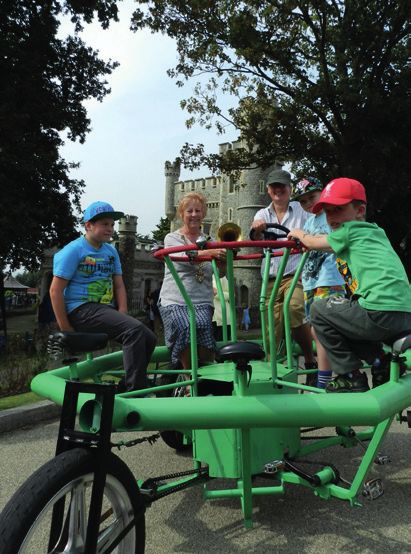
1. Introduction – Councillor Simon Cook

Our city, our towns, our council and local government, are at a crossroads. We have tough choices to make.

However, Canterbury has made great strides. Recently named the 'most vibrant' city in England, our ancient heritage is now enhanced by
modern iconic buildings that, nevertheless, add to its timelessness. The unique mix of our universities and their thousands of students; the
developing creative and IT based businesses, our exciting cultural scene, and the millions of people who visit each year from across the globe,
creates an environment and climate which has the potential to take the city beyond anything it has so far achieved, punching well above its
weight.

Herne Bay, with its pier, seafront and Victorian glory, is building on these assets - modernising itself, and attracting new types of business. We
will continue to invest in its infrastructure and upgrade its heritage, as well as concentrating on business growth.

Whitstable has emerged as one of the jewels of the south east. Working with the local community, we will be sensitive in making changes only
when necessary, improvements only where they add to the atmosphere.

Our villages, settled in countryside of national importance, should be sustainable and self-reliant focal points for local life, small business
growth, and the rural economy.

Our intent, beginning now, is to build on those strengths and create opportunities for people and businesses to thrive and prosper. We will do
what we can ourselves. Where it makes sense, we will work in partnership. We have the mandate to lead this ambition, and we are
determined to do so.

Our council, as a member of the local government community, is determined to thrive despite the financial challenges we face.

By 2019, we aim to be financially self-reliant, delivering our services and ambitions without a needs based grant from central government. We
want to lead the next stage of development of our city and district, helping to create growth and prosperity, but doing it as cost-effectively as
possible. We are determined to challenge the status quo to get the best value for money for our taxpayers, invest in the infrastructure our
district needs, and tackle the social and economic issues that are important to our citizens. When taking our decisions, we will do so in an open
and transparent way, and only take decisions in private when we are obliged to do so. When developing our service delivery and information
availability, we will do so with the needs of our customers foremost in our design, and with the maximum possible amount of cost-effective
digital access.

                                                                          2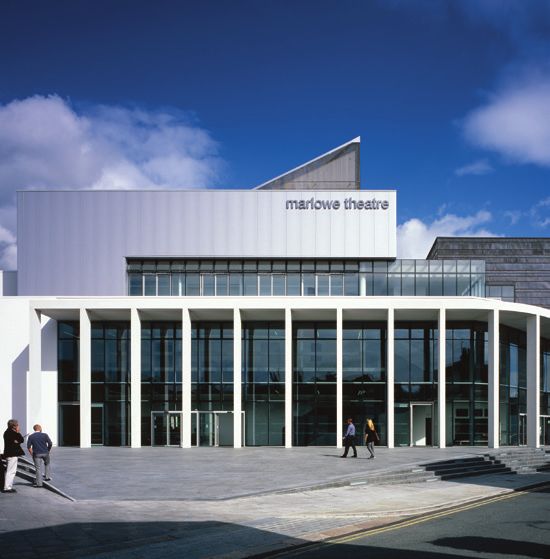
This plan is ambitious. We have no way of foretelling the future and it may be that we cannot achieve all of our ambitions. We prefer,
however, to clearly set out these ambitions – in so doing, to give a lead to our communities, and to concentrate our vision, resources and work
with partners so as to achieve them. We can modify our ambitions accordingly to our circumstances, and keep the public in touch with our
progress.

Our plans to do this are clear and measurable. Our three key areas of action are:

People

Places, and

Prosperity

Within each of these areas, we have a number of ambitions to make the difference we are determined to make.

                                                                       3
2. Principles

Principle 1     We will make clear and transparent decisions having been informed by local opinion
                We will do this by ensuring that:
                a) we will consult only where there is a genuine opportunity to influence the decision
                b) when consultation is appropriate, it should take place at a stage in the process when it can genuinely influence the outcome
                c) sufficient information is provided to allow consultees to provide an informed response
                d) the consultation will be open and accessible to all relevant interested parties
                e) the results of the consultation will be taken into account and made publicly available

Principle 2     We will encourage local individuals and communities to become self-reliant and actively engaged in improving facilities,
                activities and the environment

Principle 3     We will provide services that are as accessible as possible to local people and businesses

Principle 4     We will manage our assets to maximise their benefit to the council and the community

Principle 5     We will provide good value for money, defined by the balance between customer satisfaction, cost and effectiveness

Principle 6     We will take a commercial approach wherever appropriate, to help us achieve our aim of being self-financing

Principle 7     We will continue to make the most of our ability to attract additional funding and investment

Principle 8     We will be as sensitive as possible about our own environmental impact and work with others to do the same

Principle 9     We will deliver all our services, and treat everyone, without discrimination or inequality
                We will do this by fulfilling our duties under the Equalities Act 2010, having due regard to:
                a) eliminating discrimination, harassment and victimisation
                b) advancing equality of opportunity between people who share a protected characteristic1 and people who do not share it
                c) fostering good relations between people who share a protected characteristic and people who do not share it
                d) taking the impact on those with protected characteristics into account when we make decisions

1
 ‘Protected characteristic’ is a term used to refer to the groups of people protected under the Equality Act 2010 – defined by age; sex; religion/belief;
sexual orientation; disability; race; pregnancy & maternity; marriage and civil partnership; gender reassignment
                                                                               4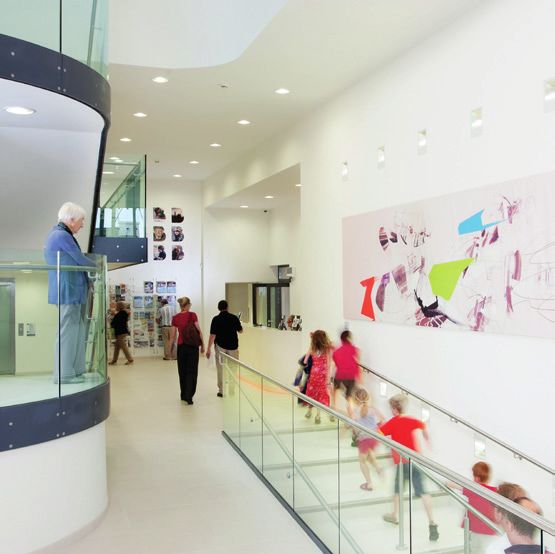
3. Residents’ Priorities
Every year the council undertakes a survey of residents to find out how we are doing and what residents’ priorities are for the future. In 2015, over 3,000
local people took part in the survey. We asked residents what was most important in making somewhere a good place to live and what most needed to be
improved. The top 10 issues are listed in order of priority, below. The council can only influence some of these directly and we are specifically focussing this
plan on where we can make a difference.

1.   Feeling safe (fear of crime) – Kent Police play the lead role in this. Our contribution is set out under aim 4 (page 10, below) and focusses on dangerous
     parking, neighbour nuisance, crime prevention using CCTV and using planning powers to ‘design out crime’.

2.   Level of traffic congestion – Kent Highways are the lead for this. Our contribution is set out under aims 2 and 10, (pages 8 and 16 below) focussing on
     cycle routes and park and ride.

3.   Affordable decent housing – we play a lead role in this. Our contribution is in aim 1 (page 7 below) and includes building affordable housing, our
     commitment to new homes in the district and working with the private sector to improve standards.

4.   The level of anti-social behaviour – see 1, above.

5.   Clean streets – this is our responsibility, as set out in aim 7 (page 13 below) and we predominantly deliver these services via our contractor.

6.   Quality of roads – Kent Highways are responsible for this, our role is facilitating new road networks through our Local Plan. Aim 10 (page 16 below)
     sets out our priorities.

7.   Public transport – we supplement public transport networks through provision of park and ride – aim 10 (page 16 below).

8.   Quality health services – Clinical Commissioning Groups, the NHS and KCC are the leads. Our contribution is set out in aim 2 (page 8 below) and
     includes ensuring there is suitable provision of leisure facilities to promote good health and working with particular communities where they have
     poorer health than others.

9.   Job prospects – our role is supporting business growth and enabling economic growth, as set out in aims 9 and 10 (pages 15 and 16 below).

10. Level of street homelessness – we are one of a number of organisations who impact on this. Our role is set out in aim 1 (page 7 below) and includes
    providing accommodation and supporting those at risk of homelessness.

                                                                                 5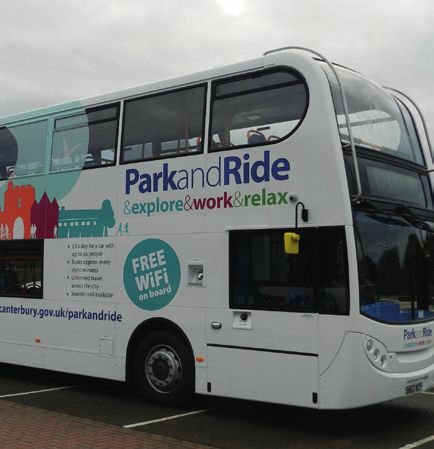
4. Plan on a page - Our aims are and objectives are summarised in the table below:

People         Residents enjoy a good quality of life and those in need are supported
We aim to do   1. Working to achieve enough high quality housing to meet everyone’s needs
this by:
               2. Contributing to the good health of local people

               3. Focussing our community support on those in most need of it

               4. Acting with others to protect communities from flooding, crime and anti-social behaviour

               5. Inspiring people through a wide range of cultural activities and opportunities

Places         We make the most of our unique built and natural environment
We aim to do   6. Making our city, towns and villages places to be proud of
this by:
               7. Keeping our district clean

               8. Protecting and enhancing our open spaces, heritage and wildlife

Prosperity     The district has a resilient, diverse economy which supports job growth
We aim to do   9. Supporting Business Growth
this by:
               10. Enabling infrastructure improvements to regenerate our urban spaces and deliver economic growth

                                                                    6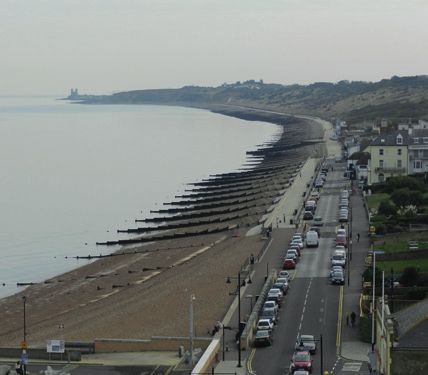
5. What we aim to achieve by 2020:
1. Working to achieve enough high quality housing to meet everyone’s needs
We aim to… Measuring our performance:
work with developers to deliver 16,000 new homes and to get maximum Number of new homes built
benefit from them (e.g. infrastructure) as envisaged in our Local Plan by Percentage of major planning applications dealt with in 13
2031 ` weeks or within agreed timescales
build housing for those who struggle to afford market prices Number of new homes granted planning permission
reduce homelessness Number of affordable homes delivered (gross)
encourage purpose-built student accommodation Reduction in the number of repeat homelessness
intervene to improve the quality of accommodation in the private rented applications
sector Percentage of people contacting the council as potentially
enable people to live independently homeless, where this is then prevented from happening
Applications from homeless people processed within time
(33 working days)
Reduction in the number of repeat homelessness
applications
Percentage of:
- HMO licences processed within 15 days
- private sector housing requests cases resolved within
target
- Disabled Facilities Grant budget spent
We will also monitor the following measures to understand what impact we and our partners are having on broader issues that need to be
tackled in our district:
Number of people rough sleeping
The total number of new homes actually built and the number of affordable homes within that
Average house price compared with average income
7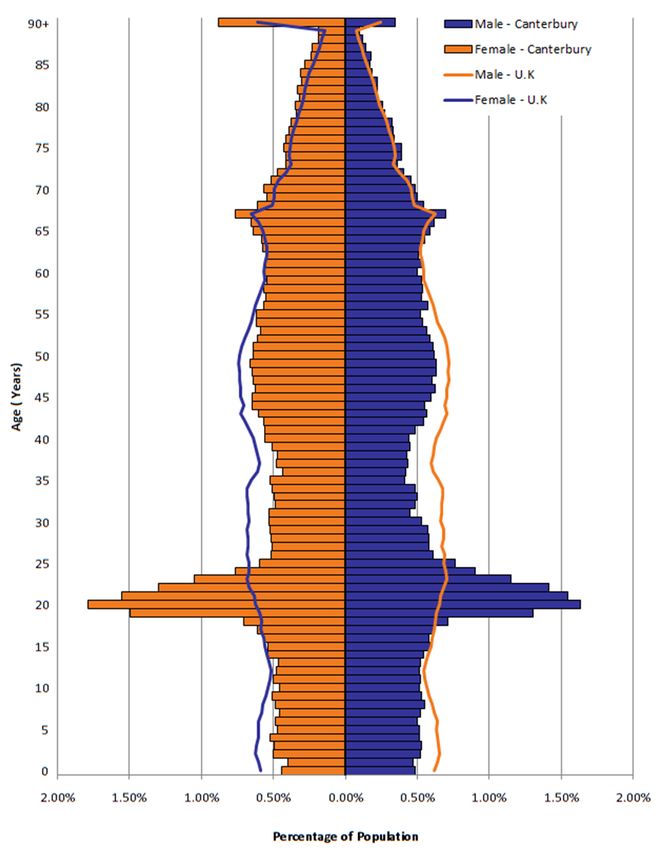
2. Contributing to the good health of local people
We aim to… Measuring our performance:
ensure affordable, varied and locally accessible facilities for leisure Number of visits to leisure centres
rebuild or refurbish Kingsmead Leisure Centre Council subsidy per visit to the leisure centres
open a new leisure facility in Whitstable Percentage uptake of GP health referrals to our leisure
rigorously apply standards to food safety centres
enable the improvement of cycle routes Number of 3 star Active Life memberships
tackle health inequalities2 through our work with specific target groups3 Proportion of 3 star Active Life members attending at least
promote walking trails and cycling routes once per week
Percentage of Food premises scoring 3+ under the Food
Hygiene Scheme
We will also monitor the following measures to understand what impact we and our partners are having on broader issues that need to be
tackled in our district:
A selection of health measures – including life expectancy, mental health prevalence, obesity, teenage pregnancy, dementia prevalence
Participation in physical activity
Maintenance and use of cycle routes
NO2 levels and other air quality measures
2
Health inequalities – where particular communities experience poorer health and lower life expectancy than others
3
Our target groups are defined in section 6 of this document
83. Focussing our community support on those in most need of it
We aim to… Measuring our performance:
focus early intervention work on our target groups4 to increase self- Families from catchment area registered at the Riverside
reliance and reduce the impact on public services Children’s Centre
focus our resources for community support on those individuals and Lifeline – percentage of faults/lost pendants resolved
families who we and partner organisations believe are most in need of within five days
that support Number of new Lifeline customers
raise staff awareness on how to meet the needs of vulnerable groups (for
example dementia)
sign-post individuals in need to other organisations/services that can
provide support
work with others to tackle isolation and financial hardship
provide the Lifeline service for vulnerable people
We will also monitor the following measures to understand what impact we and our partners are having on broader issues that need to be
tackled in our district:
Elderly population growth and numbers living alone
Number of young people not in education, employment or training (NEETs)
Domestic abuse
Dementia rates
Homelessness
Alcohol/drug/self-harm hospital admissions in adults and young people
4
Our target groups are defined in section 6 of this document
94. Acting with others to protect communities from flooding, crime and anti-social behaviour
We aim to… Measuring our performance:
limit the impact of damaging flooding Percentage of sites achieving standard protection in
enforce action against anti-social behaviour - including dangerous parking accordance with the Shoreline Management Plan
and neighbour nuisance Number of Community Protection warnings and orders
work with communities and the police on crime prevention and detection issued by the council about neighbourhood nuisance
- including through the effective use of CCTV Number of criminal investigations involving CCTV footage
‘design out crime’ through encouraging well thought out urban from the council control room
development through our planning powers Number of parking tickets issued for contraventions that
implement city council responsibilities in relation to the outcomes of the add to traffic congestion
“Higher and Further Education in Canterbury: An Impact Review”
We will also monitor the following measures to understand what impact we and our partners are having on broader issues that need to be
tackled in our district:
Crime and anti-social behaviour incidents
Cases resolved through partnership work
Repeat domestic abuse cases
Number of fatal road accidents
105. Inspiring people through a wide range of cultural activities and opportunities
We aim to… Measuring our performance:
offer a broad programme at the Marlowe Theatre which appeals to Number of visits to the Marlowe Theatre
all residents Percentage of attendance against capacity in Marlowe Theatre
develop a fascination for the theatre through our work with young main auditorium
people Number of visits to the Marlowe Studio
educate and interest people of all ages through varied museums Percentage of attendance against capacity in Marlowe Studio
programmes and collections Council subsidy per visit to the Marlowe Theatre
facilitate successful local entertainment and community venues in Number of children and young people engaged in activities at the
the city, towns and villages Marlowe Theatre
encourage and provide a diverse range of festivals, markets and Number of visits to the city museums
events Percentage of reach (usage of city museums against target
support community cultural activities market)
offer an affordable box office service to support local cultural Number of children and young people engaged in activities at the
groups city museums
support and publicise activities and venues which will appeal to Number of visits to the facilities we invest in (Horsebridge,
younger people Whitstable Castle for example)
develop a new multi-screen cinema at Kingsmead Number of visits to The Kings Hall
Percentage of attendance against capacity for ticketed shows at
The Kings Hall
Tickets sold for the other community venues through the
Marlowe box office
We will also monitor the following measures to understand what impact we and our partners are having on broader issues that need to be
tackled in our district:
Economic impact of cultural facilities and activities
Economic impact of tourism
Educational attainment
116. Making our city, towns and villages places to be proud of
Measuring our performance:
Across the district, we aim to: Percentage of closed against open planning enforcement
insist on high quality design for new developments cases
make the most of our heritage assets
take enforcement action where planning process is breached
In Canterbury, we aim to:
invest in public places - upgrading St Peter’s Street and St George’s Street;
Castle Street; Orange Street and the Friars
investigate extending the pedestrian area in the city centre
upgrade the market
implement a street tree replacement programme
work with our partners to maintain Purple Flag accreditation
In Herne Bay, we aim to:
develop the Beach Street area
complete town centre developments
complete the Aldi and Sainsbury developments
In Whitstable, we aim to:
deliver improvements around Whitstable harbour to enhance the public
realm and accessibility
In the rural areas, we aim to:
deliver environmental improvements in Herne and Sturry to complement
the new relief roads
We will also monitor the following measures to understand what impact we and our partners are having on broader issues:
Percentage of residents saying they have pride in the local area
Retention of blue flags for water quality and In Bloom awards
12 Number of awards for quality design in the district
7. Keeping our district clean
We aim to… Measuring our performance:
clean the streets regularly and thoroughly The percentage of recently cleaned sites which have no
collect waste and recycling efficiently litter or refuse present, confirmed via inspection (Grade A)
remove fly-posting and graffiti Percentage of randomly inspected sites which are mainly
prevent littering through awareness-raising and rigorous enforcement free from litter or refuse (Grade B)
work with residents, universities and businesses to keep the district clean Overall number of missed bins (per 100,000 collections)5
rigorously enforce against fly-tipping Percentage of Household waste sent for reuse, recycling
explore options to improve KCC owned roundabouts and verges and composting
Number of fines (Fixed Penalty Notices) issued for littering
Percentage of graffiti removal requests responded to
within specific time limits
Percentage of fly-posting removal requests responded to
within specific time limits
Number of prosecutions for littering
Number of fines (Fixed Penalty Notices) issued for fly-
tipping
Number of prosecutions for fly-tipping
We will also monitor the following measures to understand what impact we and our partners are having on broader issues that need to be
tackled in our district:
Percentage of residents saying that they are satisfied with their local area as a place to live
5
Comprises: number of missed residual waste collections (per 100,000 collections – target 23, number of missed recycling collections (per 100,000 collections – target 23,
number of missed garden waste collections (per 100,000 collections – target 35, number of missed food waste collections (per 100,000 collections – target 23. Total target
104,
138. Protecting and enhancing our open spaces, heritage and wildlife
We aim to… Measuring our performance:
manage and invest in our heritage assets across the district Investment in heritage buildings to reduce number of
manage natural sites we own to enhance the wildlife that use them Council buildings at risk
create and maintain high quality open space Percentage of Sites of Special Scientific Interest that are in
make our parks, play areas and open spaces places people want to use favourable or recovering conditions
enable the expansion of Duncan Down Percentage of residents using parks and play areas
extend and enhance Canterbury’s riverside network
implement the Reculver management plan
in partnership with the RSPB, deliver the Seasalter levels environmental
restoration project
We will also monitor the following measures to understand what impact we and our partners are having on broader issues that need to be
tackled in our district:
Quantity of open space delivered in new developments
149. Supporting business growth Measuring our performance:
Across the district, we aim to: Number of jobs supported
increase the amount of overnight and holiday accommodation to enhance tourism through council provided and
deliver business start-up space facilitated workspace
create hi-tech work spaces via a business hub, and through the use of our planning powers Business survival rates after 12
use our procurement opportunities to secure jobs and apprenticeships for local people (for example months for businesses
during major building projects)
In Canterbury, we aim to: supported through Startmybiz
build on the business opportunities offered by higher education's impact on the city and Growmybiz
encourage the retention of graduates by creating a welcoming place with suitable jobs for them
work with education providers to develop relevant local skills to enable job growth
In Herne Bay, we aim to:
improve marketing and visitor signage to increase visitor spending in Herne Bay
support the establishment of sustainable town centre management activity
support the development of activity on Herne Bay Pier
In Whitstable, we aim to:
support diversification through business development
In rural areas
support new business ideas, services and community initiatives that will help grow the economy (for
example through initiatives such as the East Kent Leader programme)
We will also monitor the following measures to understand what impact we and our partners are having on broader issues:
New business registration rates and business survival rates
Economic impact of the universities
Unemployment levels
Graduate retention
Percentage of high value jobs (science, professional services, creative industries); comparative wage levels (residents/people coming here to work)
Economic value of the tourist economy
Amount of employment space lost or gained each year
Visitors’ length of stay in the district
1510. Enabling infrastructure improvements to regenerate our urban spaces and deliver Measuring our performance:
economic growth
Across the district, we aim to: Occupancy rate in ANPR car
support the roll-out of the most advanced digital technology parks – average stay per vehicle
make our car parks as accessible and attractive as possible6 Amount of external investment
do what we can to tackle congestion secured by CCC for
infrastructure projects
In Canterbury, we aim to: throughout the district
attract a destination hotel to the city Number of vehicles using Park
deliver a new hotel on the Slatters site and Ride
complete the final phase of regeneration at Kingsmead Park and Ride as a proportion of
have an agreed development scheme at Wincheap, including the last Wincheap A2 slip road total parking
enable the building of a new Bridge A2 junction
increase park and ride capacity
work with others to deliver a digitally smart city
In Herne Bay and Whitstable
explore creating a park and ride service at Whitstable
encourage a town centre hotel in Herne Bay
improve the use of the land to the east of Whitstable Harbour
make Whitstable Harbour an iconic destination in the South East
In rural areas
enable the building of the Herne relief road
enable the building of the Sturry relief road
6
Achieve the best possible provision and customer experience of parking in the city centre bearing in mind the needs of businesses in the city as per the commitment to
Kent County Council as set out in the Canterbury District Transport Strategy
16Our effectiveness as an organisation
In addition, we will monitor how effective we are as an organisation through the following:
People satisfied with the way the council runs things
People who think the council keeps them well informed about council services
Residents who feel they can influence decisions that affect their local area
Percentage of Council Tax collected
Percentage of Council Tax bills sent out digitally
Percentage of Business Rates collected
Number of Ombudsman complaints upheld
Percentage of Freedom of Information enquiries replied to within 20 days
Average time waiting to be seen at the contact centre (in minutes)
Customer contact centre telephone call response rate (in seconds)
Number of visits to the corporate website
Number of unique visitors to the corporate website per quarter
Average time on corporate website
Customer satisfaction with corporate website experience
Number of online corporate website forms completed
Website bounce rate
Percentage of all payment transactions that are digital
Customer satisfaction with online transactions
17About our District 90+ - Male• canterbury
c::::::JFema le - canterburv
85
The following information has been extracted from the council’s -- Male- U.K
Community and Customer Profile (November 2015). This document -- Female - U.K
80
brings together key statistics and information about the People who live
75
in our district, the physical characteristics of the district in terms of Place
and the local economy in Prosperity. The report highlights the issues in 70
the district that need to be tackled and the Corporate Plan has been
shaped and informed by this information. Many of these issues are 65
beyond the direct control of the council, however it is important that 60
monitoring continues to understand the changing needs of the district
and contribute to tackling these issues where we can. The data from the 55
profile has also helped to identify the people and groups that are most in
so
need, these are shown below as target groups. Click here to view the full
version of the Canterbury District Customer and Community Profile.
People 40
The Canterbury district has a population of 157,600 which is the second 35
highest population of the districts in Kent (Maidstone has the highest)
and the population is forecast to reach 182,000 by 2033. The following 30
diagram shows that the structure of the population is unusual in that
25
Canterbury has a significantly higher number of 20 to 24 year olds
reflecting its large student population consisting 31,464 students studying 20
at three universities in the city. Compared to the rest of England, the
15
district has fewer people in their 30s, 40s, and 50s but a higher
proportion of people over the age of 65 living in the district. In 2013 10
about one in five residents were over 65; this is estimated to increase to
one in four by 2031. The district has a negative natural change rate, with 5
more people dying than being born. This means that the continued 0
increase in the population is due to migration into the district. 2.00% 1.50% 1.00% 0.50% 0.00% 0.50% 1.00% 1.50% 2.00%
Percenta ge of Population
18If there were only 100 people to reflect the makeup of the district:
80 would live in urban areas and towns whilst twenty would live in rural areas
20 would be aged 16 to 24 and 20 would be 65 or older
18 would consider themselves to have a limiting long-term illness
Five would claim Disability Living Allowance or Attendance Allowance
Eight would be from black and minority ethnic groups
73 would consider themselves Christian whilst 29 would have no religion
Target Groups
We have identified groups of people who will, in some cases, need specifically targeted services, or services which are adapted so that they are
able to benefit from them. Some of this activity is set out in our aims 2 and 3, above.
Vulnerable adults and children - those who may be homeless; experience abuse; have mental or physical health problems; be experiencing
isolation; or be misusing drugs and alcohol
Deprived communities - where there are generally higher rates of offending, school exclusion, obesity, crime and anti-social behaviour.
Rural areas - where there is increased isolation with restricted access to services and the internet.
19A summary of the key issues to be tackled relating to the People theme as of November 2015 is set out in the diagram below
73% of over 65s have access
31% of pensioners to the internet compared to
live alone = 9,000 Older people 97% for all other age groups
people
5.2% of residents in bad/very bad
health (higher than average in SE).
Loneliness Digital Exclusion 8% of which live in West Bay
Dementia estimated 2,145
38% of over 55s (2011) increasing to 2,375
experienced a fall.
59% of falls
Falls Health in 2015.
Highest in Kent
happen in the
home (compared 9,060 residents claim Disability Living Allowance or Attendance
to 54% in Kent Allowance due to a physical disability
area)
People Higher rate of alcohol
admissions for women
Low rate of mothers initiating Under 18s - Higher rate of
76% increase in Citizen Advice Bureau number
breast feeding alcohol and drug related
Food Bank use of enquiries: 8,438, 26% about
Higher % of women smoking in admissions
(from 1966 in Rising Debt
pregnancy
2013 to 3,500 in
2014)
Pockets of deprivation in Barton,
Debt Health Gorrell, Greenhill, Heron,
13:1
Northgate and Wincheap are in
Lower quartile
bottom 20% most deprived in
house price ratio
to lower quartile Housing Deprivation England
annual earnings
Affordability
In Kent – children living in poverty come
20% of housing is rented in the private sector. from working families.
Three bedroom house: Younger People Class of 30: Five children in poverty, 2.5
Average market rent = £229pw, the Local Housing would be from a working family
Allowance = £178pw leaving a gap of £50pw
and familiesPlaces
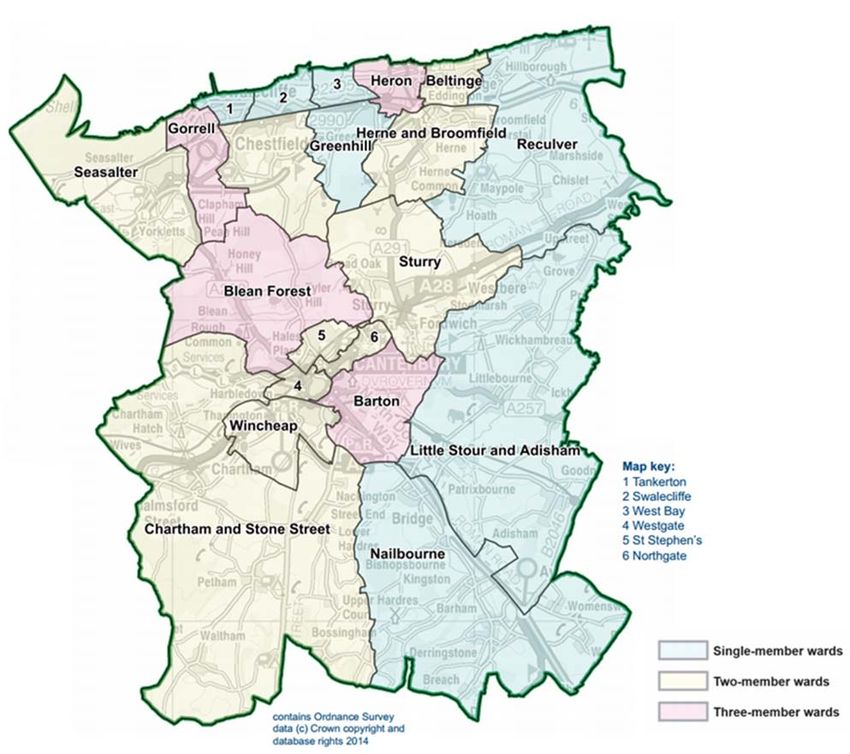
The Canterbury district covers an area of 30,885 hectares; the district has
three main residential centres, Canterbury city, Whitstable and Herne
Bay, as well large rural area consisting of 41 villages. There are 21
electoral wards represented by 39 councillors.
The city of Canterbury has a rich history and this is recognised through its
UNESCO World Heritage Site status which includes Canterbury Cathedral,
St Augustine’s Abbey and St Martin’s Church. There are also over 3,600
listed buildings and more than 50 Scheduled Ancient Monuments. The
District has a rich natural environment with 21.6km of coastline and a
diverse landscape including the Blean Woodland, the Stour valley and the
Kent Downs Area of Outstanding Natural Beauty which makes up one
third of the district.
Canterbury is known as a university city with nationally recognised
universities and further education establishments
The district has ten areas (Lower Super Output Areas) that are classified
as amongst the 20% most deprived areas in the country. These pockets of
deprivation are in Wincheap (1), Northgate (2), Barton (1), Seasalter (1), Map key:
1 Tankerton
Gorrell (1), Greenhill (1) and Heron (3). 2 Swalecliffe
3West8ay
4 Westgate
5 St Stephen 's
6 NOtlhgate
L Singl e-member wards
C Two-member wards
C Three-member wards
Canterbury District – May 2015 Ward Boundaries
21A summary of the key issues to be tackled relating to the Places theme as of November 2015 is set out in the diagram below
15 SSSIs Built and natural 3,686 listed and locally
49 Local Wildlife sites of county listed buildings
importance and environment 96 conservation areas
14 miles of coastline
Natural assets Heritage
th
12 most likely to Housing
flood out of 317
Flooding
Local Authorities Tackling empty
16,000 private sector homes, estimated
properties do not meet the over 1,000
Projections to 2050 Decent Homes Standard
Summers 2.8°C warmer
Winters 2.0°C warmer
Places
Winter rainfall up 14%
High recycling rates (over
Summer rainfall down 24%
50%)
Below average
energy consumption
Climate change Waste
compared to
national average
Highest rate of people
Clean Transport travelling to work by
foot/cycle in Kent
Air pollution Canterbury
has an air quality Figures show usage of
management area Impact on the public transport 15% increase in car
increasing (bus & train) ownership 2001 to
environment 2011
22Prosperity
Canterbury district has a unique position within the area as the economic centre for East Kent. The local economy has several important sectors which are
all interlinked and support each other; these include retailing, hotels, catering, health and education sectors. However, the reliance on these sectors
coupled with the under-representation of sectors such as manufacturing, business and financial services means that the district supports many part-time
and lower paid jobs.
With four universities in Canterbury a significant number of jobs are in the education sector. The University of Kent is the district’s top employer providing
5.4% of employment. Canterbury Christ Church University (2.7%), Canterbury College (1.1%) and The King’s School (1.0%) are also major employers and the
University of Kent Student Union also makes the top 10 with 0.7% of jobs.
The estimated economic impact of the University of Kent and Canterbury Christ Church University is over £1.1 billion per annum. This is estimated as
£571.7 million from the University of Kent and a further £539.1 million through Canterbury Christ Church University.
There is also a reliance on other public sector employers, such as East Kent Hospitals, University NHS Foundation Trust, Kent Police and Canterbury City
Council, which combined account for 5.4% of jobs in the district. Kent County Council also employ around 850 people in the district as well as over 2,100
people working in state schools in the district (not including academies).
Wages for people who are resident in the Canterbury district are comparatively much better than the wages for people who work in the district, with an
average weekly wage of £429.50 (up 13.9% since 2009), £72.70 higher than people who work in the district. This gap is the third highest in Kent and has
increased by 277% since 2009, when it was the third lowest gap in Kent. Since 2009, people working in the district have seen their wages fall by 0.3%, whilst
district residents have seen a 13.9% increase in wages suggesting that people are travelling to work outside the district in order to find better paid work.
23A summary of the key issues to be tackled relating to the Prosperity theme as of November 2015 is set out in the diagram below:
Third lowest workers wage in Kent Employment Between 2009 to 2013 shift of nearly 1,500
£356.80 per week employees from full time to part time work
Low wages Part time
277% increase in the
wage gap (over five
years) between Wage gap Commuting
residents and
workers Net influx of workers – 1,175 more
people employed than residents who
work which suggests they commute into
the district
Prosperity
The district’s business survival
rate is better than Kent/UK.
96% survival rate for first year
Marlowe – £77m Impact of
Festivals - £2.7m
Tourism - £358m Culture/Tourism New businesses
University of Kent and Impact of Knowledge
Canterbury
Christchurch add Universities Economy
£1.1 billion to the
economy Still reliance on public sector, education and
Businesses retail business Growth (up 15.4% from 2011 to
2012) in information and communications but this
is still less than 2000 jobs
24This information is also available in other formats including Braille, large print, audiotape and other languages. Please phone Lorna Ford on 01227 862 068 or email lorna.ford@canterbury.gov.uk. For more information contact Lorna Ford on 01227 862 068 or 01227 862 000 email lorna.ford@canterbury.gov.uk or visit our website www.canterbury.gov.uk/corporateplan
You can also read