Analyzing Traffic Violations through e-challan System in Metropolitan Cities (Workshop Paper)
←
→
Page content transcription
If your browser does not render page correctly, please read the page content below
Analyzing Traffic Violations through e-challan System in Metropolitan Cities
                                    (Workshop Paper)

                        Ritwik Mishra∗ ,                                   Aanshul Sadaria∗ , Shashank Srikanth∗ ,
                   Ponnurangam Kumaraguru,                                  Kanay Gupta∗ , Himanshu Bhatia∗ ,
                               and                                                    and Pratik Jain∗
                        Rajiv Ratn Shah                                                IIIT, Hyderabad
                           IIIT, Delhi                               {aanshul.sadaria@students, shashank.s@research,
               {ritwikm, pk, rajivratn}@iiitd.ac.in                  kanay.gupta@students, himanshu.bhatia@students,
          ∗ These authors contributed equally to work
                                                                               pratik.jain@students}.iiit.ac.in

   Abstract—Given that India is now moving towards auto-
mated solutions to curb traffic violations and road accidents, we
focus our efforts on characterizing these violations in Indian
cities. In this work, we present our characterization of the
traffic violations via an Automated e-challan (electronic traffic-
violation receipt) issuance system of Ahmedabad and New
Delhi. To explore this, we collected an exhaustive dataset of
over 6 million e-challans. Characterizing the fine payment
behavior, we find that 57% of unique vehicles in Ahmedabad
are involved in repeat offenses. The temporal analysis shows a               Figure 1: A sample e-challan in Ahmedabad.
significant difference in e-challans issued during the festivals.
Spatially, different violation types are distributed differently
with the existence of certain unique hotspots. Finally, we also       through SMS [5].
demonstrate how e-challans can act as a proxy measure to                 We curate a dataset of e-challans from the traffic-violations-
analyze the efficacy of the Motor Vehicles (Amendment) Act            portal of two metropolitan cities of India: Delhi and Ahmed-
2019. Our work suggests that high penalties may not have a
                                                                      abad since their e-challan portals directly respond to HTTP
long term impact on decreasing traffic violations.
                                                                      requests. Moreover, both are tier-1 cities in terms of house
   Keywords-big data; traffic violations; e-challan; transport        rental allowance [8] and population [9]. The Ahmedabad
systems; state policy; surveillance;
                                                                      traffic police launched their second leg of automated traffic
                                                                      management system in April 2018, and it leverages a network
                      I. I NTRODUCTION                                of 1,300 video surveillance cameras installed across 87 traffic
   In 2004, fatal injuries from road accidents were predicted         junctions [10]. Delhi traffic police launched their intelligent
to become the third leading cause of death by the end of              traffic management measures in 2016. It included HD CCTV
2020, and the trend shows that middle-income developing               cameras in eminent locations, 50 cameras mounted on traffic
countries (like India) are going to get the hardest hit [1, 2].       police vehicles, and 200 body-worn cameras for traffic
At the beginning of 2020, road accidents accounted for the            constables [11]. Figure 1 shows an example of an e-challan
most number of deaths in the world, among the age group               generated in Ahmedabad. An e-challan consists of several
of 5 to 29 years old, with more than 90% of the mortalities           details of a given traffic violation like the date/time, place
coming from low- and middle-income countries [3].                     of violation, violation type, and corresponding fine amount.
   Previous research in the field of behavior studies regarding          In this paper, we carry out a detailed study of traffic
traffic rule violations has shown that in more than 70%               violations in the cities of Ahmedabad and Delhi. Our analysis
cases, the role of human behavior is one of the causes [4].           would be particularly useful for the government and other
Most of these accidents can be prevented if the traffic rules         law enforcement agencies such as police, who are responsible
are properly followed. In India, the traffic police across            for making the roads safer for citizens. Unlike some earlier
states have started adopting the automated traffic management         works [12, 13] that focused on road accident data, we focus
systems to promote adherence to traffic rules [5]–[7]. Such           only on traffic violations.
automated systems vary in their functioning and usage across
the states. Some systems are capable of tasks like capturing          A. Research Questions
violations and issuance of e-challan without any human                   The existence of large scale digital data such as traffic
intervention. At the same time, others can also generate              violations in a city can be utilized to derive a lot of
e-challans along with photo evidence and send it to violators         information and characterize such violations in detail. Law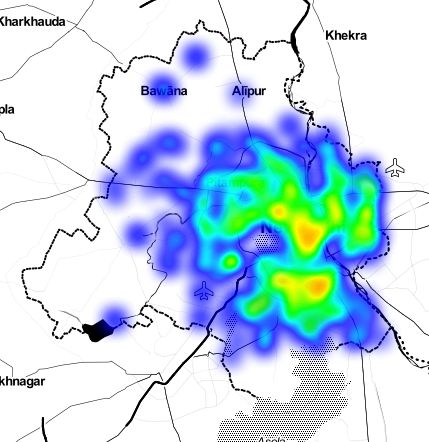
Description                   Ahmedabad     Delhi
enforcement agencies can get valuable insights from the                  Number of e-challans          2,628,116     1,238,144
distribution of violation types in a city. Moreover, an analysis         Number of paid e-challans     896,140       NA
of user behavior towards paying a violation penalty could                Number of unpaid e-challans   1,731,976     NA
                                                                         Number of unique vehicles     931,338       548,233
be useful in drafting future legislation. Thus, we address our           Total amount owed             588,756,200   NA
first research question:                                                 Total amount paid             185,684,000   NA
   RQ1: How can e-challan data be used to characterize                   Total amount unpaid           403,072,200   282,664,000
                                                                         Number of violations          18            29
the distribution of traffic violations and e-challan payment             Number of locations           111           54,335
patterns as well?                                                        Number of denominations       12            6
   We are also interested in analyzing the spatial and temporal
patterns in traffic violations across cities. It can help in        Table I: A brief description of the e-challans collected in the
designing more robust and effective intervention measures           first phase
for traffic regulatory bodies. For example, the variation of
traffic violations across different areas and localities would
allow law enforcement agencies and policymakers to design           et al. [16] analyze the road accident data across India at a
more violation-specific intervention measures for each region.      national, state, and metropolitan city level and show that
Similarly, the temporal patterns in traffic violations across the   the distribution of road accident deaths and injuries varies
days of the year can be used to deploy surveillance resources       according to age, gender, month and time. It has also been
effectively. We thus, address:                                      shown that more than 50% of the cities face higher fatality
   RQ2: What are the spatial and temporal patterns in               risks as compared to their rural counterparts. Iglesias et
traffic violations across the cities being studied?                 al. [17] explored the relationship between anger and traffic
   Finally, we are interested in understanding how such data        violations to characterize men as a more prone gender to
can be used to understand public compliance and making              commit a traffic violation. Jayatilleke et al. [18] showed the
informed policy decisions. Thus, we show a possible appli-          negative correlation between traffic fines and traffic violations
cation of our dataset for measuring the people’s conformity         along with fatal road accidents. Leekha et al. [19] indicated
to certain policies such as the Motor Vehicles (Amendment)          that attentiveness of a driver can be inferred from their posture
Act 2019 [14] through the number of traffic violations. Thus,       on the driving seat.
we address the following research question:                            Another set of approaches to model road accidents involve
   RQ3: Can traffic violations data in the form of E-               identifying road accident hotspots using GIS (Geographical
Challans serve as a proxy for measuring the effectiveness of        Information System) technologies. Choudhary et al. [12]
government regulations?                                             geocoded 5 years of road accident locations over the digital
                                                                    map of Varanasi and clustered accidents using a spatial
B. Contributions                                                    heatmap. Qiqi et al. [20] demonstrated that traffic violations
   We describe a method to collect e-challans from traffic          amongst bus drivers are associated with the date, weather,
regulatory portals and present relevant insights from a large-      and presence of traffic cameras at bus stations. Analysis
scale dataset of 6 million e-challans, that were issued in Delhi    done by Qiqi et al. [20] is the most similar to our work, but
and Ahmedabad. For spatial analysis, 98% of the e-challans          their analysis was limited to buses only. Unlike the previous
are geotagged with the corresponding latitude and longitude         works which focus mainly on correlating user behavior with
of their offense location.                                          road accidents and traffic violation, our work investigates the
                                                                    effect of government policies on these violations and also
C. Privacy and Ethics                                               suggests measures that can help manage traffic and ensure
   We collect data from Ahmedabad and Delhi traffic police’s        order.
e-challan portal for research purposes only. Additionally, we          Spatio-temporal analysis: A lot of research has been
do not use any personally identifiable information in our           done on the spatial and temporal patterns in social media
analysis.                                                           such as Twitter, Foursquare, and Snapchat [21]. For example,
                                                                    Lamba et al. [22] find that for most cities, distracted driving
                    II. R ELATED W ORK                              content posted on Snapchat is geographically concentrated
   We structure the discussion of related work into two main        to a few locations of the city. Several studies have also
themes: related work on road accidents and work concerning          performed temporal analysis on social media websites by
the spatial and temporal analysis of traffic accidents and          analyzing posting behavior amongst Snapchat users [23]
social media data.                                                  and Twitter users [24]. We aim to use similar techniques
   Traffic Accidents and Violations: Traffic accidents ac-          to analyze traffic violations and gain unique insights. Some
count for more than a million deaths each year across the           works have also studied spatio-temporal patterns in traffic
world, according to WHO [15], and a lot of research has             accidents across cities in the world. F. Jegede analyzed road
been conducted on data concerning road accidents. Sanjay            traffic accidents in Oyo State, Nigeria, and identified six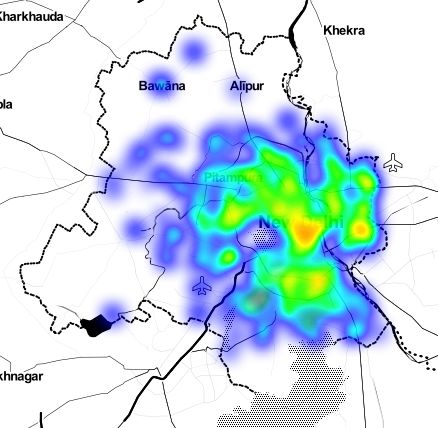
Ahmedabad Delhi
traffic zones (Black Spots) that required special attention Violation Type # e-challans Violation Type # e-challans
by any road safety programs or law enforcement agencies Red light 2,535,623 Red light 532,441
[25]. Similar studies on spatio-temporal analysis of accidents Stop line 49,660 Over speed 321,239
Improper parking 27,167 Improper Parking 184,349
have also been done in India [26], the Czech Republic [27], Driving in BRTS 4,348 Stop line 117,774
and other countries. Unlike the previous works, which deal Wrong lane 3,725 No Helmet 40,343
mostly with traffic accidents or social media data, our work Total violation 2,628,116 Total Violation 1,238,144
deals with the spatio-temporal patterns in traffic violations. Table II: Top 5 violations in Ahmedabad and Delhi
III. DATASET COLLECTION AND DESCRIPTION
For this work, we collect traffic violation receipts (e-
challan) from the e-challan portal of Ahmedabad traffic e-challans for all the unique vehicles from the first phase.
police1 and Delhi traffic police2 . Only those e-challans were taken into consideration that were
issued after the act was implemented i.e., 1st September 2019.
A. Data collection For Delhi, e-challans as far as 6th June 2020 are collected in
We pinged the e-challan portal with vehicle number in the the second phase, whereas for Ahmedabad the end date was
body of POST requests to obtain the e-challan of the given 13th July 2020. This marks the end of the second phase of
vehicle number. This is in contrast to various other cities data collection. All the analysis before section 6 is done on the
like Hyderabad, Mumbai, etc., where filling a Captcha or data collected in the first phase because MVA significantly
login credentials is mandatory. changed the patterns in traffic violations after its launch
For the city of Ahmedabad, a typical vehicle number has date. Therefore we believe that data collected in the second
the following format (without hyphens): GJ-R-XX-dddd, phase cannot be used to analyze the general trends in traffic
where GJ is the code for Gujarat state, R ∈ {01,27} is the violations.
code for one of the two RTOs in Ahmedabad city, X ∈
{’A’,’B’,...,’Z’}, and d ∈ {0-9}. To ping the e-challan portal,
we used all the possible combinations of vehicle numbers
i.e. 2 × 26 × 26 × 104 (≈10m) possible combinations.
In the case of Delhi, possible combinations of vehicle
numbers are nearly 1 billion. Since it is not feasible to
check all possible combinations of vehicle numbers, we
begin enumerating in a lexicographic manner and pruned our
search space by breaking the loop when we find no e-challan
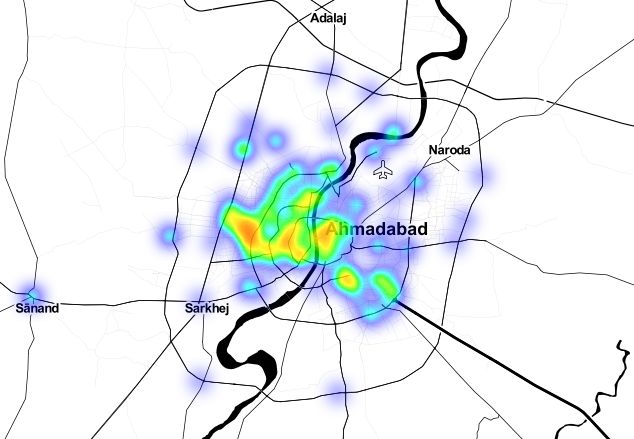
in any of the 10,000 previously searched vehicle numbers. Figure 2: Heatmaps for Improper Parking (left) and Red
For example, if we find no e-challans in the range Light Violation (right) in Ahmedabad.
DL1-CHA-0000 - DL1-CHA-9999, then we stop querying
for vehicles with vehicle number DL1-CXX-XXXX onwards.
We observed that once an entire series of vehicle number do
not yield any e-challan, no e-challan is seen further in the B. Dataset description
subsequent series i.e. DL1-CHB-0000 - DL1-CZZ-9999. The final dataset, for Delhi and Ahmedabad, contains a
Therefore, we believe that it is safe to assume that vehicles total of over 6 million e-challans. For each unique e-challan
further in this series have not been registered yet. in our dataset, we have five major attributes - (i) Date/Time
In this fashion, we checked 4 million combinations of of the violation, (ii) Location of the violation, (iii) Type
vehicle numbers when the total number of valid vehicles of violation, (iv) Fine amount, (v) Paid or unpaid e-challan
(registered after 2005) on the roads of Delhi is 6 million (only in case of Ahmedabad). In the final dataset, the total
[28, 29]. Thus, while the dataset collected in the case of unpaid amount from e-challans tallies to 4 billion INR.
Ahmedabad can be assumed to be complete, it cannot be
Though the data collected in both these cities are similar in
claimed for Delhi.
most aspects, they differ in certain attributes. In Ahmedabad,
In the first phase of data collection, we collected over
we have access to both paid and unpaid e-challan for each
3 million e-challans from 15 April 2018 (launch date of
vehicle, unlike Delhi where the portal deletes paid e-challan
Ahmedabad automated traffic management system) to 31
in some time. There is a difference in the granularity of
August 2019. Table I provides a quantitative description
temporal data in both the datasets with e-challans in Delhi
of our dataset from first phase. For analysis of The Motor
containing the exact timestamp of the violation. In contrast,
Vehicles (Amendment) Act 2019 (MVA), we again collected
e-challans in Ahmedabad contain only the date of violation.
1 https://payahmedabadechallan.org The nomenclature of Delhi vehicle numbers contains the type
2 https://delhitrafficpolice.nic.in/notice/pay-notice/ of vehicle as well. For example, DL9CA1234 is vehicle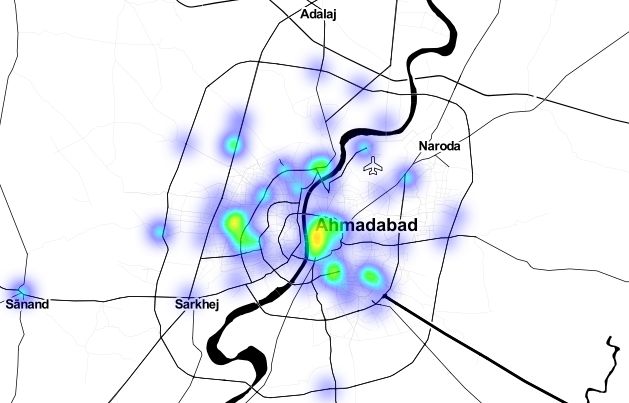
number of a car registered in RTO number 9 (Dwarka)3 .            violations in both cities account for 68.94% and 98.37%
Such nomenclature is not available in Ahmedabad vehicle           of all the e-challans issued in the city respectively. Thus,
numbers. Since there are a lot of dissimilarities in the data     specific targeted measures can be taken to reduce the number
of both the cities, a standardized way of reporting traffic       of such violations committed compared to general measures
violations in e-challan traffic portals would benefit further     that target all violations equally. We also analyze the violation
research in this domain.                                          types from a spatial perspective, as shown in Figure 2. From
                                                                  Figure 2, we can see that the hot-spots of different violation
C. Data Preprocessing for Geocoding
                                                                  type varies according to the location. Furthermore, the Red
   Due to the presence of multiple cameras in a single location   Light Violations are more concentrated in West Ahmedabad
of Ahmedabad, two cameras may have the same geographical          as compared to Improper Parking, which are scattered in few
location but a different name in the location field of the e-     regions across the city. The implication of the above analysis
challan. Thus, we cleaned the data by updating the location       is that the location of a violation type is a specific function
field of all e-challans to a specific geographic location to      of that violation type and is likely to be clustered in certain
perform the spatial analysis. In Delhi, the number of unique      regions of the city.
locations was above 50 thousand. The location description
contained spelling variations, abbreviations, and unwanted
                                                                  B. E-Challan Payments
details. For example, one such description was ‘COD ring
road. Towards Naraina eating kachori by causing traffic              We analyze the payment behavior for the city of Ahmed-
obstruction’. Central locations were extracted by checking        abad only due to the unavailability of the payment status in
noun entities in an exhaustive (curated) list of known places     the Delhi e-challan dataset. From Table I, the ratio of unpaid
in Delhi. After the cleaning process, 98% of e-challans in        to paid e-challans is calculated to be 1.93, and the ratio of fine
the final dataset were successfully geotagged.                    amounts of unpaid to paid e-challans is 2.17. This suggests
                                                                  that the majority of paid e-challans consist of lower fine
                                                                  amounts as the fine payment ratio is 1.12 times the issued
                                                                  e-challans ratio. We further analyze the distribution of paid
                                                                  e-challans ratio with respect to the e-challan fine amount and
                                                                  found that 34.11% fines with denominations less than 1000
                                                                  INR are paid whereas 18.91% fines are paid of those more
                                                                  than 1000 INR. This shows that the fine amount is likely to
                                                                  affect the payment behavior of users in Ahmedabad. However,
                                                                  we find that the e-challans of overspeeding violations have a
                                                                  drastically higher ratio (0.62) of paid e-challans compared
                                                                  to 0.17 for BRTs lane violations where their average fine
                                                                  amount is 1017.8 INR and 1251.2 INR respectively, which
                                                                  is relatively similar.
Figure 3: Percentage of unique vehicles with given number
of e-challan receipts.                                            C. Repeat violations
                                                                     Identifying repeat violations and its prevalence across cities
 IV. C HARACTERIZING TRAFFIC VIOLATIONS AND FINE                  will be useful for law enforcement agencies. In Figure 3,
                                 PAYMENTS                         we show the percentage distribution of unique vehicles in
                                                                  our dataset for the number of e-challans issued to each one
   In this section, we characterize the different types of
                                                                  of them. From the plot, it is clear that a significant portion
violations and incidents of repeated violations in the two
                                                                  of the unique vehicles has more than 1 violations (57% in
cities. We also analyze the trends and patterns in fine
                                                                  Ahmedabad and 42% in Delhi). We further computed that
payments for the city of Ahmedabad. We restrict the latter
                                                                  the median number of e-challans issued to all the users was
analysis to Ahmedabad, as the dataset of Delhi e-challans
                                                                  2 and 1 for Ahmedabad and Delhi, respectively. Thus, we
does not consist of both paid and unpaid e-challans.
                                                                  notice a city-wise difference wherein a vehicle is more likely
A. Distribution of violation types                                to be involved in repeat offenses in Ahmedabad as compared
  The number of e-challans issued for the top 5 most              to Delhi. We also find that there are vehicles with more
common violation types in Ahmedabad and Delhi is presented        than 100 e-challans issued in both Ahmedabad and Delhi.
in Table II. We can infer from Table II that the top 2            This suggests that many of them might not be aware of the
                                                                  e-challans being issued to them or simply decline to pay up
  3 https://www.policybazaar.com/rto-delhi/                       until required.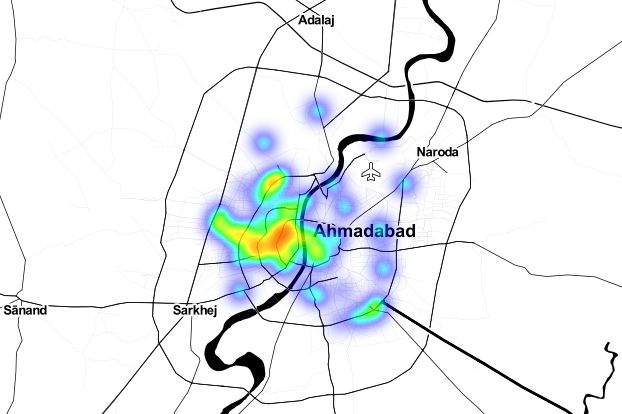
(a) Ahmedabad (2018)          (b) Ahmedabad (2019)               (c) Delhi (2018)                (c) Delhi (2019)
                      Figure 4: Heatmaps for year 2018 (a,c) and 2019 (b,d) in our e-challan dataset.

      V. C HARACTERIZING T EMPORAL AND S PATIAL                        These insights can be used to take targeted intervention
                           PATTERNS                                    measures for different regions of the city.
   In this section, we characterize the spatial and temporal           B. Temporal Analysis
patterns in the datasets. Spatial analysis is useful for under-
standing the presence of geographical clusters that account for           Temporal analysis of the data allows us to find patterns
most traffic violations. On the other hand, temporal analysis          about the occurrence of traffic violations with respect to time.
allows us to analyze the general trends in the occurrence of           Figure 5 shows the distribution of all the e-challans issued
traffic violations and when it is more prevalent.                      during the period of the first phase of data collection in both
                                                                       the cities. We analyze the plots to see if there are any spikes
A. Spatial analysis                                                    around the festival days. In general, there is a steep drop or
  We use spatial analysis to investigate the presence of               increase in the number of e-challans issued during festival
certain hotspots where traffic violations are more likely to           days for Ahmedabad. We observe that 2 − 3 days before
occur. In Table III, we show that for Ahmedabad, the top               Rath Yatra (Chariot Procession) - July 14, 2018, and July
5 locations (in terms of the number of e-challans issued)              4, 2019 - the number of e-challans issued is zero as the
account for approximately 32% of all the e-challans collected          police personnel was on security duty. This suggestion is
for the city. However, in Delhi’s case, the top 5 locations            further strengthened by another observation that during a few
contribute to only 13% of Delhi’s e-challan data. Delhi being          other festivals like Muharram, Eid-ul-Fitr, and Diwali, there
a larger city than Ahmedabad, has a wider spread of e-                 is a dip in the number of e-challans issued. However, on
challans, which is also captured by the numbers mentioned.             some other popular festivals in Ahmedabad, such as Navratri,
  Shyamal region of Ahmedabad and JNU to Neela Hauz                    Rakshabandhan, Janmashtmi, and Ganesh Chaturthi, there
road of Delhi have the most number of e-challans in our                is a notable rise in the number of e-challans issued. This is
datasets and by itself accounted for approximately 8% and              because there is a higher rush of vehicles due to gatherings,
4% of all the e-challans in the respective datasets. Thus, the         and people are prone to be less sensitive towards traffic rules.
data reveals that most traffic violations are concentrated in             The highest number of e-challans (16,500) issued on a
only a few regions of the city.                                        single day in our dataset for Ahmedabad was on January 13,
  We can infer from Figure 4 that traffic violations are               2019, a day before Makar Sakranti, one of the most widely
concentrated in a few regions across Ahmedabad whereas, for            celebrated festivals in Ahmedabad. The underlying trend
Delhi, it is much distributed across the city. One explanation         of the high number of e-challans issued a few days before
for this observation could be since Delhi has a much                   certain festivals continues during the day of the festival as
longer road-length per vehicle (2.8 meters) as compared                well. Similar trends were observed for the city of Delhi as
to Ahmedabad (0.5 meters) [30]. Most of the violations                 well. On 15th August (Independence Day) 2018, the drop in
occurred in the central regions of the Ahmedabad and were              traffic violations was highest (85%) compared to the previous
more concentrated on the left side of the Sabarmati river.             day. Subsequently, 16th August 2018 witnessed the sharpest

                                   Ahmedabad                                            Delhi
                   Location            Number of e-challans   Location                            Number of e-challans
                   Shyamal             213,491                JNU to Neela Hauz Near IIMC         52,043
                   Sashtrinagar        160,375                Sarai Kale Khan From ITO Straight   48,036
                   Sardarpatelstatue   159,762                Mayapuri From Kriti Nagar           23,326
                   Nfd                 155,883                Moolchand From Dhaulakuan           22,214
                   Girish colddrinks 150,537                  Andrews Ganj From JLN Stadium       21,584
                   Total Violations    2,628,116              Total Violations                    1,238,144

                                        Table III: Distribution of e-challans with location.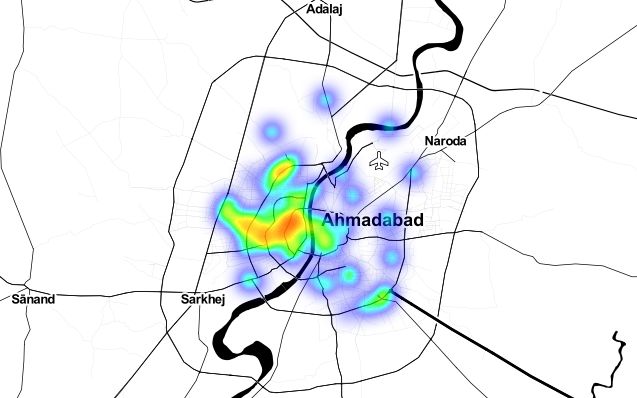
Figure 5: Time series plot of all the e-challans in our dataset for both the cities

increase (850%) in the number of fines. On Diwali, we see a        inside the city. Insights from such trends would benefit
similar drop in Delhi as well as in Ahmedabad. This shows          the traffic police to adopt specialized measures for some
that both cities show similar behavior around festivals, which     violations or vehicle types. Moreover, e-challans could also
can then be used to resource traffic personnel better.             serve as an (indirect) indication to measure the effectiveness
   Another trend that can be discerned from Figure 5 is            of some government regulations, which directly affects the
that the number of e-challans is continuously increasing           flow of traffic in a city.
with time in Delhi whereas in Ahmedabad, the maximum
number of e-challans issued during early 2019 after which it                      VI. E-C HALLANS AS A PROXY
starts to decrease. This shows that there have been concrete
                                                                      Several studies in the past have used traffic violation data
efforts from the Delhi traffic department to effectively use
                                                                   as a proxy for traffic crashes [31, 32]. In this section, we try to
this system and capture more violations through the system.
                                                                   answer if the traffic violations data in the form of e-challans
   Due to the availability of the exact time of violation in the   can serve as a simplistic proxy for measuring government
Delhi dataset, we analyze the temporal trends with respect         regulations’ effectiveness. Specifically, we look at the effect
to the hour of the day in Figure 6(a) and Figure 6(b). From        on the main government regulation on traffic violations i.e.,
Figure 6(a), we observe an increasing trend in the number of       The Motor Vehicles (Amendment) Act 2019 [14]. Since we
violations during the morning hours of 7 am to 10 am, which        intend to assess the impact of MVA, subsequent analysis
gradually decreases till noon and then again starts rising to      takes into account the same vehicles that committed traffic
attain maxima at 5 pm. The violations reduce drastically after     violation before the implementation of MVA, as explained
7 pm. Hence, most of the traffic violations are committed          in second phase of data collection in section III.
from 7 am to 7 pm of the day. We also plot the hourly trends          Threats to validity: Evaluating the effect of any one
of stop-line violations in Figure 6(b) for two-wheelers and        decision or regulation on complex matters such as societal
private cars. We can see that during peak traffic hours i.e., 10   issues is a complex issue as multiple competing explanations
am - 12 pm and 5 pm - 7 pm, the percentage of two-wheelers         could be provided for a given observation. Moreover, like
is higher. This could be because it is relatively easy for a       any other dataset, even a dataset consisting of e-challans
two-wheeler (like scooter or motorbike) to navigate through        could be prone to implicit and explicit biases. The results
the traffic and break the queues during peak hours. We posit       described below should not be used in isolation to evaluate
that this insight would be useful for the law enforcement          the effectiveness of regulations. However, they should be part
agencies as they can pay special attention to two-wheelers         of a set of holistic measures that take into account several
during these times compared to the other times of the day.         other societal and correlated data. With this analysis, we only
  In summary, spatial-temporal trends in the traffic violations    show a possible application of similar data for the evaluation
of a city could give relevant insights into the flow of traffic    of such policies or regulations.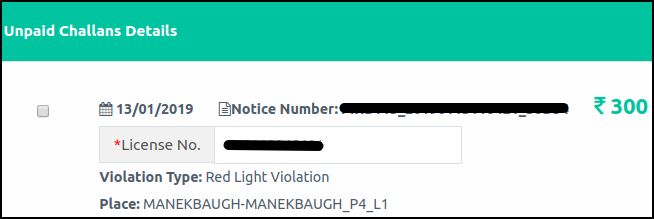
(a)                                                          (b)
Figure 6: (a) Hourly trends of committing traffic violations and (b) Hourly trends of committing stop-line violations, in Delhi.

A. Effects of The Motor Vehicles(Amendment) Act 2019 on           e-challans in the month of November 2019 for the city of
   e-challans                                                     Ahmedabad. Hence, for the sake of uniform comparison,
                                                                  e-challans between July and October (both inclusive) are
   The recent amendments to the Motor Vehicle Act in 2019
                                                                  taken into account to study the effect of the act. After the
have enhanced the penalties for several traffic violations
                                                                  implementation, September had higher average e-challans
[14]. In some cases, the penalties have even doubled or
                                                                  compared to any other month. News reports suggest that
quadrupled, depending on the type of violations. Assuming
                                                                  traffic penalties in Ahmedabad were not raised as much as
strict and uniform implementation, we try to understand if
                                                                  this act was supposed to raise [33]. On comparing these
the increase in awareness about violations, coupled with the
                                                                  numbers with respect to Delhi, we can say that the impact of
increased fines, caused any significant change in the number
                                                                  the act in Delhi was immediate but not long-lasting, whereas
of e-challans issued.
                                                                  the effect persisted in Ahmedabad but took time to take
   In Delhi and Ahmedabad, the new Motor Vehicles Act
                                                                  effect. It corroborates the findings of [34, 35], which claims
was implemented on 1st September 2019. As compared to
                                                                  that raising the penalty amount for a traffic violation doesn’t
August of 2019, Delhi data shows 45% decrease in average
                                                                  necessarily decrease the violation frequency in the long run.
e-challans that were issued in September as seen in Table IV.
This is contrary to the data of 2018, where September saw                         Month         Delhi   Ahmedabad
a 250% increase in average e-challans compared to August                          September     -45%    +14.89%
2018. Moreover, September 2019 witnessed negative growth                          October       -89%    -3.7%
                                                                                  November      -57%    NA
in the average number of e-challans issued per day (wrt
previous day) and became the only month in our dataset to         Table IV: Change in average number of e-challans with
have negative growth. The number of e-challans issued per         respect to August 2019
day fell till 2nd October 2019, and reached an all-time low
of 89 traffic e-challans issued in one day since 15th August         We further calculated average e-challans per day, in the
of 2018. Effect of the act was seen until November 2019,          window of 2 months, for top 100 violators (by the count of
where average e-challans per day decreased by 57%, but            issued e-challans) in our dataset and found that for Delhi,
the average growth rate in November climbed to 8% per             there was an average decrease of 64% whereas in Ahmedabad
day. After three months of the new act, December saw the          this was just 34%. This can be attributed to the fact that in
highest average e-challans per day in 2019. The first week        Delhi, the changes in fine amount [36] were more drastic
of January 2020 broke the record of average e-challans per        compared to Ahmedabad. This led to a greater effect on
day from December 2019.                                           Delhi people as they were bound to pay greater fines and
   For Ahmedabad, an unexpected 14.89% rise is seen in            thus resulted in a higher decrease. This was also supported
average e-challans in September with respect to August with       by the fact that for certain violation types for which fines
an average daily growth of 8.1% in September. The average         were increased manifolds like stop-line violation (increased
e-challans in October is 3.70% less with respect to August        10 times), there was a decrease of 58% in Delhi whereas,
and 16.18% less with respect to September. Over a two             in Ahmedabad for red light violation (increased 4 times), a
month time-window before and after the implementation of          drop of 31% is observed.
the act, there was an average drop of 28.97%. We considered          For Ahmedabad, we analyze the ratio of paid to the total
a two month time-window due to the non availability of            e-challans before and after the act and found that this ratio
decreased for different violation types. The ratio reduced from presence of unique spatial and temporal clusters for different
0.34 to 0.14 and from 0.22 to 0.10 for red light violation violation types. We believe that these insights can be used
and improper parking, respectively. This tells us that more by law enforcement agencies to design targeted intervention
people used to pay their e-challans before the act, and there measures and awareness campaigns. Finally, we also show an
was a less significant drop in the number of e-challans than application of traffic violations, which act as a proxy measure,
Delhi due to the lesser increase in the fine amount. to measure the effectiveness of government regulations by
We also calculated the frequency in which e-challans are taking a case study of the Motor Vehicles (Amendment) Act
issued to the top 100 violators, again in a window of 2 2019. Our analysis shows that higher traffic fines have an
months before and after MVA i.e. from July to September immediate reducing effect on traffic violations, but the effect
and then from September to October. For these, we calculated need not be long-lasting.
the average time between two consecutive violations by
these vehicles. In the case of Ahmedabad, this average time ACKNOWLEDGMENT
increases from 8.81 days before MVA to 15.11 days after
Ritwik Mishra would like to express his gratitude towards
MVA. In Delhi, we found that before MVA, this number
University Grant Commission (UGC), India, as he is partly
was 3.78 days which increases to 5.25 days after the MVA
supported by the UGC Junior Research Fellowship (JRF)
was implemented. However, for December 2019 to the first
program.
week of 2020, the average time gap between consecutive
fines reduced to 1.36 days. Nevertheless, in the first two
R EFERENCES
months of implementation, we can see that the average time
between successive traffic violations by top-100 violators [1] M. Peden, “World report on road traffic injury prevention,”
in both cities increases. This signifies that, in the short-run, 2004, ch. 5.
MVA was effective in its purpose for both the cities. However,
the effects of the same might not be long-lasting and more [2] T. Anjuman, S. Hasanat-E-Rabbi, C. K. A. Siddiqui, and M. M.
Hoque, “Road traffic accident: A leading cause of the global
detailed study needs to be conducted on the same.
burden of public health injuries and fatalities,” in Proc. Int.
This result has several implications. It suggests that a Conf. Mech. Eng. Dhaka Bangladesh, 2020, pp. 29–31.
holistic approach involving increased enforcement, higher
fines and targeted intervention measures is required in order [3] WHO, “Road traffic injuries,” World Health Organization,
to decrease the number and frequency of traffic violations. 2020. [Online]. Available: is.gd/DVbwm1
For example, studies such as [37] have shown that in the
case of overspeeding violation, social marketing and public [4] D. Jha, S. Vibha, C. Tripathi, and G. Naveen, “Traffic rule
violation: A weak link in prevention of road traffic accidents,”
education are vital measures in reducing traffic injuries in Clin Surg. 2017; 2, vol. 1589.
addition to strict enforcement of speed limits. The variations
in the temporal and spatial patterns of different types of traffic [5] B. Standard, “Delhi traffic police launch e-challan and
violations as mentioned earlier can thus be utilized by the e-payment system,” Business Standard, 2019. [Online].
law enforcement agencies for social marketing in a targeted Available: is.gd/nrqOqz
manner. For example, the law enforcement agencies can put
up more educational billboards or speed limit traffic signs in [6] “Badnore inaugurates e-challan system for chandigarh,” The
Tribune, 2020. [Online]. Available: is.gd/3T7sjl
areas that have higher incidences of overspeeding. Moreover,
the system can be used to identify the egregious offenders [7] “Mumbai: Top cop launches e-challan system for traffic
and specific messages or reminders could be sent to them via violators,” The Indian Express, 2016. [Online]. Available:
mobiles or letters. Research suggests that timely reminders is.gd/mjx1tI
to pay fines help in reducing the violation frequency [38].
[8] D. of Expenditure, “Office memorandum,” Department of
VII. C ONCLUSION Expenditure, 2015. [Online]. Available: https://is.gd/y5aBvo
As time progresses, the number of vehicles on road in [9] G. of India, “Number of cities towns by city size class,”
addition to traffic violations in metropolitan cities of India Ministry of Housing and Urban Affairs, 2011. [Online].
rises. In this work, we propose a method to collect the Available: https://is.gd/oCasUt
electronic receipts traffic violations (e-challans) from the
Ahmedabad and Delhi traffic police portal. We collected over [10] DNA, “Watch out: E-challans for traffic violations are
6 million such e-challans and characterized the distribution of back in ahmedabad,” DNA India, 2018. [Online]. Available:
https://is.gd/l8uiOQ
various fine payment patterns and repeat offense of violations.
We observed that top-2 violations in a city account for [11] P. RELEASE, “Launch of intelligent traffic management
the majority of violations in the city. We further analyzed measures,” Delhi Traffic Police, 2016. [Online]. Available:
the data for spatial and temporal patterns and found the is.gd/L3GRA6[12] J. Choudhary, A. Ohri, and B. Kumar, “Identification of [27] M. Bíl, R. Andrášik, and J. Sedoník, “A detailed spatiotemporal
road accidents hot spots in varanasi using qgis,” Organized analysis of traffic crash hotspots,” Applied geography, vol. 107,
By Department of Civil Engineering, Indian Institute of pp. 82–90, 2019.
Technology (Banaras Hindu University), Varanasi-221005
Uttar Pradesh, India, p. 7, 2015. [28] “Statistics,” Delhi Traffic Police, 2019. [Online]. Available:
https://is.gd/BjbmhU
[13] H. Ren, Y. Song, J. Wang, Y. Hu, and J. Lei, “A deep learning
approach to the citywide traffic accident risk prediction,” in [29] “Details of petrol and diesel vehicles,” Delhi Transport
2018 21st International Conference on Intelligent Transporta- Department, 2008. [Online]. Available: https://is.gd/EzQAb9
tion Systems (ITSC). IEEE, 2018, pp. 3346–3351.
[30] H. Kaushik, “Ahmedabad has just 0.54 metre of road
[14] “These new motor vehicle act laws hike driving penalties per vehicle,” Times Of India, 2020. [Online]. Available:
from sept 1,” The Economic Times, 2019. [Online]. Available: bit.ly/2BF6aCI
bit.ly/39s2Nvk
[31] P. Barraclough, A. af Wåhlberg, J. Freeman, B. Watson, and
[15] WHO, “Road traffic injuries,” WHO, 2018. [Online]. Available: A. Watson, “Predicting crashes using traffic offences. a meta-
is.gd/DVbwm1 analysis that examines potential bias between self-report and
archival data,” PLoS one, vol. 11, no. 4, p. e0153390, 2016.
[16] S. K. Singh, “Road traffic accidents in india: issues and
challenges,” Transportation research procedia, vol. 25, pp. [32] R. C. Peck, “The identification of multiple accident correlates
4708–4719, 2017. in high risk drivers with specific emphasis on the role of
age, experience and prior traffic violation frequency.” Alcohol,
[17] B. González-Iglesias, J. A. Gómez-Fraguela, and M. Á.
Drugs & Driving, 1993.
Luengo-Martín, “Driving anger and traffic violations: Gender
differences,” Transportation research part F: traffic psychology
[33] T. N. Digital, “Motor vehicles act: Gujarat govt reduces hefty
and behaviour, vol. 15, no. 4, pp. 404–412, 2012.
traffic penalties by about 50%,” Times Now News, 2019.
[18] A. Jayatilleke, S. Dharmaratne, and A. Jayatilleke, “Increased [Online]. Available: https://is.gd/bCKyFL
traffic fines and road traffic crashes in sri lanka,” Injury
prevention, vol. 18, no. Suppl 1, pp. A209–A209, 2012. [34] A. Ankit, S. Hamidi, and M. Sengoelge, “Causes and health-
related outcomes of road traffic crashes in the united arab
[19] M. Leekha, M. Goswami, R. R. Shah, Y. Yin, and R. Zimmer- emirates: Panel data analysis of traffic fines,” Global Journal
mann, “Are you paying attention? detecting distracted driving of Health Science, vol. 10, no. 12, 2018.
in real-time,” in 2019 IEEE Fifth International Conference on
Multimedia Big Data (BigMM). IEEE, 2019, pp. 171–180. [35] M. Killias, P. Villettaz, and S. Nunweiler-Hardegger, “Higher
fines—fewer traffic offences? a multi-site observational study,”
[20] Q. Wang, W. Zhang, R. Yang, Y. Huang, L. Zhang, P. Ning, European Journal on Criminal Policy and Research, vol. 22,
X. Cheng, D. C. Schwebel, G. Hu, and H. Yao, “Common traf- no. 4, pp. 619–634, 2016.
fic violations of bus drivers in urban china: An observational
study,” PLoS one, vol. 10, no. 9, p. e0137954, 2015. [36] “All about gujarat traffic fines,” Digit Insurance, 2019.
[Online]. Available: https://is.gd/hssYP8
[21] R. Shah and R. Zimmermann, Multimodal analysis of user-
generated multimedia content. Springer, 2017. [37] W. H. Organization et al., “Speed management: a road safety
manual for decision-makers and practitioners,” 2008.
[22] H. Lamba, S. Srikanth, D. R. Pailla, S. Singh, K. S. Juneja,
and P. Kumaraguru, “Driving the last mile: Characterizing and [38] W. Karen A, “Evaluating three notification strategies for
understanding distracted driving posts on social networks,” in collecting delinquent traffic fines,” Justice System Journal,
Proceedings of the International AAAI Conference on Web vol. 13, no. 1, pp. 64–72, 1988.
and Social Media, vol. 14, 2020, pp. 393–404.
[23] L. Juhász and H. H. Hochmair, “Analyzing the spatial and
temporal dynamics of snapchat,” in AnaLysis, Integration,
Vision, Engagement (VGI-ALIVE) Workshop, 2018.
[24] S. A. Golder and M. W. Macy, “Diurnal and seasonal mood
vary with work, sleep, and daylength across diverse cultures,”
Science, vol. 333, no. 6051, pp. 1878–1881, 2011.
[25] F. Jegede, “Spatio-temporal analysis of road traffic accidents
in oyo state, nigeria,” Accident Analysis & Prevention, vol. 20,
no. 3, pp. 227–243, 1988.
[26] D. Mahata, P. K. Narzary, and D. Govil, “Spatio-temporal
analysis of road traffic accidents in indian large cities,” Clinical
Epidemiology and Global Health, vol. 7, no. 4, pp. 586–591,
2019.You can also read


