Avoiding high ozone pollution in Delhi, India - RSC Publishing
←
→
Page content transcription
If your browser does not render page correctly, please read the page content below
Faraday Discussions
Cite this: DOI: 10.1039/d0fd00079e
View Article Online
PAPER View Journal
This article is licensed under a Creative Commons Attribution 3.0 Unported Licence.
Avoiding high ozone pollution in Delhi,
Open Access Article. Published on 06 elokuuta 2020. Downloaded on 19.3.2021 6.24.33.
India†
Ying Chen, *a Gufran Beig,b Scott Archer-Nicholls,c Will Drysdale,d
W. Joe F. Acton,‡a Douglas Lowe,e Beth Nelson, d James Lee, d
Liang Ran,f Yu Wang,e Zhijun Wu,g Saroj Kumar Sahu, h
Ranjeet S. Sokhi,i Vikas Singh, j Ranu Gadi,k C. Nicholas Hewitt, a
Eiko Nemitz, l Alex Archibald,c Gordon McFigganse
and Oliver Wild *a
Received 26th June 2020, Accepted 6th August 2020
DOI: 10.1039/d0fd00079e
Surface ozone is a major pollutant threatening public health, agricultural production and
natural ecosystems. While measures to improve air quality in megacities such as Delhi
are typically aimed at reducing levels of particulate matter (PM), ozone could become
a greater threat if these measures focus on PM alone, as some air pollution mitigation
steps can actually lead to an increase in surface ozone. A better understanding of the
factors controlling ozone production in Delhi and the impact that PM mitigation
measures have on ozone is therefore critical for improving air quality. Here, we
combine in situ observations and model analysis to investigate the impact of PM
reduction on the non-linear relationship between volatile organic compounds (VOC),
nitrogen oxides (NOx) and ozone. In situ measurements of NOx, VOC, and ozone were
a
Lancaster Environment Centre, Lancaster University, Lancaster, UK. E-mail: y.chen65@lancaster.ac.uk; o.
wild@lancaster.ac.uk
b
Indian Institute of Tropical Meteorology, Pune, India
c
NCAS-Climate, Department of Chemistry, University of Cambridge, Cambridge, UK
d
Wolfson Atmospheric Chemistry Laboratories, University of York, UK
e
Centre for Atmospheric Sciences, Department of Earth and Environmental Sciences, University of Manchester,
Manchester, UK
f
Key Laboratory of Middle Atmosphere and Global Environment Observation, Institute of Atmospheric Physics,
Chinese Academy of Sciences, Beijing, China
g
State Key Joint Laboratory of Environmental Simulation and Pollution Control, College of Environmental
Sciences and Engineering, Peking University, China
h
Environmental Science, Department of Botany, Utkal University, India
i
Centre for Atmospheric and Climate Physics Research, University of Hertfordshire, Hateld, Hertfordshire, UK
j
National Atmospheric Research Laboratory, Gadanki, AP, India
k
Indira Gandhi Delhi Technical University for Women, Kashmere Gate, Delhi, India
l
UK Centre for Ecology & Hydrology, UKCEH, Bush Estate, Penicuik, Midlothian, UK
† Electronic supplementary information (ESI) available. See DOI: 10.1039/d0fd00079e
‡ Currently at School of Geography Earth and Environmental Sciences, the University of Birmingham,
Birmingham, UK.
This journal is © The Royal Society of Chemistry 2020 Faraday Discuss.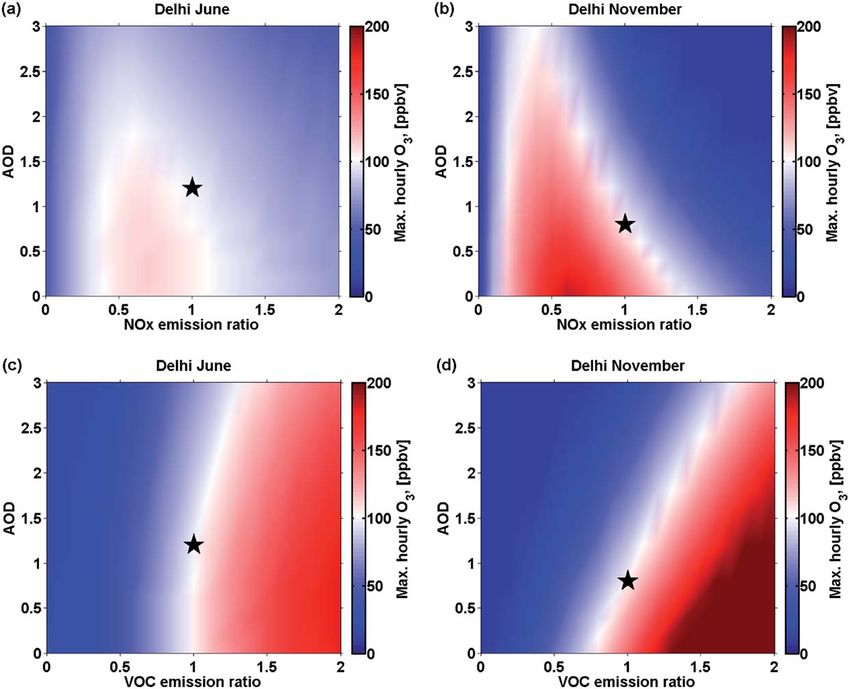
View Article Online
                                                                                                 Faraday Discussions                                                                Paper
                                                                                                 conducted in Delhi during the APHH-India programme in summer (June) and winter
                                                                                                 (November) 2018. We observed hourly averaged ozone concentrations in the city of up
                                                                                                 to 100 ppbv in both seasons. We performed sensitivity simulations with a chemical box
                                                                                                 model to explore the impacts of PM on the non-linear VOC–NOx–ozone relationship in
                                                                                                 each season through its effect on aerosol optical depth (AOD). We find that ozone
           This article is licensed under a Creative Commons Attribution 3.0 Unported Licence.

                                                                                                 production is limited by VOC in both seasons, and is particularly sensitive to solar
                                                                                                 radiation in winter. Reducing NOx alone increases ozone, such that a 50% reduction in
                                                                                                 NOx emissions leads to 10–50% increase in surface ozone. In contrast, reducing VOC
Open Access Article. Published on 06 elokuuta 2020. Downloaded on 19.3.2021 6.24.33.

                                                                                                 emissions can reduce ozone efficiently, such that a 50% reduction in VOC emissions
                                                                                                 leads to 60% reduction in ozone. Reducing PM alone also increases ozone, especially
                                                                                                 in winter, by reducing its dimming effects on photolysis, such that a 50% reduction in
                                                                                                 AOD can increase ozone by 25% and it also enhances VOC-limitation. Our results
                                                                                                 highlight the importance of reducing VOC emissions alongside PM to limit ozone
                                                                                                 pollution, as well as benefitting control of PM pollution through reducing secondary
                                                                                                 organic aerosol. This will greatly benefit the health of citizens and the local ecosystem
                                                                                                 in Delhi, and could have broader application for other megacities characterized by
                                                                                                 severe PM pollution and VOC-limited ozone production.

                                                                                                 Introduction
                                                                                                 Surface ozone exposure harms human health,1,2 reduces agricultural production3
                                                                                                 and threatens ecosystems.4,5 Rapid urbanization and expansion of traffic and
                                                                                                 industry have made ozone pollution an important air quality concern in India. In
                                                                                                 summer, the maximum hourly ozone concentration can reach as high as 140 ppbv
                                                                                                 in the capital city Delhi.6 This is comparable to the level in some polluted regions
                                                                                                 in China,7 and higher than that in polluted areas in the U.S. and Europe.8–10 About
                                                                                                 12 000 premature deaths in India are estimated to have resulted from ozone
                                                                                                 exposure in 2011,11 and this is likely to have increased during the past decade due
                                                                                                 to increasing anthropogenic emissions and commensurate increases in ozone.3,12
                                                                                                 This estimate could be conservative, since a more recent study shows a much
                                                                                                 stronger risk of ozone-induced respiratory deaths than previous studies, espe-
                                                                                                 cially over India where there may be an extra 40–60 deaths per 100 000 people.13
                                                                                                 However, most recent studies that have investigated mitigation of air pollution in
                                                                                                 Delhi focus on reducing particulate matter (PM).14–19 Ozone could become
                                                                                                 a greater threat in India if mitigation measures focus on PM pollution alone,20 as
                                                                                                 has recently been observed in China.21–23 Thorough, science-based mitigation
                                                                                                 strategies to avoid high ozone pollution while also achieving goals for PM
                                                                                                 reduction are therefore urgently needed for India, especially for Delhi where
                                                                                                 a large population is regularly exposed to extremely unhealthy levels of air
                                                                                                 pollution.19,24–28
                                                                                                     Surface ozone is produced by solar radiation-driven photochemistry that
                                                                                                 involves nitrogen oxides (NOx ¼ NO + NO2) and volatile organic compounds
                                                                                                 (VOC). Human economic activities, such transport, power generation and
                                                                                                 industrial production, are major anthropogenic sources of NOx and VOC in the
                                                                                                 urban region of Delhi,20,29 and biogenic emission is an important additional
                                                                                                 source for VOCs.30 VOCs of anthropogenic (such as toluene and benzene) and
                                                                                                 biogenic (such as monoterpene and isoprene) origin usually differ in species and
                                                                                                 possess different ozone production potentials.31,32 These gaseous VOCs are

                                                                                                 Faraday Discuss.                    This journal is © The Royal Society of Chemistry 2020
View Article Online
                                                                                                 Paper                                                        Faraday Discussions
                                                                                                 typically oxidized by hydroxy radicals (cOH), which are photochemically produced
                                                                                                 from ozone, formaldehyde, HONO and other precursors in the presence of
                                                                                                 sunlight. The oxidation products facilitate ozone production in the daytime, in
                                                                                                 the presence of NOx (see ref. 33 and references therein). PM also has a large
                                                                                                 impact on ozone photochemistry by attenuating incoming solar radiation (aerosol
                                                                                                 dimming effect)34 and by scavenging radicals.21,22
           This article is licensed under a Creative Commons Attribution 3.0 Unported Licence.

                                                                                                    Most studies investigating ozone photochemistry in India have focused on the
                                                                                                 contribution of gaseous precursors to ozone production, attributing increases in
Open Access Article. Published on 06 elokuuta 2020. Downloaded on 19.3.2021 6.24.33.

                                                                                                 ozone to the rapid increase in anthropogenic emissions.3,6,35–37 Recent studies
                                                                                                 argue that a reduction in PM could also lead to an increase in ozone,20–22 making
                                                                                                 the non-linear NOx–VOC–ozone relationship even more complex. A better
                                                                                                 understanding of this relationship is critical for formulating effective mitigation
                                                                                                 strategies to achieve the reduction in PM in Delhi whilst avoiding increased ozone
                                                                                                 pollution.
                                                                                                    In this study, we combine in situ observations and model analysis to improve
                                                                                                 understanding of the factors controlling ozone production in Delhi and investi-
                                                                                                 gate the impact of the aerosol dimming effect on the non-linear relationship
                                                                                                 between VOC, NOx, and ozone in summer and winter. We explore the relationship
                                                                                                 using a series of nearly nine thousand sensitivity simulations performed with
                                                                                                 a photochemical box model. To the best of our knowledge, this study presents the
                                                                                                 most exhaustive investigation of how the dimming effect of light scattering by PM
                                                                                                 impacts ozone photochemistry in Delhi. Our results provide guidance on the
                                                                                                 optimal choice of mitigation strategies to improve air quality in Delhi for both PM
                                                                                                 and ozone.

                                                                                                 Materials and methods
                                                                                                 Observations
                                                                                                 Measurements of ozone, NOx, CO and non-methane VOC concentrations near the
                                                                                                 surface were made during 1–8th June and 5–23rd November 2018 in Delhi, during
                                                                                                 the APHH-India programme (https://www.urbanair-india.org/). The observational
                                                                                                 site is located at the Indira Gandhi Delhi Technical University for Women
                                                                                                 (IGDTUW, 28.665  N, 77.232  E), at 7 m above ground level in June and at 35 m in
                                                                                                 November. The IGDTUW campus is located in the densely populated district of
                                                                                                 Old Delhi. Ozone concentrations were measured with a TEI 49C UV absorption
                                                                                                 analyser, which was calibrated to the UK’s National Physical Laboratory standard
                                                                                                 using a TEI 49PS. NOx concentrations were measured with a dual-channel high-
                                                                                                 resolution chemiluminescence instrument (Air Quality Designs Inc., Colorado).
                                                                                                 CO concentrations were measured with an Aerolaser AL 5002 UVU instrument.
                                                                                                 VOC concentrations were measured using a Proton Transfer Reaction-
                                                                                                 Quadrupole ion guide Time of Flight-Mass Spectrometer (PTR-QiTOF 2000, Ion-
                                                                                                 icon Analytik, Innsbruck, Austria). The instruments for NOx and CO measure-
                                                                                                 ments were well calibrated during the observations using procedures similar to
                                                                                                 those described by ref. 38. The PTR-QiTOF was calibrated daily using a 19
                                                                                                 component VOC standard (Apel-Riemer Environmental, Miami, USA).
                                                                                                     This standard was dynamically diluted into zero air to provide a three point
                                                                                                 calibration. Background measurements were made hourly using zero air. In order
                                                                                                 to focus on ozone photochemical production, we selected data obtained on clear-
                                                                                                 sky days when photochemistry was the major factor governing the diurnal

                                                                                                 This journal is © The Royal Society of Chemistry 2020               Faraday Discuss.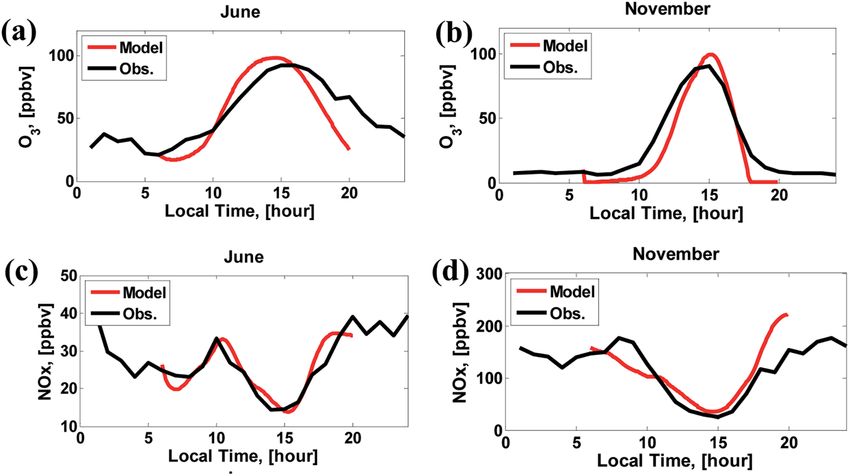
View Article Online
Faraday Discussions Paper
31 nd
variation of ozone, as indicated by sinusoidal behaviour. Data from the 2 and
4th June 2018, and 9th, 10th, 12–15th, 17–19th, and 21–23rd November 2018 were
analysed in this study. Surface temperature and relative humidity were recorded
at Indira Gandhi International Airport in Delhi, which is about 17 km southwest
of the observational site. These meteorological data were obtained from the
This article is licensed under a Creative Commons Attribution 3.0 Unported Licence.
National Oceanic and Atmospheric Administration, National Climatic Data
Center (https://www.ncdc.noaa.gov/), as described in ref. 39. The planetary
boundary layer height was adopted from the European Centre for Medium-Range
Open Access Article. Published on 06 elokuuta 2020. Downloaded on 19.3.2021 6.24.33.
Weather Forecasts (ECMWF) ERA-interim model reanalysis at a spatial resolution
of 0.125 0.125 and 3 hour temporal resolution (https://www.ecmwf.int/).
These ECMWF reanalysis data were also used to drive the Weather Research and
Forecasting Model (WRF, https://www.mmm.ucar.edu/weather-research-and-
forecasting-model). WRF simulations were performed over two nested domains,
an outer domain covering the whole of India and surrounding regions to mini-
mize the boundary impacts on meteorology simulation over India, and an inner
domain over north India at a horizontal resolution of 15 km, as detailed in ref. 20.
We apply the Hysplit back-trajectory model (https://www.ready.noaa.gov/
HYSPLIT.php) using high resolution hourly meteorology from WRF to provide
detailed transport footprints for air masses arriving in Delhi. For the selected
days, the air masses exclusively came from the southeast in June but from the
northwest in November (Fig. 1), indicating a consistent background for the
observations throughout each period. The Terra-MODIS aerosol optical depth
(AOD at 550 nm wavelength) over Delhi was about 1.2 and 0.8 in June and
November, respectively (MOD08_M3 level-3 product40). These monthly average
AOD values were adopted for calculating the present-day aerosol dimming effect
in the model simulations.
Model description
To investigate how the control of PM, VOC and NOx emissions can impact ozone
pollution, we performed sensitivity simulations using the National Center for
Atmospheric Research Master Mechanism photochemical box model (NCAR-MM
version 2.5, https://www2.acom.ucar.edu/modeling/ncar-master-mechanism).
This model includes a detailed gas phase chemical mechanism coupled with the
Tropospheric Ultraviolet and Visible (TUV, version 5.0) radiation scheme. In the
TUV scheme, the four-stream radiative transfer equations are solved within the
wavelength range of 120–735 nm to account for the scattering and absorption of
shortwave radiation by gases, particles and clouds in the atmosphere, thereby
calculating photolysis rates to drive the chemical mechanism.41 In this study,
1267 gaseous species and 3699 reactions were considered in the chemical
mechanism and integrated with a Gear solver, a benchmark solver for compre-
hensive chemical mechanisms.42
The NCAR-MM model was used to simulate the photochemical evolution of an
air parcel over Delhi using the temperature, relative humidity and planetary
boundary layer height datasets. To simulate ozone evolution in the daytime, we
initialize model simulations in the early morning (6:00 am, local time) before the
onset of rapid photochemistry and end simulations in the evening (8:00 pm). The
initial concentrations of ozone, NO, NO2, CO, VOC and AOD were constrained to
the observed averages at 6:00 am in June and November. We applied an iterative
Faraday Discuss. This journal is © The Royal Society of Chemistry 2020View Article Online
This article is licensed under a Creative Commons Attribution 3.0 Unported Licence. Paper Faraday Discussions
Open Access Article. Published on 06 elokuuta 2020. Downloaded on 19.3.2021 6.24.33.
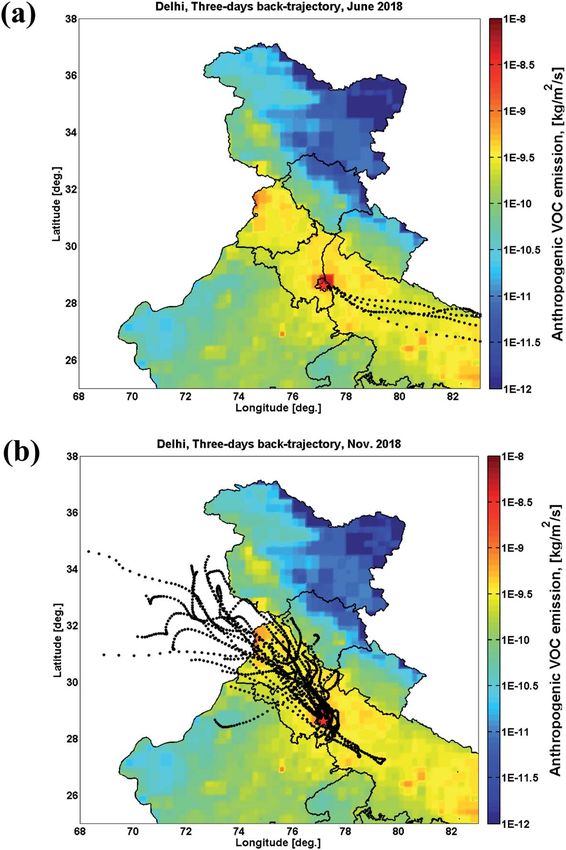
Fig. 1 Three-day air mass back-trajectory for Delhi, for the selected days in June (a) and
November (b). The back-trajectories for 00:00 and 12:00 UTC on each day are calculated
based on the high-resolution meteorology field from the WRF model. The background
colors indicate the anthropogenic VOC emissions from the EDGAR-HTAP 2010 dataset
(https://edgar.jrc.ec.europa.eu/). The data of the boundaries of administrative areas are
sourced from https://gadm.org/.
approach to adjust the NOx and VOC emissions for the base case simulation, to
capture the ozone diurnal pattern and reproduce hourly peak ozone within 10%
uncertainty, as shown in Fig. 2a and b. In the base case, the diurnal variation of
NOx is also reproduced when ozone is developing, and the uncertainty of NOx
concentration is within 10% at ozone peak timing, as shown in Fig. 2c and d. NOx
This journal is © The Royal Society of Chemistry 2020 Faraday Discuss.View Article Online
This article is licensed under a Creative Commons Attribution 3.0 Unported Licence. Faraday Discussions Paper
Open Access Article. Published on 06 elokuuta 2020. Downloaded on 19.3.2021 6.24.33.
Fig. 2 Observed and simulated ozone and NOx diurnal variations. (a) Ozone in June; (b)
ozone in November, (c) NOx in June, and (d) NOx in November. The black line indicates
observations and the red line indicates NCAR-MM model results.
concentrations are overestimated at 6:00–8:00 pm in November, but this does not
inuence simulation of the daytime development of ozone in our analysis. This
overestimation may be due to neglect of heterogeneous chemistry in the model,
therefore missing the chemical sinks of NOx that lead to production of particulate
nitrate, the concentration of which is about four times higher in winter than in
summer.43 We use toluene emissions as a proxy to represent the ozone production
potential of anthropogenic VOC emissions. Note that these constrained VOC and
NOx emission uxes (see Fig. S1†) represent effective emissions that include the
inuences of fresh emissions, transport processes, and effects from dilution and
deposition, and they are therefore not directly comparable with observed uxes or
emission inventories. We then performed 8820 sensitivity simulations for each
season varying the NOx emission (0% to 200% at 10% intervals), VOC emission
(0% to 200% at 10% intervals), and AOD (twenty different values in the range of 0–
3.0). Based on this large set of sensitivity simulations, we investigated the factors
governing ozone production in each season in Delhi, the non-linear NOx–VOC–
ozone relationship and how AOD impacts this relationship. We then demonstrate
mitigation strategies that reduce both ozone and PM in Delhi, based on our
results.
Results and discussion
Factors controlling ozone production in Delhi
As shown in Fig. 2, hourly ozone concentration can approach 100 ppbv in both
summer and winter in Delhi. In June, the daily average NOx concentration was
30 ppbv for the days considered and hourly averaged NOx was 16 ppbv when
ozone approached its daily peak at around 3:00 pm. Toluene, a good indicator of
anthropogenic VOC, had a daily average of 3.5 ppbv and hourly average of 2.4
ppbv at around 3:00 pm. Total monoterpenes, a good indicator of biogenic VOC,
had a daily average of 0.8 ppbv and hourly average of 0.6 ppbv at 3:00 pm. In
Faraday Discuss. This journal is © The Royal Society of Chemistry 2020View Article Online
Paper Faraday Discussions
November, the daily average NOx concentration was 120 ppbv for the days
considered and hourly NOx was 25 ppbv when ozone approached its daily peak.
Toluene reached a daily average of 19.1 ppbv (hourly average of 5.1 ppbv at peak
ozone) and total monoterpenes reached a daily average of 8.5 ppbv (hourly
average of 2.6 ppbv at peak ozone). This situation of much higher NOx than
This article is licensed under a Creative Commons Attribution 3.0 Unported Licence.
toluene and monoterpenes in Delhi is similar to that in Shanghai, where ozone
production is VOC-limited.31
Under these high-NOx conditions, ozone production in Delhi is limited by the
Open Access Article. Published on 06 elokuuta 2020. Downloaded on 19.3.2021 6.24.33.
abundance of VOC in both summer and winter in Delhi. Model results for June
(Fig. 3a) show that daily maximum hourly ozone concentration increases as VOC
emissions increase. A 50% increase in VOC emissions could increase the
maximum hourly ozone concentration by 50%, from 100 ppbv to 150 ppbv,
while a 50% reduction could decrease ozone by 60%, to 40 ppbv. In contrast,
a 50% increase in NOx emission would decrease ozone by 20%, to 80 ppbv in
June, while a 50% reduction would increase ozone by 5%, to 105 ppbv.
Decreasing ozone with NOx controls alone would require a reduction in NOx
emissions of more than 65%. VOC limitation on ozone production in Delhi is
even more pronounced in November (Fig. 3b), and a 50% increase in VOC
emissions could increase maximum hourly ozone concentration by 80%, from
100 ppbv to 180 ppbv, while a 50% reduction would decrease ozone by 65%, to
35 ppbv. The titration of ozone by NO is also much stronger in November, and
a 50% increase in NOx emissions could reduce ozone by 50%, to 50 ppbv. A
reduction in NOx emissions of more than 80% would be needed to reduce daily
maximum ozone in November under current VOC concentrations.
The sensitivity of ozone to VOC emissions, dened here as the change in ozone
associated with a change in VOC emissions in a range of 50%, DO3/DVOC-
emission, is about 30% greater in November than in June. This stronger VOC
limitation in November than in June is likely to be the result of weaker solar
radiation and a shallower planetary boundary layer in this season. Based on
ECMWF reanalysis, we nd an early aernoon planetary boundary layer height of
about 1800 m in November but about 2500 m in June. The weaker mixing in
November constrains the greater amount of freshly emitted NOx in the surface
layer, and enhanced VOC limitation. Weaker solar radiation could also enhance
the VOC limitation, as discussed in the next section. Our results are consistent
with previous studies that have shown ozone production is typically VOC-limited
Fig. 3 Daily maximum hourly ozone in Delhi as a function of NOx and VOC emissions in (a)
summer (June) and (b) winter (November). Current conditions are marked by a black star.
This journal is © The Royal Society of Chemistry 2020 Faraday Discuss.View Article Online
Faraday Discussions Paper
31,44,45
in urban environments, but highlights the extent of this in Delhi in both the
summer and winter seasons.
Impact of aerosol changes on ozone production
Atmospheric aerosol, represented here by AOD, can strongly inuence ozone
This article is licensed under a Creative Commons Attribution 3.0 Unported Licence.
photochemistry and thus alters the NOx–VOC–ozone relationships shown
above. In June, the midday photolysis rate of NO2, J[NO2], increased by 3% (from
9.7 103 s1 to 10.0 103 s1) when AOD is reduced by 50%. In November
Open Access Article. Published on 06 elokuuta 2020. Downloaded on 19.3.2021 6.24.33.
the midday photolysis rate increased by 14% (from 7.0 103 s1 to 8.0 103
s1) for 50% reduction in AOD. These J[NO2] values are lower than reported
values in Beijing for June and November34 even though Delhi is closer to the
tropics. This is due to the heavier aerosol loading in Delhi, where the AOD is
about 0.4 larger than in Beijing in both summer and winter and exerts a greater
dimming effect.
Fig. 4 shows that a 50% reduction in AOD increases maximum hourly ozone
concentrations by 5%, from 100 ppbv to 105 ppbv in June, but increases it by
25%, to 125 ppbv, in November. This highlights that wintertime ozone
production is not only VOC-limited but also strongly radiation-limited in Delhi.
The sensitivity of ozone to VOC emission also increases as AOD decreases in
November (Fig. 4d). This is likely to be because stronger solar radiation signi-
cantly enhances photochemical processing and local ozone production from VOC
oxidation in Delhi. In contrast, changes in AOD of 50% do not signicantly
Fig. 4 The impact of AOD on the non-linear VOC–NOx–ozone relationship in Delhi. (a)
Impact on relationship between NOx and ozone in summer (June), (b) between NOx and
ozone in winter (November), (c) between VOC and ozone in summer, and (d) between
VOC and ozone in winter. Current conditions are marked by a black star.
Faraday Discuss. This journal is © The Royal Society of Chemistry 2020View Article Online
Paper Faraday Discussions
inuence the sensitivity of ozone to NOx and VOC emissions in June (Fig. 4a and
c), see also Fig. S2.† A detailed tomography gure of the non-linear AOD–NOx–
VOC–ozone relationship is given in Fig. S3.† These results highlight that aerosols
play a critical role in the photochemistry of ozone production, and this is over-
looked in most previous mitigation strategy studies and needs to be fully
This article is licensed under a Creative Commons Attribution 3.0 Unported Licence.
considered when developing a comprehensive regulatory framework for the
control of surface ozone pollution.
Open Access Article. Published on 06 elokuuta 2020. Downloaded on 19.3.2021 6.24.33.
Mitigation strategies to avoid high ozone
The Central Pollution Control Board of India (CPCB) reports that measures
currently adopted to improve the air quality in Delhi focus mainly on controlling
traffic, biomass burning, industrial and construction emissions.46 These mitiga-
tion strategies address PM pollution,14–19,46,47 but do not reduce VOC sufficiently to
avoid ozone increase. Traffic is the major target of the current mitigation
measures and is the largest VOC emission source within Delhi contributing 80
kiloton per year (60%),48 but control of traffic emissions alone can lead to large
ozone increases due to the associated reduction in NOx and PM (Fig. S4†).20
Transport from domestic emissions in surrounding regions could contribute
substantially to VOC in Delhi (Fig. 1). For example, VOC emitted from domestic
sources in Uttar Pradesh (southeast of Delhi) and Haryana (northwest of Delhi)
are about 1100 kiloton per year and 110 kiloton per year, respectively, which are
much larger than local traffic emissions in Delhi.48
Our results suggest that strategies reducing PM under current conditions
will lead to enhanced, and possibly severe, ozone pollution. Reduction in PM
enhances surface solar radiation and ozone production, and also weakens the
removal of hydroperoxyl radicals on particle surfaces, therefore further
enhancing ozone production.21,22 The aerosol dimming effect is likely to be
more important than the radical uptake effect in impacting surface ozone.
Recent in situ observations in Beijing do not show a signicant impact of the
heterogeneous sink on radical concentrations.49 Another sensitivity study,
based on APHH-India in situ observations in Delhi, does not show a signicant
impact on surface ozone concentration via heterogeneous uptake of hydro-
peroxyl radicals ozone production increases by 3% when particle surface area
was reduced by 90% (see Prof. James Lee's comments in the accompanying
Discussion). The COVID 19 lockdowns in 2020 have provided a natural test of
strict emission interventions. Our results showing that reductions in NOx and
aerosol dimming effect enhance surface ozone could help explain the recently
reported ozone increases in Beijing50 and Delhi51 during lockdown. Our results
suggest that control of VOC emissions is critical to avoid high ozone pollution
in Delhi while also achieving the intended air quality goal of reduced PM levels.
In addition, VOC is an important precursor of PM in Delhi where large fractions
of secondary organic aerosol are present in all seasons.43 Reducing VOC emis-
sions is therefore a key measure to benet Delhi air quality with respect to both
PM and ozone pollution, while avoiding the trade-offs associated with other PM
mitigation measures. Regional joint intervention with more attention on
domestic sources would be required for controlling VOC and avoiding high
ozone pollution in Delhi. Future studies to characterize the VOC species,
apportion their sources, and investigate their potentials for ozone production
This journal is © The Royal Society of Chemistry 2020 Faraday Discuss.View Article Online
Faraday Discussions Paper
and secondary organic aerosol formation in Delhi would be particularly useful.
These studies would provide further insight and help inform more effective and
targeted mitigation strategies.
Conclusions
This article is licensed under a Creative Commons Attribution 3.0 Unported Licence.
Measurements of ozone and its precursors were performed in June and November
2018 in Delhi, India. High ozone pollution with hourly concentration up to 100
Open Access Article. Published on 06 elokuuta 2020. Downloaded on 19.3.2021 6.24.33.
ppbv was observed in both seasons. We performed nearly nine thousand simu-
lations using a photochemical box model to investigate the contributions of VOC
and NOx emissions to ozone production, and to explore the inuence of aerosol
dimming on ozone photochemistry. We nd that ozone production in Delhi is
limited by VOC concentrations in both seasons, but particularly strongly in
winter. In addition, ozone production in winter is strongly limited by solar radi-
ation. Therefore, some measures to reduce PM could increase ozone through
increased photolysis, especially in winter, and this effect would be exacerbated as
it also enhances the extent of VOC-limitation. High ozone, and consequently high
OH radical, could facilitate the oxidation of gaseous precursors and enhance
secondary formation of PM,52 and this could partly offset the reduction in PM.
This effect is not investigated in this study and should be quantied in future
studies.
These results highlight the importance of controlling VOC emissions along-
side particulate matter and NOx, which is overlooked in current mitigation
strategies for Delhi. This would help to avoid major problems with ozone pollu-
tion in Delhi whilst reducing particulate matter. Measures that focus on partic-
ulate matter alone could see ozone increases alongside reduction in particulate
matter, as has happened recently in China.21–23 Furthermore, reductions in VOC
emissions could contribute to mitigation of particulate matter, a high fraction of
which is sourced from semi-volatile organic compounds, the oxidation products
of VOCs.43 Therefore, reducing VOC emissions is a win–win measure with respect
to both ozone and particulate matter pollution in Delhi. High ozone pollution not
only has negative impacts on human health but also on agriculture and ecosys-
tems.4,5 These measures would benet the health of citizens and ecosystems in
Delhi, with potential broader application in other megacities worldwide charac-
terized by VOC-limited ozone production.
Statement of contributions
YC and OW conceived the study. YC performed the simulations, processed and
interpreted the results with help from all co-authors. GB, WD, WJFA, BN, JL, SKS,
RSS, VS, RG, CNH and EN organized the APHH-India campaign and performed
the observations. SAN, AA, DL and GM contributed to the WRF simulation and
chemistry interpreting. LR, YW and ZW helped with the NCAR-MM model
simulation. YC wrote the manuscript with inputs from all co-authors.
Conflicts of interest
The authors declare no competing nancial interest.
Faraday Discuss. This journal is © The Royal Society of Chemistry 2020View Article Online
Paper Faraday Discussions
Acknowledgements
This work was supported by the NERC/MOES/Newton Fund supported DelhiFlux
and PROMOTE projects as part of APHH-India programme (grant numbers: NE/
P01531X/1, NE/P016405/1, NE/P016502/1, NE/P016480/1 and NE/P016383/1).
This article is licensed under a Creative Commons Attribution 3.0 Unported Licence.
The Indian Institute of Tropical Meteorology, Pune, is supported by the
Ministry of Earth Science, Government of India. The authors appreciate the
efforts of the entire team involved in APHH-India programme. The paper is based
Open Access Article. Published on 06 elokuuta 2020. Downloaded on 19.3.2021 6.24.33.
on interpretation of scientic results and in no way reect the viewpoint of the
funding agency.
Notes and references
1 S. C. Anenberg, J. J. West, A. M. Fiore, D. A. Jaffe, M. J. Prather, D. Bergmann,
K. Cuvelier, F. J. Dentener, B. N. Duncan, M. Gauss, P. Hess, J. E. Jonson,
A. Lupu, I. A. MacKenzie, E. Marmer, R. J. Park, M. G. Sanderson,
M. Schultz, D. T. Shindell, S. Szopa, M. G. Vivanco, O. Wild and G. Zeng,
Environ. Sci. Technol., 2009, 43, 6482–6487.
2 H. Liu, S. Liu, B. Xue, Z. Lv, Z. Meng, X. Yang, T. Xue, Q. Yu and K. He, Atmos.
Environ., 2018, 173, 223–230.
3 S. D. Ghude, C. Jena, D. M. Chate, G. Beig, G. G. Pster, R. Kumar and
V. Ramanathan, Geophys. Res. Lett., 2014, 41, 5685–5691.
4 K. Ashworth, O. Wild, A. S. D. Eller and C. N. Hewitt, Environ. Sci. Technol.,
2015, 49, 8566–8575.
5 K. Ashworth, O. Wild and C. N. Hewitt, Nat. Clim. Change, 2013, 3, 492–496.
6 S. D. Ghude, S. L. Jain, B. C. Arya, G. Beig, Y. N. Ahammed, A. Kumar and
B. Tyagi, J. Atmos. Chem., 2008, 60, 237–252.
7 T. Wang, L. Xue, P. Brimblecombe, Y. F. Lam, L. Li and L. Zhang, Sci. Total
Environ., 2017, 575, 1582–1596.
8 X. Lu, J. Hong, L. Zhang, O. R. Cooper, M. G. Schultz, X. Xu, T. Wang, M. Gao,
Y. Zhao and Y. Zhang, Environ. Sci. Technol. Lett., 2018, 5(8), 487–494.
9 X. Querol, G. Gangoiti, E. Mantilla, A. Alastuey, M. C. Minguillón, F. Amato,
C. Reche, M. Viana, T. Moreno, A. Karanasiou, I. Rivas, N. Pérez, A. Ripoll,
M. Brines, M. Ealo, M. Pandol, H. K. Lee, H. R. Eun, Y. H. Park,
M. Escudero, D. Beddows, R. M. Harrison, A. Bertrand, N. Marchand,
A. Lyasota, B. Codina, M. Olid, M. Udina, B. Jiménez-Esteve, M. R. Soler,
L. Alonso, M. Millán and K. H. Ahn, Atmos. Chem. Phys., 2017, 17, 2817–2838.
10 E. Paoletti, A. De Marco, D. C. S. Beddows, R. M. Harrison and W. J. Manning,
Environ. Pollut., 2014, 192, 295–299.
11 S. D. Ghude, D. M. Chate, C. Jena, G. Beig, R. Kumar, M. C. Barth, G. G. Pster,
S. Fadnavis and P. Pithani, Geophys. Res. Lett., 2016, 43, 4650–4658.
12 S. T. Rogers and G. Huang, American Geophysical Union Fall Meeting 2018, 2018,
2018AGUFM.A2021C.2007R.
13 C. S. Malley, D. K. Henze, J. C. I. Kuylenstierna, H. W. Vallack, Y. Davila,
S. C. Anenberg, M. C. Turner and M. R. Ashmore, Environ. Health Perspect.,
2017, 125, 087021.
14 S. Chowdhury, S. Dey, S. Guttikunda, A. Pillarisetti, K. R. Smith and L. Di
Girolamo, Proc. Natl. Acad. Sci. U. S. A., 2019, 116(22), 10711–10716.
15 S. Chowdhury, S. Dey and K. R. Smith, Nat. Commun., 2018, 9, 318.
This journal is © The Royal Society of Chemistry 2020 Faraday Discuss.View Article Online
Faraday Discussions Paper
16 L. Conibear, E. W. Butt, C. Knote, S. R. Arnold and D. V. Spracklen, GeoHealth,
2018, 2, 196–211.
17 L. Conibear, E. W. Butt, C. Knote, S. R. Arnold and D. V. Spracklen, Nat.
Commun., 2018, 9, 617.
18 P. Purohit, M. Amann, G. Kiesewetter, P. Rafaj, V. Chaturvedi, H. H. Dholakia,
This article is licensed under a Creative Commons Attribution 3.0 Unported Licence.
P. N. Koti, Z. Klimont, J. Borken-Kleefeld, A. Gomez-Sanabria, W. Schöpp and
R. Sander, Environ. Int., 2019, 133, 105147.
19 M. Amann, P. Purohit, A. D. Bhanarkar, I. Bertok, J. Borken-Kleefeld, J. Cofala,
Open Access Article. Published on 06 elokuuta 2020. Downloaded on 19.3.2021 6.24.33.
C. Heyes, G. Kiesewetter, Z. Klimont, J. Liu, D. Majumdar, B. Nguyen, P. Rafaj,
P. S. Rao, R. Sander, W. Schöpp, A. Srivastava and B. H. Vardhan, Atmos.
Environ., 2017, 161, 99–111.
20 Y. Chen, O. Wild, E. Ryan, S. K. Sahu, D. Lowe, S. Archer-Nicholls, Y. Wang,
G. McFiggans, T. Ansari, V. Singh, R. S. Sokhi, A. Archibald and G. Beig,
Atmos. Chem. Phys., 2020, 20, 499–514.
21 K. Li, D. J. Jacob, H. Liao, J. Zhu, V. Shah, L. Shen, K. H. Bates, Q. Zhang and
S. Zhai, Nat. Geosci., 2019, 12, 906–910.
22 K. Li, D. J. Jacob, H. Liao, L. Shen, Q. Zhang and K. H. Bates, Proc. Natl. Acad.
Sci. U. S. A., 2018, 116(2), 422–427.
23 B. Silver, C. L. Reddington, S. R. Arnold and D. V. Spracklen, Environ. Res. Lett.,
2018, 13, 114012.
24 Y. Chen, O. Wild, L. Conibear, L. Ran, J. He, L. Wang and Y. Wang, Atmospheric
Environment: X, 2020, 5, 100052.
25 S. Chowdhury and S. Dey, Environ. Int., 2016, 91, 283–290.
26 WHO, Review of evidence on health aspects of air pollution REVIHAAP nal
technical report, World Health Organization, Geneva, 2013.
27 WHO, Zika Situation Report, 2016, pp. 1–7.
28 WHO, available: http://www.who.int/airpollution/data/cities-2016/en/, 2016,
last access: 08 Nov. 2018.
29 S. K. Sahu, G. Beig and N. Parkhi, Aerosol Air Qual. Res., 2015, 15, 1137–1144.
30 A. B. Guenther, X. Jiang, C. L. Heald, T. Sakulyanontvittaya, T. Duhl,
L. K. Emmons and X. Wang, Geosci. Model Dev., 2012, 5, 1471–1492.
31 L. Ran, C. Zhao, F. Geng, X. Tie, X. Tang, L. Peng, G. Zhou, Q. Yu, J. Xu and
A. Guenther, J. Geophys. Res.: Atmos., 2009, 114, D15301.
32 W. P. L. Carter, Air Waste, 1994, 44, 881–899.
33 P. S. Monks, A. T. Archibald, A. Colette, O. Cooper, M. Coyle, R. Derwent,
D. Fowler, C. Granier, K. S. Law, G. E. Mills, D. S. Stevenson, O. Tarasova,
V. Thouret, E. von Schneidemesser, R. Sommariva, O. Wild and
M. L. Williams, Atmos. Chem. Phys., 2015, 15, 8889–8973.
34 M. Hollaway, O. Wild, T. Yang, Y. Sun, W. Xu, C. Xie, L. Whalley, E. Slater,
D. Heard and D. Liu, Atmos. Chem. Phys., 2019, 19, 9699–9714.
35 Z. Q. Hakim, S. Archer-Nicholls, G. Beig, G. A. Folberth, K. Sudo,
N. L. Abraham, S. Ghude, D. K. Henze and A. T. Archibald, Atmos. Chem.
Phys., 2019, 19, 6437–6458.
36 G. Beig, S. D. Ghude, S. D. Polade and B. Tyagi, Geophys. Res. Lett., 2008, 35,
L02802.
37 G. Beig, S. Gunthe and D. B. Jadhav, J. Atmos. Chem., 2007, 57, 239–253.
38 F. A. Squires, E. Nemitz, B. Langford, O. Wild, W. S. Drysdale, W. J. F. Acton,
P. Fu, C. S. B. Grimmond, J. F. Hamilton, C. N. Hewitt, M. Hollaway,
S. Kotthaus, J. Lee, S. Metzger, N. Pingintha-Durden, M. Shaw,
Faraday Discuss. This journal is © The Royal Society of Chemistry 2020View Article Online
Paper Faraday Discussions
A. R. Vaughan, X. Wang, R. Wu, Q. Zhang and Y. Zhang, Atmos. Chem. Phys.,
2020, 20, 8737–8761.
39 Y. Wang and Y. Chen, Geophys. Res. Lett., 2019, 46, 5535–5545.
40 S. Platnick et al., MODIS Atmosphere L3 Monthly Product, NASA MODIS Adaptive
Processing System, Goddard Space Flight Center, USA, 2015, DOI: 10.5067/
This article is licensed under a Creative Commons Attribution 3.0 Unported Licence.
MODIS/MOD08_M3.061.
41 S. Madronich and S. Flocke, The role of solar radiation in atmospheric
chemistry, in Handbook of Environmental Chemistry, ed. P. Boule, Springer-
Open Access Article. Published on 06 elokuuta 2020. Downloaded on 19.3.2021 6.24.33.
Berlin, Heidelberg, 1998, pp. 1–26.
42 M. Z. Jacobson and R. P. Turco, Atmos. Environ., 1994, 28, 273–284.
43 S. Gani, S. Bhandari, S. Seraj, D. S. Wang, K. Patel, P. Soni, Z. Arub, G. Habib,
L. Hildebrandt Ruiz and J. S. Apte, Atmos. Chem. Phys., 2019, 19, 6843–6859.
44 A. Sharma, N. Ojha, A. Pozzer, K. A. Mar, G. Beig, J. Lelieveld and S. S. Gunthe,
Atmos. Chem. Phys., 2017, 17, 14393–14413.
45 S. Sillman, J. A. Logan and S. C. Wofsy, J. Geophys. Res.: Atmos., 1990, 95, 1837–
1851.
46 CPCB, http://cpcbenvis.nic.in/envis_newsletter/Air%20pollution%20in%
20Delhi.pdf, 2016, latest access: 13 July 2020.
47 S. Chowdhury, S. Dey, S. N. Tripathi, G. Beig, A. K. Mishra and S. Sharma,
Environ. Sci. Policy, 2017, 74, 8–13.
48 S. Sharma, A. Goel, D. Gupta, A. Kumar, A. Mishra, S. Kundu, S. Chatani and
Z. Klimont, Atmos. Environ., 2015, 102, 209–219.
49 Z. Tan, A. Hofzumahaus, K. Lu, S. S. Brown, F. Holland, L. G. Huey,
A. Kiendler-Scharr, X. Li, X. Liu, N. Ma, K.-E. Min, F. Rohrer, M. Shao,
A. Wahner, Y. Wang, A. Wiedensohler, Y. Wu, Z. Wu, L. Zeng, Y. Zhang and
H. Fuchs, Environ. Sci. Technol., 2020, 54(10), 5973–5979.
50 T. Le, Y. Wang, L. Liu, J. Yang, Y. L. Yung, G. Li and J. H. Seinfeld, Science, 2020,
369(6504), 702–706.
51 V. Singh, S. Singh, A. Biswal, A. P. Kesarkar, S. Mor and K. Ravindra, Environ.
Pollut., 2020, 266(3), 115368.
52 D. Hu, Y. Chen, Y. Wang, V. Daële, M. Idir, C. Yu, J. Wang and A. Mellouki, Sci.
Total Environ., 2019, 657, 1074–1084.
This journal is © The Royal Society of Chemistry 2020 Faraday Discuss.You can also read