Sour Wind in West Texas - Air Pollution From Surging Oil and Gas Industry Exceeds Health Standards - Environmental Integrity Project
←
→
Page content transcription
If your browser does not render page correctly, please read the page content below
Sour Wind in West Texas
Air Pollution From Surging Oil and Gas Industry Exceeds Health
Standards

                                 EMBARGOED FOR RELEASE:
                                 THURSDAY, MAY 9, 2019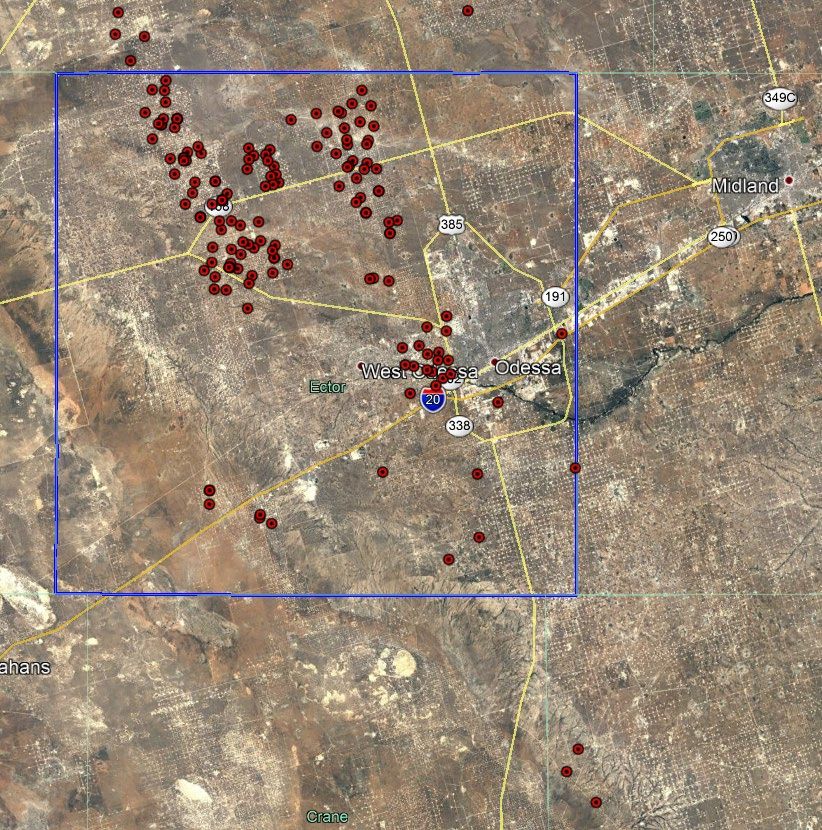
ACKNOWLEDGEMENTS
Written by Ilan Levin, Courtney Bernhardt, and Ari
Phillips of the Environmental Integrity Project.
THE ENVIRONMENTAL INTEGRITY PROJECT
The Environmental Integrity Project
(http://www.environmentalintegrity.org) is a nonpartisan,
nonprofit organization established in March of 2002 by
former EPA enforcement attorneys to advocate for effective
enforcement of environmental laws. EIP has three goals: 1)
to provide objective analyses of how the failure to enforce or
implement environmental laws increases pollution and
affects public health; 2) to hold federal and state agencies, as
well as individual corporations, accountable for failing to
enforce or comply with environmental laws; and
3) to help local communities obtain the protection of
environmental laws.
CONTACTS:
For questions about this report, please contact:
Tom Pelton, Environmental Integrity Project, (202) 888-
2703 or tpelton@environmentalintegrity.org
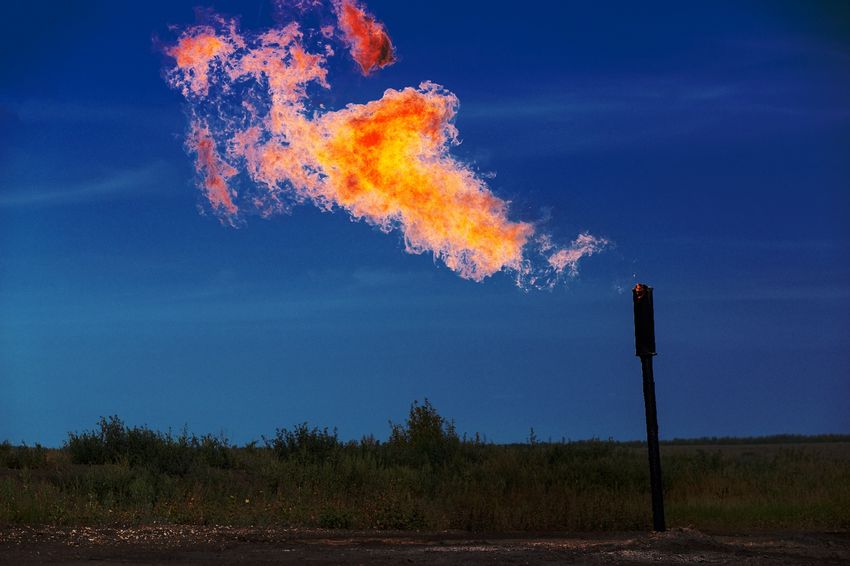
P H O T O C R E D I T S : Cover image: Gas flaring; Shutterstock. Pumpjack
located south of Midland, Texas; Wikimedia Commons. Big Spring monitoring
station; Texas Commission on Environmental Quality.
2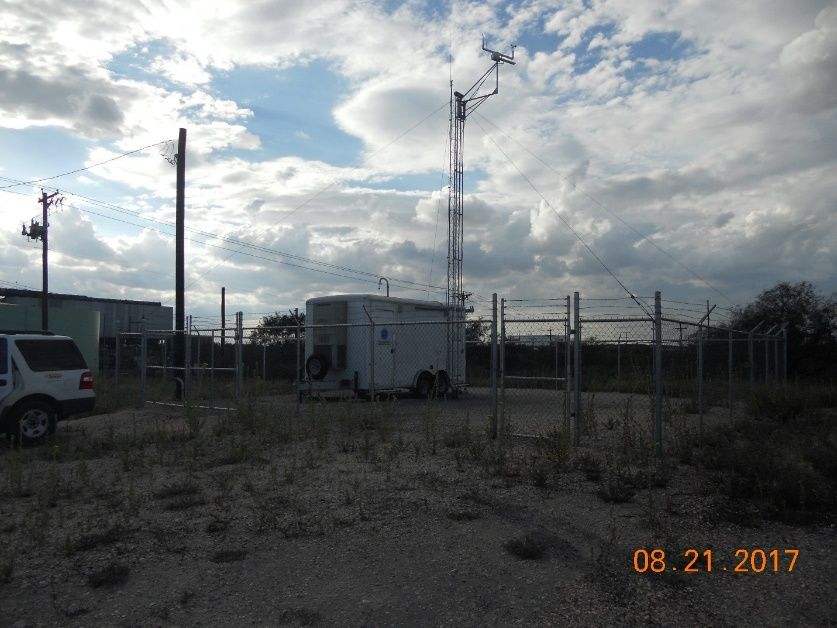
Sour Wind in West Texas
Air Pollution from Surging Oil and Gas Industry Exceeds
Health Standards

T
        he Permian Basin oil producing region encompasses about 63,834 square miles in
        western Texas and southeastern New Mexico, extending to 29,000 feet underground,
        making it one of the thickest hydrocarbon producing regions in the world. 1 Oil
        companies have been drilling in the Permian since the 1920s, but horizontal drilling
and hydraulic fracturing brought a new boom to the region in the past decade. In 2015,
Congress lifted the U.S. ban on the export of crude oil, further boosting domestic
production. Industry insiders predict that by 2021, Permian Basin oil will account for about
40 percent of all U.S. production. 2 By 2023, the industry expects oil production to double
from 2017 levels. 3 According to the International Energy Agency, U.S. crude oil will
account for 80 percent of the growth in global oil supply over the next seven years, and most
of that oil will come from the Permian. 4
With that oil comes record-breaking production of natural gas and natural gas liquids, along
with the processing, storage, and transportation that these products require. This requires a
massive buildout of plants, tanks, pipes,
and other infrastructure – most of which
release air pollution.
According to industry reports filed with
the Texas Commission on
Environmental Quality (TCEQ),
Permian Basin oil and gas facilities
release more illegal air pollution during
equipment failures, shutdowns, and
other non-routine “emission events”
than in any other part of the state. 5
A 2018 study, published in the
American Chemistry Society’s
Environmental Science and Technology,        Despite excessive levels of unauthorized pollution in the Permian
found that health costs in Odessa (Ector Basin, the region lacks enough air quality monitors to protect
                                             public health.
County) attributable to unpermitted air
pollution are greater than many of Texas’ heavily industrialized Gulf Coast counties. 6 This
research strongly suggests that residents of sparsely populated West Texas bear a
disproportionate share of health burdens from air pollution. A 2019 study of TCEQ data by
the non-profit Environment Texas also concluded that the Permian Basin region leads the
state of Texas in illegal (unpermitted) air pollution emissions. 7 These studies are remarkable

                                                                                                             1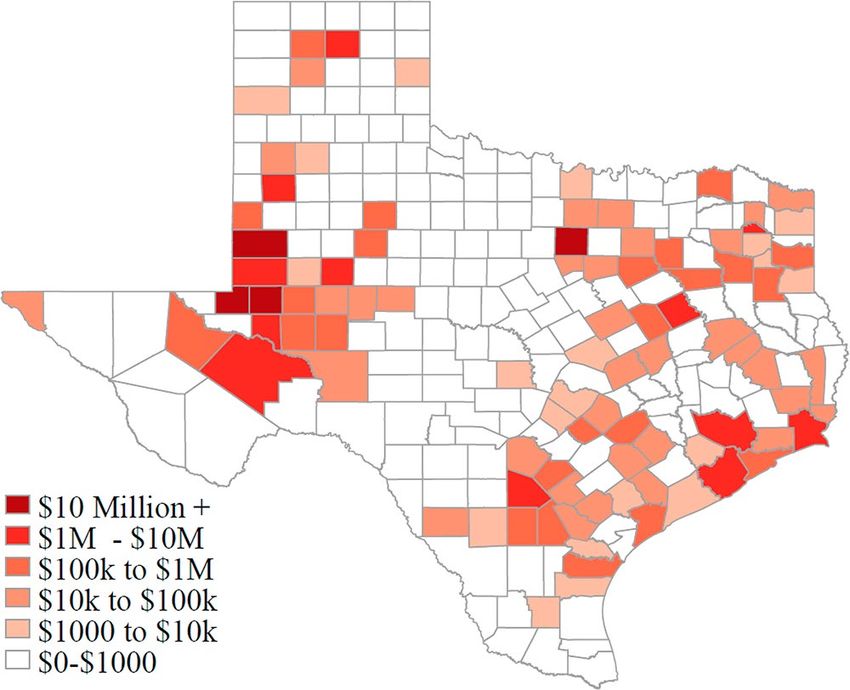
given that the Texas Gulf Coast, including the Houston Ship Channel, is home to the largest
concentration of oil refineries and petrochemical plants in the nation.
Despite the excessive levels of unauthorized emissions in the Permian Basin, the region
lacks enough air quality monitors to determine if the air is safe to breathe. The TCEQ’s
Houston region has approximately 60 active air quality monitoring stations, while the
Midland-Odessa region has three. 8 Of these three monitors, only one measures sulfur
dioxide, which is the most prevalent air pollutant in the Permian Basin. The lone sulfur
dioxide air monitor in this region, which is located in Big Spring (about 60 miles east of
Odessa) was activated in 2016. 9 It shows there is cause for concern. On at least 30 occasions
between December 2016 and April 2019, hourly sulfur dioxide pollution levels measured at
Big Spring exceeded the national health-based standard. 10 In March 2018, the Big Spring air
monitor recorded 460 parts per billion of sulfur dioxide – more than six times higher than
the 75 parts per billion air quality standard for one hour.
                                                                  Because there is only one
                                                                  functioning air monitoring station
                                                                  measuring sulfur dioxide in the
                                                                  Permian Basin, the Environmental
                                                                  Integrity Project studied the
                                                                  regional air quality, based on
                                                                  industry self-reported unauthorized
                                                                  releases of air pollution, which
                                                                  occurred mainly from flaring.
                                                                          Using the Environmental Protection
                                                                          Agency (EPA)-approved air quality
                                                                          model known as AERMOD (the
                                                                          American Meteorological
                                                                          Society/Environmental Protection
                                                                          Agency Regulatory Model), we
  The TCEQ Air monitoring station in Big Spring began operating          demonstrated the air quality impacts
  Dec. 3, 2016. Sulfur dioxide air pollution levels there are frequently in Ector County resulting from the
  above federal health standards.
                                                                         oil and gas industry’s self-reported
                                                                         emissions of sulfur dioxide,
matching them with actual weather conditions at the time and place of the emissions
incidents. We chose Ector County due to the relatively large (for West Texas) population of
about 156,000 residents, including 117,000 in the county seat, Odessa.
According to the modeling results, excessive flaring from the oil and gas industry is causing
dangerous levels of sulfur dioxide air pollution in and around Odessa. Pollution levels in
much of Ector County exceed the hourly health-based standard set by EPA. More broadly,
our study suggests that across the Permian Basin, residents, workers, and visitors are
exposed to excessive air pollution as a result of excessive flaring.

                                                                                                           2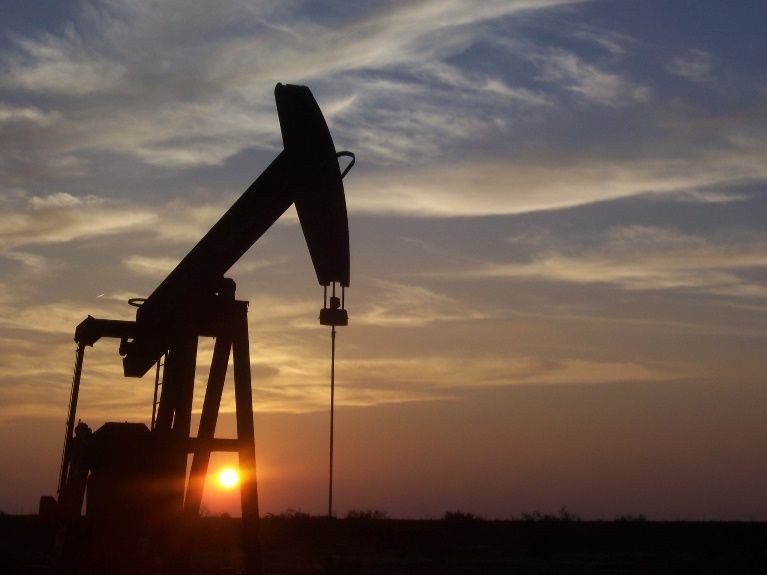
Summary of Findings:

   •   Oil and gas operators in and around Ector County self-reported 2,564 unauthorized
       releases of air pollution in a four-year period from 2014-2017.
   •   The worst sulfur dioxide pollution for all four years studied was 3,644 micrograms
       per cubic meter, in 2014, near Goldsmith, northwest of Odessa. That pollution level
       was 18 times higher than the EPA’s health-based National Ambient Air Quality
       Standard of 75 parts per billion. 11
   •   The one functioning sulfur dioxide monitoring station in the Permian Basin, in Big
       Spring, frequently measures sulfur dioxide concentrations at levels above 75 parts per
       billion.
   •   Residents of the Permian Basin are breathing air with excessive levels of sulfur
       dioxide pollution, resulting from the widespread flaring of “sour gas” (gas that
       contains significant amounts of hydrogen sulfide).
   •   According to computer modeling, excessive flaring at oil and gas operations in and
       around Ector County result in pollution levels exceeding the national health based
       standard for sulfur dioxide.

Recommendations:

There is a serious and ongoing air pollution problem in the Permian Basin. Residents of the
Permian Basin are bearing a heavy burden when it comes to health impacts from air
pollution. Federal and state leaders should do more to protect health and safety in West
Texas, where illegal pollution from oil and gas production is reaching levels of serious
concern based on the federal health-based standard for sulfur dioxide.
Federal and state regulators have an important obligation to control this pollution. The EPA
should investigate whether air quality in the Permian Basin meets the federal health-based
National Ambient Air Quality Standards. If the most reliable available data (including air
dispersion model results where monitoring does not yet exist) indicates air pollution in
violation of federal standards, then EPA should designate the area as being in
nonattainment for sulfur dioxide. This would trigger stricter environmental and health
protections in the Permian, which would improve both air quality and human health.
Texas has laws in place that, if enforced, would help reduce this air pollution.

   •   The Texas Commission on Environmental Quality and the Railroad Commission of
       Texas (which regulates oil and gas operations) should more strictly enforce their
       permitting rules. These state agencies should only approve permits for facilities that
       can demonstrate their emissions will comply with state and federal standards.
   •   TCEQ should more closely scrutinize permit applications to ensure they are not
       authorizing dangerous levels of sulfur dioxide. The agency should not issue permits
       that allow flaring in violation of any federal ambient air standards.
   •   Texas should ramp up its enforcement in the Permian Basin by penalizing oil and gas
       companies for flaring emissions over permitted levels. Both the TCEQ and the
       Railroad Commission should assess fines at levels sufficient to create an incentive for

                                                                                            3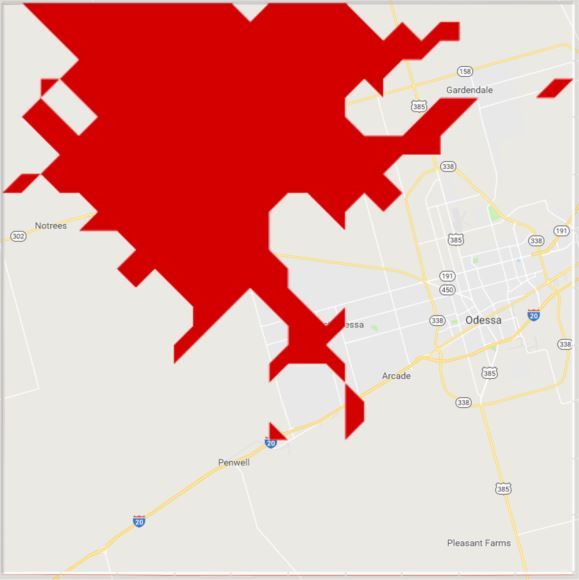
companies to comply with anti-waste, flare-minimazation, and clean air laws. In
       addition to penalties, the TCEQ should order the largest emitters to establish
       monitoring networks upwind and downwind of their facilities.
   •   Texas should make a modest investment in the health of Permian Basin residents by
       establishing a regional air quality monitoring network to measure air quality in
       Midland-Odessa. Monitoring stations should measure multiple pollutants and
       meteorological conditions, and should be located to measure baseline and worst-case
       conditions.
West Texas communities that are paying the steepest price – in terms of air quality and
health – should not be left at the mercy of polluters. State and federal regulators have an
obligation to step in and protect the public from harmful emissions.

Air Pollution in the Texas Permian Basin
The Permian Basin is the largest oil and natural gas-producing basin in the U.S., and is
home to about 1.4 million people, according to 2017 U.S. Census estimates. As stated in the
introduction, oil companies have been drilling and extracting oil from the Permian since the
1920s, but horizontal drilling and hydraulic fracturing brought a new boom to the region
starting around 2010. This trend was accelerated in 2015 by Congress’ approval of crude oil
exports. Oil and gas producers in the Permian are now extracting more than ever. 12
Oil and gas production relies on a system of interconnected infrastructure. Most of the
components of this system (wells, tank batteries, pipelines, compressor stations, gas
processing plants, oil refineries, petrochemical plants, and power plants) are also sources of
air pollution. For that reason, oil and gas production facilities are required to have air
pollution permits that comply with the federal Clean Air Act.
But, according to industry reports filed with TCEQ, Permian Basin oil and gas facilities also
release a large amount of unpermitted pollution during equipment breakdowns, maintenance,
and other non-routine so-called “emission events.” Because many oil and gas production
facilities are interconnected to other similar facilities and to pipelines, a breakdown at one
site often sparks a chain reaction, causing simultaneous releases of pollution up and down
the supply chain.
In recent years, a new and disturbing trend has become evident: oil and gas production
facilities, which have historically been considered to be relatively small sources of air
pollution, are emitting more air pollution during unpermitted “emission events” than during
routine operations, and more than their Clean Air Act permits allow. 13
However, controlling air pollution in West Texas has not been a priority for the state, as
evidenced by the scarcity of air pollution monitoring stations in the Permian Basin. And yet,
the type of air pollution in the Permian Basin – dominated by excessive emissions of sulfur
dioxide and hydrogen sulfide – is known to have serious environmental and public health
consequences.

                                                                                                 4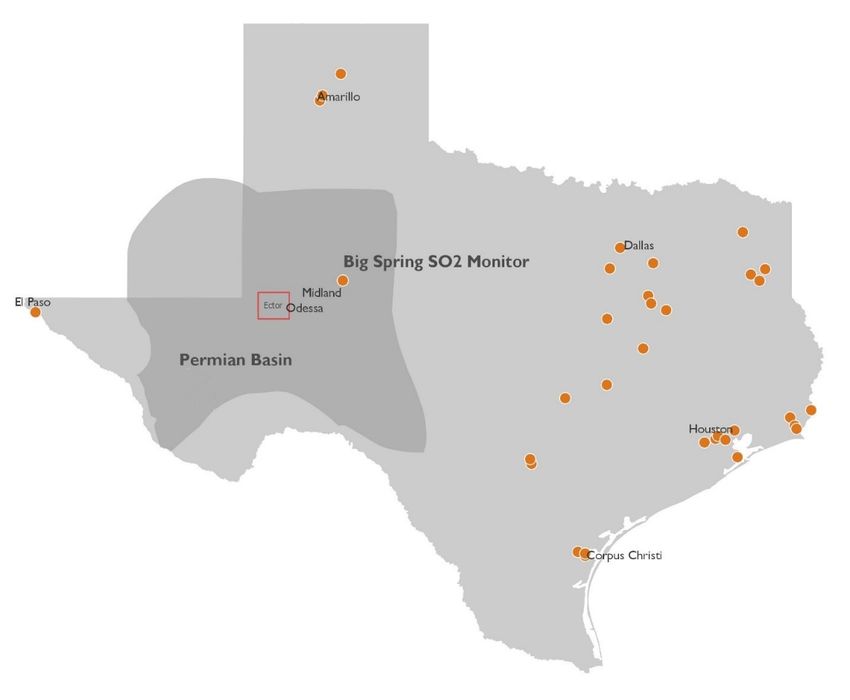
Health Impacts of Sulfur Dioxide and Hydrogen Sulfide
Sulfur dioxide (SO2) forms when substances containing sulfur, including coal, oil, and gas,
are burned. According to EPA, short-term exposures to sulfur dioxide can harm the human
respiratory system and make breathing difficult. Children, the elderly, and those who suffer
from asthma are particularly sensitive to sulfur dioxide. The pollutant also reacts with other
compounds in the atmosphere to form dangerous soot-like fine particles (also known as
particulate matter), which can penetrate deeply into sensitive parts of the lungs and cause
additional health problems. 14 Studies show correlations between short-term exposure to
sulfur dioxide and increased visits to hospital emergency rooms. Children, the elderly,
asthmatics, and those who exercise regularly are most at risk. 15

Historically, extremely high concentrations of sulfur dioxide caused – for example --
London’s Great Smog of 1952, which killed at least 10,000 people and hospitalized 200,000.
Since that era, better emission controls and decreased use of coal have done much to reduce
atmospheric concentrations of SO2.

Hydrogen sulfide is best known for a rotten egg smell that is often associated with oil and
gas production. At low levels this acid can cause causes headaches, breathing problems, and
irritation of the eye, nose, and throat. Long-term exposure can lead to miscarriages, poor
memory, and dizziness. Very high concentrations cause coma and even death. 16
Natural gas fields in New Mexico, Arkansas, West Texas, and north-central Wyoming are
well known for having “sour gas,” which is gas with high concentrations of hydrogen
sulfide. Because this gas is heavier than air, it can pool in low-lying areas when the wind is
not blowing. In February 1975, a hydrogen sulfide release killed eight people in a home near
an oil and gas site in the West Texas town of Denver City. 17

Environmental Impacts of Pollutants
Sulfur dioxide and hydrogen sulfide are not only dangerous for people, but can also acidify
soils and water. The pollutants harm trees and plants by decreasing growth and damaging
foliage. Sulfur dioxide and hydrogen sulfide also react with other compounds in the air to
form haze that reduces visibility in national parks and wilderness areas. 18 Sulfur dioxide is
also one of the key pollutants that forms acid rain, which can leach aluminum particles from
soil and clay, killing fish, insects, and plants.

Other wildlife is harmed by sulfur dioxide and hydrogen sulfide in much the same ways as
people are, primarily through respiration. Hydrogen sulfide acts such the same way on all
vertebrate species that breathe, such as in migratory birds, mammals, and certain reptiles
and amphibians. 19

                                                                                             5
West Texas Residents Bear a Heavy Health Burden
An article published in the Journal of Environmental Science and Technology on January 27,
2018, estimates that air pollution “emission events” in Texas cause $150 million per year in
health costs. 20 The authors acknowledge that this cost is likely an underestimation, because
it is based only on premature deaths from fine particle pollution. Figure 1 shows the
distribution of the health costs, with some of the highest in the Permian Basin.
Figure 1: Distribution of Health Costs From Unpermitted Emissions Across Texas
This map shows the distribution of estimated health costs due to unpermitted emissions from industrial facilities based on a
2018 study in the Journal of Environmental Science and Technology. The highest concentration of dark red zones –
showing highest costs – are in the Permian Basin in West Texas.
Sulfur dioxide is the most prevalent air pollutant released by facilities in the Permian Basin,
according to Texas’ database of unauthorized emission events.
The Clean Air Act requires EPA to protect human health from this pollutant by setting
maximum limits on the amount of sulfur dioxide that can be present in outdoor air. These
limits, called primary National Ambient Air Quality Standards, are based on short- and
long-term exposure. The current health-based standard is 75 parts per billion (which is
equivalent to 196 micrograms per cubic meter) based on the 3-year average of the 99th
percentile of the yearly distribution of 1-hour daily maximum concentrations. 21
6A total of 258 facilities in Texas’ Permian basin reported releasing 27 million pounds of
unauthorized sulfur dioxide (SO2) in 2017. See table below.
Table 1: Unauthorized SO2 Emissions Reported in Permian Basin Counties, 2017
County 2017 # Facilities that # of Events Total
Population Reported Reported Unauthorized
Estimate Unpermitted SO2 SO2 Releases
Releases (lbs)
Ward 11,472 7 64 8,281,725
Ector 157,087 109 782 5,335,754
Andrews 17,722 26 299 4,234,912
Gaines 20,638 18 212 3,161,380
Crane 4,740 36 320 3,041,220
Yoakum 8,568 10 77 862,064
Howard 36,040 10 99 706,390
Hockley 23,088 3 29 532,136
Pecos 15,634 4 86 331,249
Reagan 3,710 3 38 271,003
Winkler 7,574 5 47 154,422
Reeves 15,281 2 41 146,052
Scurry 17,050 4 6 73,700
Dawson 12,813 3 31 51,950
Kent 763 2 13 36,504
Glasscock 1,348 2 9 21,915
Mitchell 8,468 4 12 10,137
Cochran 2,851 1 7 6,716
Martin 5,626 3 4 4,013
Crockett 3,564 1 4 3,852
Garza 6,528 1 3 2,444
Coke 3,306 1 1 798
Upton 3,663 3 10 126
Total: 387,534 258 2194 27,270,462
As the data indicate, the largest emissions occurred in Ward, Ector, Andrews, Gaines, and
Crane counties. Facilities in each county reported releasing between 3 million and 8.2
million pounds of unauthorized SO2 in 2017. Ector County, which has the highest
population of these counties, had the second highest number of unauthorized releases.
A large number of facilities that reported unauthorized emissions are owned or operated by
a small handful of companies, as shown in Table 2 below. For example, Occidental
Permian owns 74 facilities that released 10.6 million pounds of sulfur dioxide during 500
incidents in 2017. XTO Energy (an Exxon subsidiary) owns 42 facilities that reported
releasing nearly 2.4 million pounds of unauthorized sulfur dioxide during 359 incidents.
7Table 2: Ten Companies Responsible for the Most Unauthorized SO2 Releases in
the Permian Basin, 2017
Company # # Events Unauthorized
Facilities Reported SO2 (lbs)
Occidental Permian Ltd. (CN600755086) 74 500 10,618,267
Chevron U.S.A. Inc. (CN600132484) 6 76 5,015,784
XTO Energy Inc. (CN600601348) 42 359 2,387,124
ConocoPhillips Co. (CN601674351) 37 315 1,863,664
Hess Corp. (CN600132245) 3 20 1,760,370
James Lake Midstream, LLC (CN604509893) 1 106 1,214,775
DCP Operating Co. LP (CN601229917) 11 76 923,794
OXY USA Inc. (CN604677401) 9 52 559,618
Burlington Resources Oil & Gas Co. LP (CN602989436) 18 170 531,261
Kinder Morgan Production Co. LLC (CN603227380) 4 21 412,371
Some of the companies responsible for the most unauthorized SO2 emissions own or operate
large gas processing plants and acid gas disposal wells. For example, Canyon Midstream
(James Lake Midstream), operator of the James Lake Gas Plant in Ector County, reported
106 events that resulted in the release of 1.2 million pounds of sulfur dioxide. According to
state reports, nearly all of these emissions were associated with flaring due to problems with
the facility’s acid gas injection well.
The 10 facilities that reported the most unauthorized sulfur dioxide pollution in 2017 are
listed below.
Table 3: Facilities that Reported the Most Unauthorized SO2 in the Permian Basin,
2017
Company Site County # Events Total
Unauthorized
SO2 (lbs)
Occidental Permian Ltd. Sealy Smith Clearfork Satellite 7 Ward 10 6,759,756
Chevron U.S.A. Inc. Mabee Ranch CO2 Plant Andrews 29 2,925,848
Hess Corp. Seminole Gas Processing Plant Gaines 18 1,680,384
Chevron U.S.A. Inc. J.T. McElroy 202 TB Crane 17 1,483,836
James Lake Midstream LLC James Lake Gas Plant Ector 106 1,214,775
DCP Operating Co. LP Goldsmith Gas Plant Ector 36 792,238
Occidental Permian Ltd. Sealy Smith Clearfork Satellite 3 Ward 13 538,448
Chevron U.S.A. Inc. McElroy Section 199 Emergency Crane 14 505,427
Flare
Occidental Permian Ltd. Sealy Smith Clearfork Satellite 8 Ward 12 478,356
XTO Energy Inc. Goldsmith CO2 Pilot Phase II Ector 8 468,752
Facility
Seven of these 10 facilities listed in the above chart have state air pollution control permits
(called “Permits-by-Rule”) that are intended for small sources that emit no more than 25
8tons per year of sulfur dioxide. However, as shown in Figure 4 on page 12, these seven
plants released far in excess of the 25-ton limit in 2017. This means that the emissions were
illegal and that Texas should require these plants to obtain and follow stricter air pollution
control permits.
Texas Lacks Adequate Air Monitors in the Permian Basin
The federal Clean Air Act requires states to monitor ambient air quality to protect public
health. EPA regulations require states to monitor sulfur dioxide levels in areas that satisfy
certain population and emission level requirements. Monitors are also required near large
emitters (>2,000 tons per year of SO2). Due to the small population in the Permian Basin
(approximately a quarter of a million people live in Midland-Odessa), neither Texas nor
EPA has seen fit to monitor sulfur dioxide levels associated with Permian Basin oil and gas
production. 22
The closest sulfur dioxide air monitor to Odessa is located in Big Spring, over 60 miles to
the northeast of Odessa, and that monitor was established to measure air quality adjacent to
a particular oil refinery. Even so, between December 2016 and April 2018, that monitor
recorded 30 hours in which sulfur dioxide concentrations reached levels above the federal 1-
hour standard of 75 ppb. Recorded concentrations during these times ranged from just over
75 ppb to as high as 460 ppb.
Figure 3: Locations of Active Sulfur Dioxide Monitoring Stations in Texas
The red dots indicate the locations of sulfur dioxide monitoring stations across Texas in December 2018. Although the
oil and gas industry is booming in the Permian Basin (marked in darker gray), air quality monitoring there is sparce –
with only one SO2 monitor. 9Modeling Shows Ector County is Flunking Air Quality Standard for
Sulfur Dioxide
Because there are no sulfur dioxide air pollution monitors in Ector County, 23 the
Environmental Integrity Project used an EPA-approved air dispersion model to determine
the effects of oil and gas emissions on local air quality. We modeled industry reported
emission events in Ector County between 2014 and 2017. EIP conducted the modeling in
this location with the understanding that similar air quality impacts are likely in other parts
of the Permian where there are large releases of SO2.
Table 4 shows the largest sources of unauthorized sulfur dioxide emissions in Ector County
in 2017. The two top facilities are large gas plants located in Goldsmith, Texas, that together
reported 142 events and released over 2 million pounds of unauthorized sulfur dioxide
pollution.
Table 4: Largest Sources of Unauthorized SO2 Emissions in Ector County, 2017
Company Site County # Unauthorized
Events SO2 (lbs)
Canyon Midstream/James James Lake Gas Plant Ector 106 1,214,775
Lake Midstream LLC
DCP Operating Co., LP Goldsmith Gas Plant Ector 36 792,238
XTO Energy Inc. Goldsmith CO2 Pilot Phase II Ector 8 468,752
Facility
ConocoPhillips Co. Embar 2 - WCAB Ector 11 222,249
XTO Energy Inc. CAG Central Battery No 448 Ector 5 197,143
XTO Energy Inc. GSAU 2 2 Battery Ector 9 188,773
Occidental Permian Ltd. North Cowden Unit South Ector 12 149,916
Central Tank Battery
Occidental Permian Ltd. OB Holt R Lease TB 1 Ector 2 92,977
ConocoPhillips Co. Gandu Battery 34 Ector 21 92,117
Occidental Permian Ltd. Rhodes Cowden Unit Central Ector 4 84,895
Battery
Using the above data, we conducted air dispersion modeling using the regulatory model that
EPA and the State of Texas require, called AERMOD, to estimate the air quality impacts of
unauthorized SO2 emissions in Ector County. We ran the air dispersion model, using the
industry self-reported emission events for calendar years 2014 – 2017, and National
Weather Service meteorological data for the days and times that the emissions events
occurred. We obtained source parameters (i.e., the location, height, and other
specifications) for the flares and other emission points from publicly available databases. 24
(For more on methodology, see Appendix A).
10In Ector County, over the four-year study period, a total of 155 sources reported 2,564
separate emission incidents (mainly flaring events), including 495 in 2014; 669 in 2015; 568
in 2016; and 832 in 2017.
Figure 3: Locations of the Pollution Sources Included in the Modeling Study
The red dots indicate the locations of the 155 sources of oil and gas industry emissions included in the EIP analysis, with
the blue square depicting Ector County. The sources cluster north and west of the city of Odessa, exposing residents to
potentially harmful air pollution.
11The total amount of sulfur dioxide emitted from all 155 sources for all four years was 15,270
tons, or an average of 3,818 tons of unauthorized sulfur dioxide pollution per year. Overall,
the average incident lasted 70.3 hours and released 11,911 lbs of sulfur dioxide. The overall
average emission rate for all incidents was 169.5 lb/hr (with a wide variation). 25
Results
Over a four-year period, from 2014 through 2017, roughly 35 percent of Ector County
experienced sulfur dioxide air pollution levels in excess of the federal health-based standard,
as shown in the map below. The model results indicate that in each year, oil and gas flaring
resulted in hundreds of exceedences of the U.S. health-based air quality standard for sulfur
dioxide. 26 In 2015, pollution levels over the national standard covered an an approximate
area of 579 km2, about 25 percent of Ector County.
Figure 4: 4-Year Maximum Modeled 1-Hour Average Sulfur Dioxide Levels
Exceeding Health Standards
Over a four year period, roughly 35 percent of Ector County experienced sulfur dioxide air pollution levels in excess of the
federal health standards (196 micrograms per cubic meter). Occuring mostly Northwest of Odessa, this elevated pollution
corresponded with an area of intense oil and gas industry emissions.
12Recommendations
EPA and the Texas Commission on Environmental Quality share the responsibility to
protect air quality and to stop illegal pollution. While the state agency is on the frontline in
terms of issuing air pollution permits and enforcing emissions limits, EPA has oversight and
enforcement authority. At the state level, the Railroad Commission of Texas also bears
responsibility for issuing most drilling permits. When these regulators fail to protect public
health and the environment, the law allows members of the affected public to hold violators
accountable and to enforce pollution limits.
The state and federal regulators should take the following steps to reduce air pollution in the
Permian Basin:
• Both EPA and TCEQ should expand their air quality monitoring programs for the
Permian Basin, including establishing stationary air monitors in and around
Odessa.
• Because EPA’s air quality determinations using information gathered from the new
air quality monitors will take years to complete (according to the usual EPA
regulatory process), EPA should immediately conduct its own modeling to
determine whether areas in the Permian Basin meet the national ambient air quality
standards. EPA should also initiate the formal, public, information-gathering
request and rulemaking process to gather information from the industry and the
public, and to ensure all stakeholders participate in this determination.
• EPA and TCEQ should strengthen air pollution control permits in the Permian
Basin, including by reviewing Texas’ reliance on the less-stringent standard permits
and “permits-by-rule” in oil and gas production, processing, storage, and
transportation. Texas should also ensure that all major sources of air pollution
obtain appropriate major source permits. The goal is to ensure that all sources of
potentially dangerous air pollution have enforceable permits that protect public
health.
• TCEQ should revise its rules and policies on unpermitted air pollution incidents,
such that all unauthorized emissions over a threshold level determined by the state
should be subject to automatic penalties.
• EPA and the State of Texas (both the TCEQ and Railroad Commission) should
exercise their enforcement authority by investigating and prosecuting those
operators in the Permian Basin who routinely violate anti-pollution rules and their
permit limits.
• TCEQ should review its policy allowing industrial emitters to avoid compliance
simply by filing timely reports about unpermitted emissions. TCEQ should adopt a
rule specifying the factors that the agency will use in exercising enforcement
discretion for emission events. The rule should specify that penalties will apply for
any emission event over a certain threshold and for which the root cause has
occurred more than once before. For all other emission events, the TCEQ should
exercise its enforcement discretion as long as the operator provides proof that the
13source employs the best available control technology to control emissions, and that
the incident did not contribute to an exceedance of any national ambient air
standard.
With common-sense steps like these, there is no reason that oil and gas producers in the
Permian Basin cannot comply with air pollution rules that ensure and safeguard the health
of the people of West Texas.
14ENDNOTES:
1
NGI’s Shale Daily, “Information on the Permian Basin”. https://www.naturalgasintel.com/permianinfo
2
RBN Energy LLC, PowerPoint Presentation (The Big Picture, Module 1), Permicon Conference, Houston,
Texas, October 18, 2018.
https://rbnenergy.com/sites/default/files/static_pages/permicon_brochure_20180830.pdf
3
New IHS Markit Outlook – “Stunning” Permian Basin Oil Production to More than Double from 2017-
2023, Exceeding Expectations. BusinessWire, June 13, 2018.
https://www.businesswire.com/news/home/20180613005357/en/New-IHS-Markit-Outlook-–-“Stunning”-
Permian.
4
“As oil and gas exports surge, West Texas becomes the world’s ‘extraction colony,’” by Kiah Collier, The
Texas Tribune and Jamie Smith Hopkins and Rachel Leven, Center for Public Integrity, published Oct. 11,
2018, available at: https://www.texastribune.org/2018/10/11/west-texas-becomes-worlds-extraction-colony-
oil-gas-exports-surge/
5
See, “Report: Unauthorized air pollution in Texas up 27 percent in 2017,” Texas Tribune, by Kiah Collier,
published Jan. 31, 2019, available at: https://www.texastribune.org/2019/01/31/environment-texas-report-
unauthorized-air-pollution/ (the report found that the TCEQ’s Midland region, located in the heart of the
Permian Basin, accounted for more than half of the statewide total of unauthorized air pollution in 2017, more
than even the Houston region which suffered from pollution releases during Hurricane Harvey.
6
"Understanding Excess Emissions from Industrial Facilities: Evidence from Texas," Nikolaos
Zirogiannis, Alex J. Hollingsworth, and David M. Konisky, Environmental Science and Technology 52 (5): 2482-
2490 (2018)
7
Environment Texas study, using TCEQ data obtained by the Environmental Integrity Project, “Major
Malfunction:
Air Pollution from Industrial Malfunctions and Maintenance in Texas in 2017,” January 2019. Link:
https://environmenttexas.org/sites/environment/files/reports/TX_MajorMal_scrn.pdf
8
GeoTAM, TCEQ
https://tceq.maps.arcgis.com/apps/webappviewer/index.html?id=ab6f85198bda483a997a6956a8486539
9
See, https://www.tceq.texas.gov/airquality/monops/sites/monitors_map.html (Map of all Texas air quality
monitoring stations); See, https://www.tceq.texas.gov/cgi-bin/compliance/monops/monitors.pl?region=07
(listing three “active” air monitoring stations in the Odessa-Midland TCEQ region)
10
See, TCEQ Site Information for CAM 1072 (Big Spring Midway), March 2018, available at:
https://www.tceq.texas.gov/cgi-bin/compliance/monops/monthly_summary.pl
11
See, https://www3.epa.gov/ttn/naaqs/standards/so2/s_so2_history.html. 75 parts per billion sulfur
dioxide is equivalent to 196 micrograms per cubic meter.
12
See, NGI’s Shale Daily “Severe ‘Takeaway Capacity Disorder’ Striking Permian, Says RBN Chief,”
November 8, 2018. https://www.naturalgasintel.com/articles/116414-severe-takeaway-capacity-disorder-
striking-permian-says-rbn-chief; “Cryogenic gas processing plants cropping up throughout basin,” Midland
Reporter-Telegram, February 3, 2018. https://www.mrt.com/business/oil/article/Cryogenic-gas-processing-
plants-cropping-up-12547366.php
13
See, Environmental Integrity Project. Breakdowns in Air Quality: Air Pollution from Industrial Malfunctions
and Maintenance in Texas; Environmental Integrity Project: Washington, DC, 2016.
14
https://www.epa.gov/so2-pollution/sulfur-dioxide-basics#effects
15
United State Environmental Protection Agency. (2013). Sulfur Dioxide: Health. Available:
http://www3.epa.gov/airquality/sulfurdioxide/health.html
16
U.S Department of Labor. (2005). Osha Fact Sheet. Available:
https://www.osha.gov/OshDoc/data_Hurricane_Facts/hydrogen_sulfide_fact.pdf. Last accessed 26th Jan
2016.
17
“Denver City remembers H2S tragedy,” Lubbock Avalanche-Journal, 09/15/2010.
http://lubbockonline.com/local-news/2010-09-15/denver-city-remembers-h2s-tragedy#.VjpXTGSrRmA
18
EPA, “Sulfur Dioxide Basics.” https://www.epa.gov/so2-pollution/sulfur-dioxide-basics#effects
19
“Hydrogen Sulfide Monitoring Near Oil and Gas Production Facilities in SE New Mexico and Potential
Effects of Hydrogen Sulfide to Migratory Birds and Other Wildlife,” by Joel D. Lusk and Erik A. Kraft, U.S.
Dept. of the Interior, Fish and Wildlife Service, Project Identification Number: FFS 2F41- 200220006.1,
December 2010, at p. 4 (citing Dombkowski, R.A., M.J. Russell, A.A. Schulman, M.M. Doellman, and K.R.
15Olson. 2005. Vertebrate phylogeny of hydrogen sulfide vasoactivity. American Journal of Physiology:
Regulatory, Integrative and Comparative Physiology 288:R243-R252.)
20
"Understanding Excess Emissions from Industrial Facilities: Evidence from Texas," Nikolaos Zirogiannis,
Alex J. Hollingsworth, and David M. Konisky, Environmental Science and Technology 52 (5): 2482-2490 (2018)
21
The threshold of 75 parts per billion of sulfur dioxide in air can also be expressed as 196 micrograms of
sulfur dioxide per cubic meter of air.
22
TCEQ, “Annual Monitoring Networking Plan, 2018” pp. 10-11
https://www.tceq.texas.gov/assets/public/compliance/monops/air/annual_review/historical/2018-
AMNP.pdf.
23
Continuous Air Monitoring Stations (CAMS), available at:
https://www.tceq.texas.gov/airquality/monops/sites/monitors_map.html (Map of all Texas air quality
monitoring stations)
24
The sources were either the TCEQ’s Air Permits Allowables Database, or individual permit application files.
25
The maximum incident duration was 2,659 hrs (or 110 days). Eight incidents had a duration that exceeded
1,000 hours each. The largest incident resulted in the release of more than a million pounds of SO2 and lasted
15.5 days starting in late November 2016. Forty-six incidents had total SO2 emissions exceeding 50 tons.The
highest emission rate was 39,561 pounds of sulfur dioxide per hour, which occurred during a two-hour period
in December 2016. Twenty six (26) incidents resulted in emission rates that exceeded 10,000 pounds per hour;
and 329 incidents resulted in emission rates that exceeded 1,000 pounds per hour.
26
The standard was set by U.S. EPA at 196 micrograms per cubic meter, the 1-hour sulfur dioxide national
ambient air quality standard
16APPENDIX A: METHODOLOGY
The Environmental Integrity Project ran an EPA approved air dispersion model called
AERMOD, which is also used by the state of Texas when it issues air quality permits. We
ran the air dispersion model using the industry self-reported emission events for calendar
years 2014 – 2017 and National Weather Service meteorological data for the days and times
that the emissions events occurred as inputs. We obtained source parameters (i.e., the
location, height, and other specifications) for the flares and other emission points from
TCEQ via publicly available databases and a Public Information Act request.
In some cases, mainly for smaller sources, the specific source parameters were unavailable
in TCEQ records. In these instances, we used conservative inputs as estimates, based on
TCEQ guidance, i.e. tall stack/flare height.
The model results indicate that in each year from 2014 through 2017, oil and gas flaring
resulted in hundreds of exceedences of the U.S. health-based air quality standard for sulfur
dioxide (set by U.S. EPA at 196 micrograms per cubic meter or the equivalent of 75 ppb, the
1-hour sulfur dioxide national ambient air quality standard). In 2015, pollution levels over
the national standard covered an an approximate area of 579 km2, about 25 percent of the
entire Ector County. In 2016, the 1-hour SO2 design value (the modeling result that defines
air quality relative to the national standards) exceeded 400 µg/m3 at 74 receptors in 2016.
The peak design value during all 4 model years was 3,644 µg/m3 (in 2014, located about 1
km NW of the Goldsmith Gas Plant).
17You can also read