Sino Agro Food Company Presentation - Q2 2014 - Sino Agro Food ...
←
→
Page content transcription
If your browser does not render page correctly, please read the page content below
Sino Agro Food
Company Presentation
                Q2 2014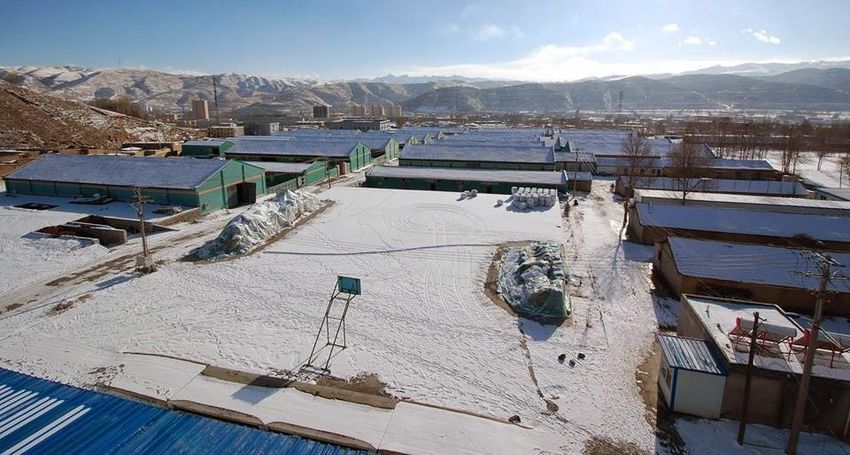
SIAF Cooperate with Local Farmers in the Rearing of Beef Cattle (3/4)

    1. SIAF at a glance

    2. Company Overview

    3. Financial Review

    4. Industry Overview

    Appendix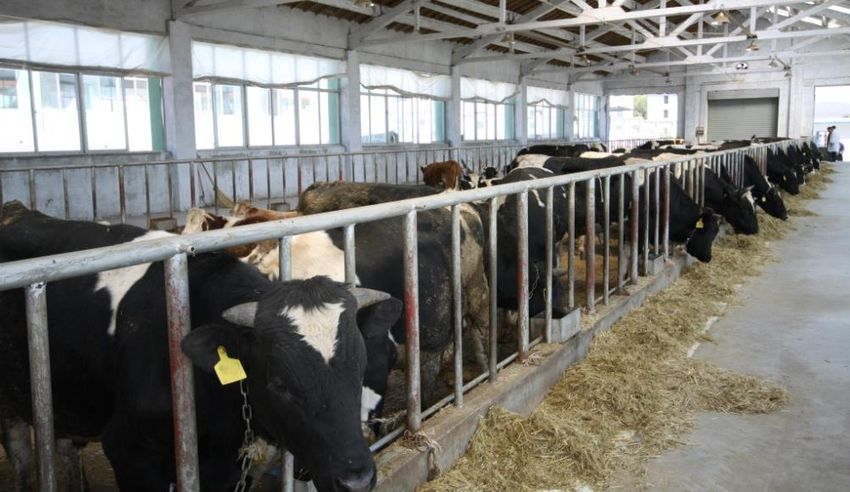
Company overview
• Vertically integrated seafood and beef producer in China
   - Development, production and distribution of high quality seafood and beef
   - Operates in high growth food segments seafood & beef due to China's rising middle class
     and the urbanized population’s demand for higher value and quality food
  - Benefiting from PRC government policies stimulating food production with tax exemption
     and other subsidies
• Revenue growth from 14 US$m in 2006 to 261 US$m in 2013 - CAGR of 52%
   - 2013 EBITDA margin of 37%
                 Core operations                                                                                 Geographic presence
                                                                                               Cattle                          Cattle
   Division      Aquaculture                           Beef cattle                                                             Hunan Province, Linli District
                                                                                               Qinghai Province, Xining City

  Products

   Gross
  margin(1)
                    38%                                      36%
                             54%                                         35%
Share of group
 revenues(2)                                                                                   Aquaculture, Cattle, Vegetable plantation
                                                                                               Guangdong Province, Enping

                     (1)   FY13. Includes both Goods sold and Consulting & Services revenue.
                     (2)   Vegetable plantation share of revenue is not depicted.                                                                      3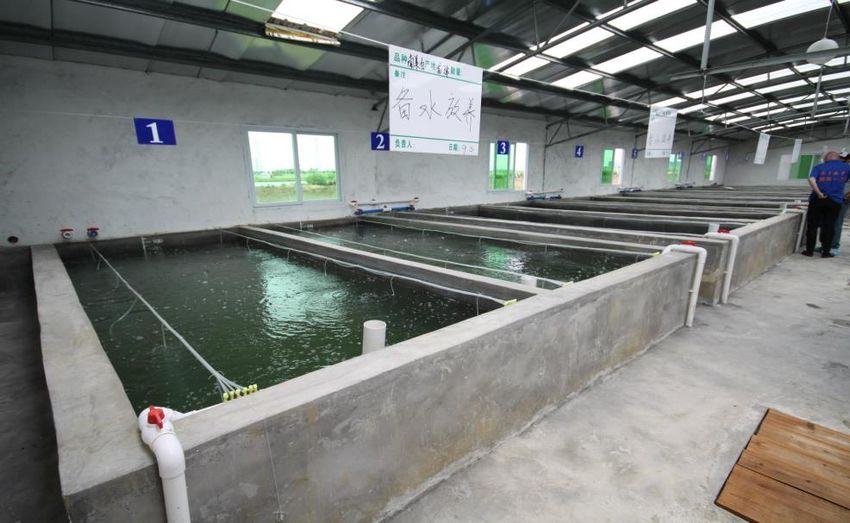
History

• Founded by Mr. Solomon Lee 2006 in Guangzhou, China
• 5-year plan initiated in 2010 focussing on recirculating aquaculture and beef cattle production
• SIAF’s main role has shifted from an agribusiness technology and service provider to a
 producer and marketer of food products

2006            2009                     2010                 2012                     2013                     2014
• Initiates     • Acqusition of          • Begins stocking    • Development of         • SJAP Beef cattle       • Awarded
  business        Vegetable plantation     fish in 1st Fish     wholesale operations     farm awarded             landmark prawn
  activity in     in Guangdong and         Farm                 and distribution         Dragon Head status       farm contract in
  China           SJAP beef cattle                              network                • Vertical integration     Pearl River delta.
                  farm in Qinghai                                                        into meat processing     300 000 MT p.a.
                • Construction of 1st                                                                             framework volume
                  Fish Farm

 Revenue 2006-2013

                                                                                                                              4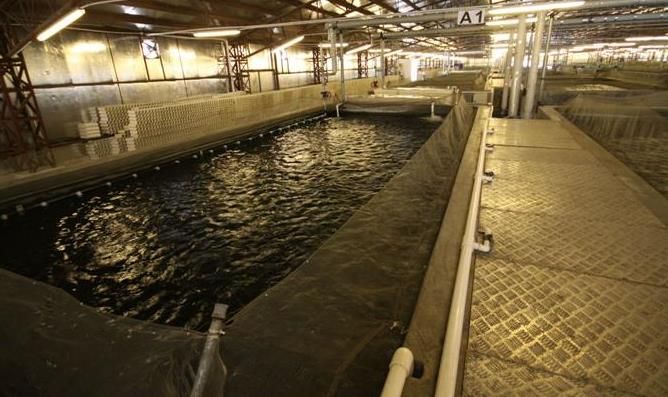
Sideways shareprice development during 2013

      Share price development 2013      Shareholder structure

                                                   39%

                                                                5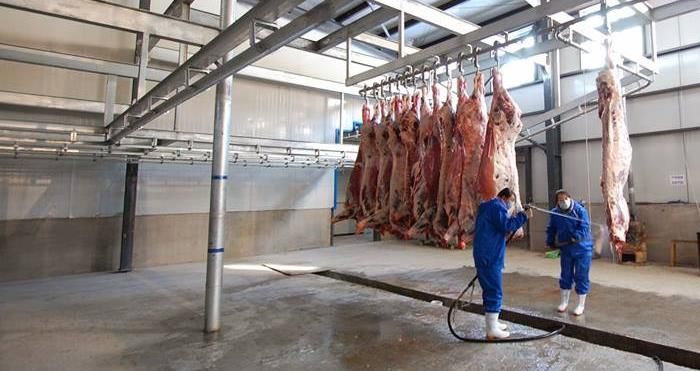
Aquaculture operations
• SIAF’s largest business division
• Rearing and distribution of aquatics including fish and prawns                                        54%
• Development of Recirculating Aquaculture System (RAS) farms                           Sleepy Cod      Grow-out tanks
  together with local Chinese investors                                                                 Fish farm 1

• SIAF is the world’s largest operator and developer of RAS
  aquaculture farms (APRAS)
  - Competitive edge vs. traditional outdoor dams
• 2013 Revenue of 140 US$m, gross profit margin of 33%
                                                                                       Western White    Grow-out tanks
                                                                                       Shrimp           Prawn Farm 1

    SIAF’s APRAS vs. conventional open dam aquaculture farming                      Share of group revenue
                                                               Conventional
                                   SIAF’s APRAS aquatic
             Item                                            Chinese open dam
                                           farms
                                                                  culture
Labour requirement p.a.              1 worker per 50MT*       1 worker per 6MT
Dam water usage                        Water recycled        Changed every year
Energy requirement                 2.5% of production cost   No specified records
Harvesting                             All year round         Once or twice p.a.
Subject to seasonal variation                No                      Yes                               54%
Subject to disease                           No                      Yes
Use of antibiotics and
                                             No                      Yes
chemicals
Mortality rate                           8% or less              Above 25%
Feed to fish conversion rate               2 to 1                  4.5 to 1
Aquatic production per land unit
                                       ~1600 MT/acre            ~40 MT/acre
p.a.

                                                                                                                         6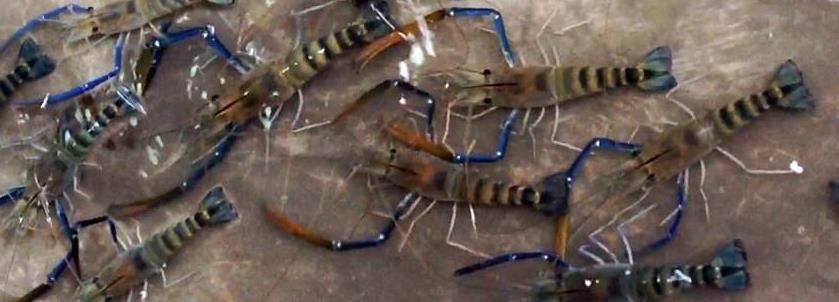
Selection of SIAF’s APRAS aquatic farms

Grow-out tanks, Fish Farm 1 (FF1)   Zhongshan 1,300 acre prawn & hydroponics farm project area

Grow-out tanks, Prawn Farm 1        Hatchery and Nursery grow-out, Prawn Farm 2

                                                                                        7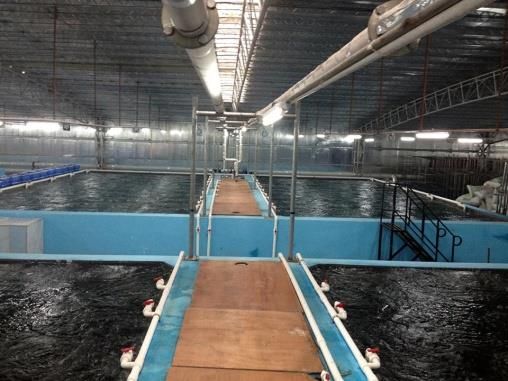
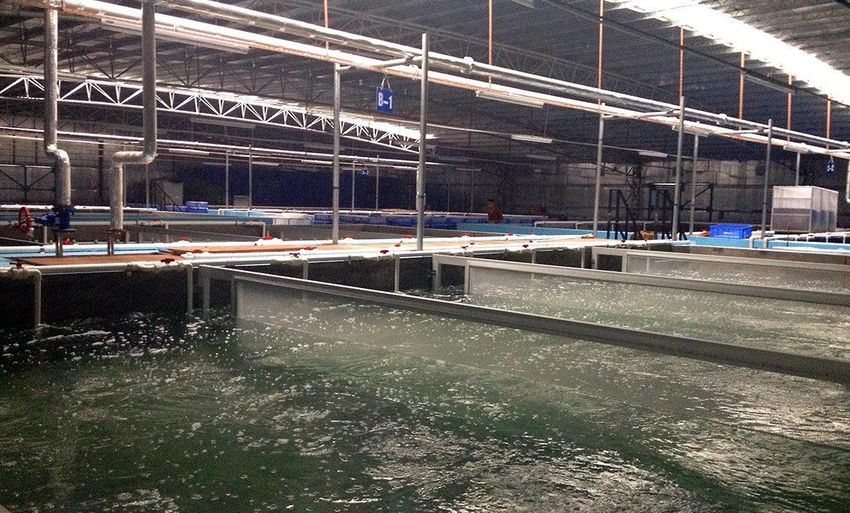
Cattle operations
• Rearing of beef cattle, slaughter and meat
 processing mainly Qinghai province
   -   Vertically integrated from fertilizer and
       feedstock to value-added meat products
   -   Operating high-yield cattle operations in a rural
       region with outdated agriculture practices                 Livestock feed          Beef cattle in SIAF’s cattle houses
                                                                  products

                               Farming model                                       Share of group revenue

   Current primary                      Completion of
     production                   slaughterhouse in Q1 2014
       (tax exempt)

                                                         Value-                                 35%
 Livestock                                               added
                      Cattle     Slaughter   Deboning
    feed                                                  meat
                                                         sales

         Fertiliser

                                                                                                                                8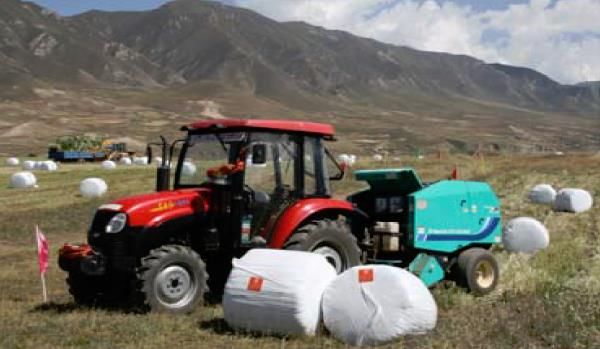
Cattle operations in Qinghai province

Baling of silage                      SJAP Beef cattle houses during winter

Beef Cattle in SJAP’s cattle houses   Slaughter at SJAP slaughter and meat processing facility

                                                                                            9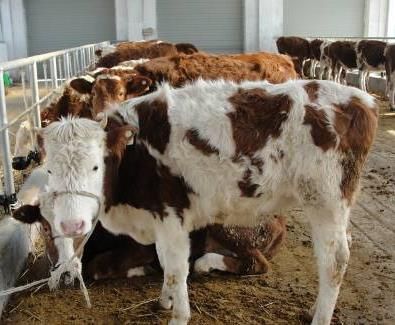
Financial highlights
          Group Revenue (US$m)                             Revenue and EBITDA
                      5-year plan focusing on cattle and
                                 aquaculture

           Net Tangible Assets                             Capital Expenditure

                                                                                 10
1. SIAF at a glance 2. Corporate Strategy 3. Financial Review 4. Industry Overview Appendix
Vertical integration in the food value chain
• SIAF is vertically integrated from feed and breeding stock production to wholesale distribution of
 processed food products.
 -   Improved quality, product yield and margins
 -   Key to maintaining high food safety and quality assurance in an otherwise low-quality environment
 -   Lower dependency on 3rd parties with less exposure to commodity price volatility
• Unlike Europe and North America, Chinese food and agribusiness groups are highly vertically
  integrated
                                                                           Food value chain
                                                                                                                   DOWNSTREAM
                                                                                 UPSTREAM
     Activity type                Production support
                                                                                Food production
                                                                                                          Processing and wholesaling of food
                                                                                                                       products
                                                                                                           Margin uplift, end-consumer and
                        Quality assurance, price control, supply
       Purpose                        assurance
                                                                            Core revenue generation      marketing control, proprietary brands,
                                                                                                              increased barriers of entry

                      • Aquaculture R&D                            • Food production                  • Meat and vegetable processing
                                                                                                      • Marketing and distribution
                      • Rearing of prawn broodstock                • Project development              • Treatment and recycling of cattle and fish
                      • Feed and Fertilizer production                                                  waste
                      • Securing supply of young beef cattle

        SIAF          • Development and education of
                        manufacturers and suppliers
      activities

                                                                                                                                        12
Partnering with Chinese joint venture investors in agribusiness projects
• Agribusiness projects are executed with Joint Venture Partners through Sino Foreign Joint Venture
(SFJV) companies together with targeted local and regional Chinese investors
- The Chinese investor is responsible for procuring land and local labour, while SIAF provide
technology, engineering expertise, supply chain and a share of the project financing
• The SFJV model enable the project financing and provide operational flexibility together with PRC
government backing - which is key to the success of the JV’s
• SIAF have completed five SFJV’s in China with four SFJV project company applications pending
regulatory approval
Process overview
3. Set up of ownership
structure 4. SIAF Ownership
increase
(1) Chinese investor
contributes land while SIAF normally increases
1. Attracting the JV 2. Formation of the JV SIAF provides consultancy ownership to 75%
partner and project management SIAF’s main source of
SJVC agreements are
Prospective investors visit executed with Chinese service income from the project
established SIAF farms investors for project delivery (2)SIAF and its JV partner before operations start
pay for their respective generating revenues and the
share of capex JV share is hiked to 75% is
derived from management
(3)SIAF is given the option to and sales commission fees
retain majority ownership
131. SIAF at a glance 2. Corporate Strategy 3. Industry Overview 4. Financial Review Appendix
Industry Overview
                       • The OECD expects that China’s real GDP will grow by 8.9% in 2014(1)
1
                       • The strong growth in China has delivered major improvements in living standards and poverty has been reduced
       Economic          dramatically recently with China graduating from lower to upper middle-income status(2)
    outlook in China   • Agricultural employment has been falling for a decade at an average rate of 3.5% annually, with massive migration from
                         the countryside to cities. Continuing migration of workers out of agriculture is expected to help boost farming
                         profitability, leading to further gains from mechanisation(1)

2                      • China is the world’s largest agricultural economy
                       • Food is the largest class of household expenditure for all Chinese income groups
     Agriculture in    • Government support to the agricultural sector indicates that policymakers are placing strong support on food
       China(3)          production
                       • Higher incomes lead to preferences for high-value food such as beef and seafood resulting in significant market
                         growth
                       • China is the world’s largest aquatic producer and its market share has risen from 7% in 1961 to 35% by 2010(5)
3                      • China is the world largest aquaculture producer with total cultured aquatic production accounting for ~70% of world total
    The market for     • Prices for aquatic products are expected to grow in 2013 due to increases in the price of feed and other inputs
     aquatic and       • Development of processing, distribution and improved consumer affluence boosts demand for more diversified diets,
    aquaculture in       including seafood
       China(4)        • Demand has increased for imported frozen aquatic products commonly available in supermarkets
                         – Product identification such as brands and country of origin are important tools to attract consumer interest

                       • By 2015 total meat output is estimated to 85 million tons, of which ~63% is pork(6)
4
                       • Since 2007 China has gradually turned into a net importer of meats from previously maintaining self-sufficiency in meat (6)
     The market for    • Beef consumption has risen steadily over the last few years; rising incomes, dietary shift and urbanization are key drivers
    beef and meat in     – Beef consumption is expected to rise by 24% per capita in the coming decade
         China           – Beef is a niche product in China today accounting for only 8% of per capita meat consumption(7)(8)
                       • Further regulation of China's beef industry will likely ensure sufficient supply of cattle and promote beef industry
                         development(8)

                       1)   OECD Economic Outlook No. 92 (database) / OECD economic surveys: China 2013
                       2)   The World Bank; China 2030, Building a Modern, Harmonious, and Creative Society, 2013               6)   China and Hong Kong: Food Opportunities for Maine, March 2012
                       3)   USITC: China’s Agricultural Trade: Competitive Conditions and Effects on U.S. Exports, March 2011   7)   Rabobank
                       4)   USDA’s GAIN Report Number: CH12073 per 12/28/2012                                                   8)   Frost & Sullivan: China’s beef market has great growth potential
                       5)   The State of World Fisheries and Aquaculture 2012, FAO
1 Economic Outlook in China
China’s real GDP growth estimated to 8.9% in 2014 with growth during next 10Y forecasted to average
8%(1)
• China’s economy is at present second only to that of the United States, having
Real GDP growth
overtaken Japan’s role as number two in 2010(2)
– China’s real GDP estimated to grow by 8.9% in 2014(1) (%)
– China is expected to become the worlds’ largest economy in 2017 with 10,0
18.3% of the world economy(3)
8,0
• The strong growth in China has delivered major improvements in living
standards and poverty has been reduced dramatically(4) Based on World Bank 6,0
classification, China recently graduated from lower to upper middle-income 4,0
status
– A growing emphasis on improving access to health and education as well 2,0
as high investments in infrastructure has spread the benefits of growth
nationally including rural areas, where incomes have enjoyed consistently 0,0
2012A 2013E 2014E
strong gains -2,0
– Recent simulations suggest that China could maintain high, though Euro Area USA Brazil Russia India China
gradually easing, growth during the current decade, averaging 8% in per
capita terms Chinese and US share of global GDP
(% of global GDP)
• The share of the population aged 20 to 64 in the total population is expected to
peak soon, and the elderly dependency ratio will continue to rise, exerting 25
downward pressure on saving rates
20
– Agricultural employment has been falling for a decade at an average rate of
3.5% annually, with migration from the countryside to cities. Continuing 15
migration of workers out of agriculture is expected to boost farming
profitability, leading to gains from more mechanisation 10
o Consolidation of farms into bigger units may occur provided that the
laws governing the ownership of rural land-use rights are changed to 5
allow the sale of use-rights and favour the rental market for agricultural
land(5) 0
2000 2002 2004 2006 2008 2010 2012 2014E 2016E
China USA
1) OECD Economic Outlook No. 92 (database)/OECD economic surveys: China 2013
2) The World Bank; China 2030, Building a Modern, Harmonious, and Creative Society [pages 3, 376-377], 2013
3) IMF, October 2012
4) The World Bank; China 2030, Building a Modern, Harmonious, and Creative Society, 2013 [pages 3, 376-377 16
5) OECD Economic Surveys China, March 2013 [Pages 20-21]]2 Agriculture in China (1/2)
Government support to the agricultural sector indicates that policymakers are placing a
renewed emphasis on the rural economy
Agriculture in Chinese economy
• China is the world’s largest agricultural economy. It is the leading producer and consumer of many
Investment into agricultural sector
agricultural commodities such as pork and rice central government budget support(3)
– China has historically been successful in meeting its rapidly rising demand for food and fiber by (Billion Yuan in 2008 prices)
increasing domestic production, but has now emerged as a leading global importer of several
600
agricultural commodities
• About 40% of China’s population of 1.3 billion is employed in the agricultural sector with agriculture 500
contributing ~11% to China’s GDP(1)
400
Government support for agriculture 300
• The Chinese central government’s current producer and consumer support(2) policy incentivises the
transition from grain self-sufficiency and low consumer prices toward raising farm household incomes, 200
placing a renewed emphasis on the rural economy
– Indirect support, in the form of general services, is very high relative to similar support programs 100
in other countries, due largely to investments in agricultural infrastructure
0
o General services include modern research and extension services, food safety agencies,
1984 1989 1994 1999 2004 2009
and agricultural price information services which provide benefits to producers and
consumers throughout the economy(1)
Per capita food consumption development 1980 - 2009(3)
Agricultural consumption
• China is a major global consumer of agricultural products (kg/person)
120 60
• The traditional Chinese diet centers around grains and starches staple foods which account for nearly
one-half of the daily caloric intake
100
• Chinese food consumption is influenced by factors including population size, demographics, income,
food prices, and general preferences 80 40
– Per capita income growth and urbanization are the main factors responsible for altering recent
consumption patterns 60
o Rising income translates into higher per capita food consumption
40 20
o Increasing urbanization is driving diversification of food choices because of greater
availability and choice offered through increasingly diverse sales outlet. Urban diets contain
less grain and more processed non staple food items compared to the rural diet. Rural 20
migrants to cities tend to adopt the urban diet (1)
0 0
1980 1990 2000 2009 1980 1990 2000 2009
Rice Wheat Other grains Milk Meat Fish
(1) USITC: China’s Agricultural Trade: Competitive Conditions and Effects on U.S. Exports, March 2011 [pages 1-1 and1-8]
(2) OECD: Producer and Consumer Support (PSE) is defined as the estimated monetary value of transfers from consumers and taxpayers to farmers, expressed as a
percentage of gross farm receipts (defined as the value of total farm production at farmgate prices), plus budgetary support 17
(3) Feeding Growing Food Demand in China , Jikun Huang Center for Chinese Agricultural Policy Chinese Academy of Sciences, April 20122 Agriculture in China (2/2)
Higher incomes and urbanisation are leading to changing food preferences, including the
demand for better quality and safer foods
Expenditure on food
• Food is the largest class of household expenditure for all Chinese income groups
Average per capita annual expenditure of urban households, 2009(2)
• Urban residents spend substantially more on food than their rural counterparts
• Higher incomes lead to an increase in both the quantity and quality of food demanded Miscellanous goods and
services ; 4%
• Demand for higher quantities of food stabilise in top income households while demand for higher-
quality foods continues to rise with income
Education, Cultural and
• Spending on food consumed outside the home is rising Recreation Services; 13%
– Most expenditures are made in restaurants. Although consumption away from the household is Food; 36%
increasing, most foods are still eaten at home. The exception is meat, with about half of all meat
consumed outside the home Transport & Communications
; 14%
Food preferences
• Higher incomes lead to changing food preferences, including demand for better quality, safer and more
varied food
– Income growth and urbanisation is expected to increase demand for a variety of higher quality Healthcare and Medical
foods Services; 7%
Household Facilities, Articles Clothing; 10%
• Similar to other developing countries, the traditional Chinese diet comprises mostly of grains and other and Services ; 6% Residence; 10%
starch staples
– Consumption of non-staple, higher-value foods such as meat (especially pork), dairy, fruits,
vegetables, and processed food has grown significantly in the past three decades
Per capita food consumption in 2009, Urban and Rural split(3)
o 30% of the food currently consumed in China has been processed in some way
(kg)
• The Chinese consume about four times as much pork as poultry, the second most popular animal
protein
120
– Pork consumption has been encouraged by improved cold storage distribution, as the product
can be transported greater distances to reach more customers 100
– Pork consumption levels are also high due to government support programs, including 80
purchasing pork for reserves and occasionally subsidizing pork purchases for low-income
consumers
60
40
• Food quality and safety are important factors affecting Chinese food preferences
– High income urban groups that focus their expenditure on high-quality products also seek 20
assurance that their food is safe 0
– Safety concerns can determine where certain foods are bought: fresh produce is usually Rice Wheat Fruits Red meat and Milk
purchased at a wet market because fresher produce is perceived to be safer, while meats are poultry
increasingly bought at a supermarket because of the availability of cold storage(1)
Urban Rural
(1) USITC: China’s Agricultural Trade: Competitive Conditions and Effects on U.S. Exports, March 2011 [pages 1-1 and1-8]
(2) China Statistical Yearbook 2011 18
(3) Feeding Growing Food Demand in China , Jikun Huang Center for Chinese Agricultural Policy Chinese Academy of Sciences, April 20123 The Market for Aquatic and Aquaculture in China
• China is the world largest aquaculture producer with production accounting for ~70% of world total
• China has the world’s largest aquatic production and its market share has risen from 7% in 1961
to 35% by 2010(1) Aquatic CAGR by production method 2008-2011
Aquaculture
• After China opened up to the outside world in the 1980's, the aquaculture sector has been
growing dramatically, becoming one of the fastest growing agriculture sectors(2)
• China is the world largest aquaculture producer accounting for ~70% of global aquaculture
production 5,6%
• Aquaculture acreage and investments in production expansion is slowing overall
– Government officials relate that environmental concerns and the rapid 4,6%
industrialization/urbanization of China’s coastal regions hamper further aquaculture
expansion
• Fish is the most common type of seafood cultivated through aquaculture with a total production
of 22.8 million tons, accounting for 69% of all aquatic fish production in 2011 2,1%
– Carp remains the most popular cultured freshwater fish accounting for 72% of total
freshwater cultured fish production
Wild catch Fish Farming Total Aquatic Production
Aquatic Consumption
• Development of processing, distribution and improved consumer affluence boosts demand for
more diversified diets, including seafood
Consumption Trends for Fish and other food types in China(4)
• Per capita consumption of aquatic products was 14.6 Kg per urban dweller and 5.4 Kg per rural
inhabitant in 2011
– Per capita consumption is expected to increase steadily, with strong growth potential in the
rural sector
25,000
– The per capita consumption of aquatic products is highest in coastal regions, such as
Shanghai and Guangdong, and locations with relatively high disposable income
20,000
• Prices for aquatic products are expected to grow in 2013, reflecting increases in the price of feed
and other inputs
15,000
Marketing
10,000
• Demand has increased for imported frozen aquatic products commonly available in supermarkets
– Product identification such as brands and country of origin are important tools to attract
consumer interest 5,000
– With the proper display, high-value imported items can be promoted to customers
,0
– Importers claim high value U.S. seafood products are easy to sell in both first and second tier 2009 2010 2011
cities(3) Other Algae Shrimp, Prawn & Crab Shellfish Fish
(1) The State of World Fisheries and Aquaculture 2012, FAO
(2) FAO – National Aquaculture Sector Overview China 19
(3) USDA’s GAIN Report Number: CH12073 per 12/28/20124 The Market for Meat and Beef in China
China is the world’s largest producer and consumer of meat including pork, poultry and beef
with a 27% market share
• China is the world’s largest producer and consumer of meat including pork, poultry and beef with Expected increase in meat demand between 2012 and 2021 by region(3)
a 27% market share
– 2011 Meat production amounted to 79 million tons consisting of ~63% pork Latin America and
o 2015 meat production in is targeted to reach 85 million tons, consisting of ~63% pork Caribbean
according to the Government’s 5-year plan 18%
– Since 2007 China has gradually turned into a net importer of meat from previously
maintaining self-sufficiency in meat(1)
Africa
Meat Market Drivers 8%
1• Improved consumer purchasing power stimulate the growth of beef markets as beef sells
at premium prices and traditionally goes beyond the population's affordable level Other Asia and Pacific
4% 56%
– Rising purchasing power has led to a dietary pattern change switching from consumption of
traditional food grain to an increase in consumption of meat products Europe
– Chinese traditionally employ pork and chicken as meat sources due to beef being considered 6%
expensive
North America
o With the improvement of living standards Chinese have upgraded their meat
8%
consumption to include more beef
– Consumption of red meat is perceived to have higher status than consumption of poultry or Consumption Trends for Pork, Beef, Poultry and Mutton in China(4)
pork
(Per Capita Consumption in kilogram per year) S
2• Chinese people's diet is becoming more diversified and healthy, introducing larger
amounts of beef as beef has nutritional benefits to pork
– Beef has high protein content, low fat content with unsaturated fatty acids, thus making it a 36
healthier kind of meat compared to pork
30
3• Additional regulation of China's beef industry will likely strive to ensure sufficient supply
of cattle and promote the development of the beef industry 24
– Chinese government policies are expected to support the adequate supply of cattle and 18
improve the quality of beef products resulting in safer and healthier beef products and a more
sophisticated beef consumption(2) 12
6
0
2006 2007 2008 2009 2010 2011
Urban Rural
1) China’s growing appetite for meats: Implications for World meat trade. A Multi-Client Study, April 2012
2) China and Hong Kong: Food Opportunities for Maine, Maine International Trade Center, March 2012
Frost & Sullivan: China’s beef market has great growth potential
China’s growing appetite for meats: Implications for World meat trade. A Multi-Client Study, April 2012
3) Meat - OECD-FAO Agricultural Outlook 2012-2021 20
4) 2011 China Statistical Yearbook Table 10-9 and 10-331. SIAF at a glance 2. Corporate Strategy 3. Industry Overview 4. Financial Review Appendix
Income statement
                                                                         Income statement
• Significant revenue growth with maintained       US$m                          2011       2012      2013
 profitability                                      Sales                         51,9      138,6     261,4
 - Rising COGS, increased production capacity       COGS                         (26,4)     (68,2)   (158,6)
                                                   Gross profit                   25,5       70,4     102,8
   and focus on high-growth food niche
   segments                                         SG&A                          (4,4)     (6,6)     (6,6)
                                                   EBITDA                         21,1      63,8      96,2

• Slight above-peer margins due to sale of          D&A
                                                   EBIT
                                                                                  (1,5)
                                                                                  19,6
                                                                                            (2,4)
                                                                                            61,4
                                                                                                      (3,5)
                                                                                                      92,7
 premium products and cost-efficient production
                                                    Extinguishment of debts       1,0        1,7      1,3
 - Lower GP margin FY13 due to lower share of       Net other income/expenses     0,4        0,4      0,8
   high-margin Consulting & Services sales          Interest Expense              (0,0)     (0,3)     (0,4)
                                                    Taxes                          0,0       0,0       0,0
• Low SG&A    expense due to slim organizational   Net Income                     21,1      63,3      94,4
 structure with small HQ overhead                  Key Ratios
                                                   Sales Growth                   375%       167%       89%
• No tax expense due to government stimulus of     Gross profit Margin
                                                   EBITDA Margin
                                                                                   49%
                                                                                   41%
                                                                                              51%
                                                                                              46%
                                                                                                        39%
                                                                                                        37%
 food production sector through tax exemption      Net Margin                      41%        46%       36%
 policies

                                                                                                       22
Balance sheet
Balance sheet
• Prudent financing policy with very limited US$m 2011 2012 2013
Current assets
financial leverage Cash and cash equivalents 1 8 1
- Equity ratio of 90% Inventories
Deposits and prepaid expenses
4
15
17
47
8
92
- ND / EBITDA of 0,05x Accounts receivable 28 53 82
Other current assets 26 8 4
• Growth in NTA due to increases in both retained Fixed assets
Property and equipment 63 100 166
earnings and additional paid-in capital Goodwill 1 1 1
Other fixed assets 14 8 12
TOTAL ASSETS 152 243 368
• High NWC/ Sales ratio due to generous credit Current liabilitites
terms to rural beef cattle farmers and inclusion Accounts payable, accrued expenses 1 6 11
of paid-up capital to future SFJV’s for equity Interest bearing debt 0 3 4
Other current liabilities 15 14 19
stake investments in Deposits and prepaid
Non-current liabilities
expenses Deferred dividends payable - 3 -
Long term interest bearing debt - 0 2
Total liabilities 16 26 36
Equity 135 217 332
TOTAL LIABILITIES AND EQUITY 152 243 368
Net Debt (1,4) (1,9) 4,7
ND / LTM EBITDA 0,0x 0,0x 0,05x
Equity ratio 89% 89% 90%
NWC / Sales 44% 63% 59%
23Cash flow statement
Statement of cash flows
• Increased goods production has improved US$m 2011 2012 2013
Net Income 21 63 94
operating cash flow generation very significantly
Non-cash adjustments 2 3 3
since 2011 Operating CF before ΔNWC 23 66 97
ΔNWC (19) (22) (13)
Operating CF 5 44 84
• Operating cash flow and to a lesser extent Acquisition of property and equipment (0) (11) (7)
external equity finances aggressive expansion Payment for investment in future SFJV's companies
- (included
(6) in deposits
(35) and
Payment for construction in progress (1) (7) (51)
capex outlay in order to sustain high growth and CF from Investing Activities (5) (44) (93)
capitalize on current favourable conditions for Short term bank loan raised - 3 4
beef and prawn production projects – Capex / Short term bank loan repaid - - (3)
sales of 36% Net proceeds of bonds - - 1
Dividends paid (1) (0) (1)
CF from Financing Activities (1) 3 1
• Cash conversion of 88% due to less build-up of Effects of FX rate changes on cash (1) 0 1
NWC despite significant expansion ΔCash and cash equivalents (3) 3 (7)
Cash beginning of period 4 1 8
Cash end of period 1 8 1
Stock issued for settlement of debts 12 18 17
Stock issued for services and employees compensation
4,3 0,4 0,3
Non-cash equity financing transactions 16 18 17
Capex / Sales 10% 32% 36%
ΔNWC / Sales 36% 16% 5%
Cash conversion 22% 70% 88%
241. SIAF at a glance 2. Corporate Strategy 3. Industry Overview 4. Financial Review Appendix
Corporate governance
• Founder, CEO and chairman of the board, Solomon Lee
• SEC reporting since 2011
• Contemplated NASDAQ listing with secondary listing on NASDAQ OMX Stockholm
  - Swedish investment group network with over 300 private and 20 corporate members
   o   Sponsored private placements and ensuing listings of companies such as Nexam and
       Cassandra Oil
 - Main contributor to Swedish ownership
                                                                              Corporate / legal structure
                                                                                               Sino Agro Food

                                                                                                      USA

                                                                                                                                                                 A Power Agriculture
 Sino Agro Food Sweden           Tri-way Industries                              Capital Award                                      Macau EIJI
                                                                                                                                                                    Development
    Aktiebolag (publ)               Hong Kong                                         Belize                                         Macau
                                                                                                                                                                       Macau

                                   Fish Farm 1                   Prawn Farm 2                     Prawn Farm 1   HU Plantation(1)                Cattle Farm 1     SJAP Beef
                                      China                           China                            China          China                         China            China

                                                                                                                  Cattle Farm 2                                     HSA Beef
                                                                                                                      China                                          China
  Aquaculture           Cattle     Other

                                    (1) HU Plantation is an independent business area from cattle operations.
                                                                                                                                                                               26
Board of directors and management
Board of directors
Solomon Lee George Yap Nils-Erik Sandberg Daniel Ritchey Anthony Soh
Chairman, founder and CEO Independent Director, Independent Director Independent Director Independent Director
Australian citizen Chair of Aduit Committee Chair of Compensation Committee US citizen Malaysian citizen
• B.A. Major in Accounting and Malaysian citizen Swedish citizen • MBA in Finance from Ohio State • LL.B (Hons) degree from
Economics from Monash • Chartered accountant with >30 • President of the Jordan Fund, a University University of Hull, England
University , Australia years of experience Swedish investment group • Partner in DC Capital LLC, 3-D Oil • Partner in the law firm Edwin Lim
• 45 years of business and project • Member of Institute of Chartered network, since 1990 & Gas and 3-D Ranch, a 2,200 Suren & Soh, Kuala Lumpur,
development experience Accountants in England and • Adviser for Gustavia Energy and head of cattle/1,500 head pig farm Malaysia
• Involved in building RAS facilities Wales since 1984 Commodities Fund since 2008 • Previous positions as investment • CEO and deputy CEO of Pontian
since 1986 • Head of banking at CSFB in • Founded Hydrocarbon analyst and advisor for venture United Plantations Berhad 2005-
• Managed own businesses since Sydney in 1990-1992 International HCI AB and Grauten capital firms 2013, a 39 000 acre palm oil
the 1980’s, including export of • CFO of the property and Oil AB, both publicly traded plantation and palm mill
primary produce and seafood from privatisation division of the Swedish oil companies, and served
Australia to Asia since 1987 Australian Department of Finance as their CEO in 1986-1993
• CEO of Malaysian aquaculture 1999-2000 • Previously director at International
developer 1993-2004 • CFO of the Australian Parliament Petroleum Corporation, later
in 2000 Lundin Petroleum
Key management team
Solomon Lee Peter Tan Michael Chen
Chairman, founder and CEO Chief Marketing Officer and Director Secretary and Director
Australian citizen Malaysian citizen Taiwanese citizen
• B.A. Major in Accounting and Economics from Monash • Head of the aquaculture division • Director and business development manager of Capital
University , Australia • BA Major in Accounting and Economics in 1972 Award since 2004
• 45 years of business and project development • 28 yrs of food industry experience • Supervisor of Malaysian aquaculture developer 1995-
experience • MD of Malaysian gas appliance manufacturer since 2005 2004
• Involved in building RAS facilities since 1986 • Operating representative on board of directors • Operating representative on board of directors
• Managed own businesses since the 1980’s, including
export of primary produce and seafood from Australia to
Asia since 1987
• CEO of Malaysian aquaculture developer 1993-2004
27Q&A
You can also read