STATUS OF THE LOWER FOOD WEB IN THE OFFSHORE WATERS OF THE LAURENTIAN GREAT LAKES - US EPA
←
→
Page content transcription
If your browser does not render page correctly, please read the page content below
STATUS OF THE LOWER FOOD WEB IN THE OFFSHORE WATERS OF THE LAURENTIAN GREAT LAKES

        STATUS OF THE LOWER FOOD WEB
          IN THE OFFSHORE WATERS OF
         THE LAURENTIAN GREAT LAKES
             Trends for chemical, physical, and biological variables through 2018

                                                                                                 Prepared By:
                                                                 United States Environmental Protection Agency
                                                                           Great Lakes National Program Office
                                                                        77 W. Jackson Blvd., Chicago, IL 60604
March 2021
EPA 905-R-20-007
                                                                                                           GDIT
                                                                3170 Fairview Park Dr., Falls Church, VA, 22042

    MARCH 2021                                                                             PAGE | 1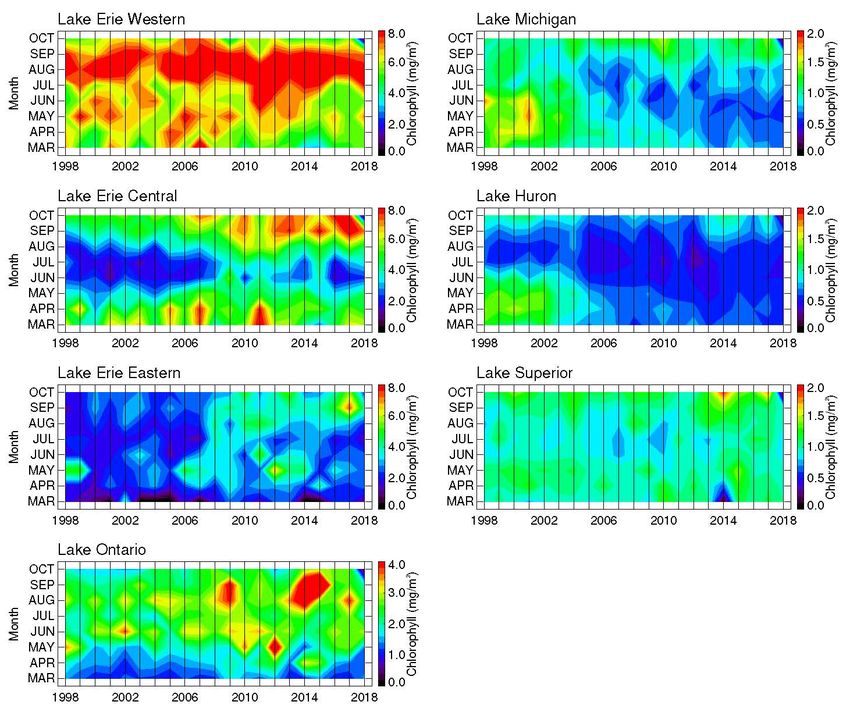
STATUS OF THE LOWER FOOD WEB IN THE OFFSHORE WATERS OF THE LAURENTIAN GREAT LAKES

TABLE OF CONTENTS
List of Figures ...................................................................................................................................... iii
List of Tables ........................................................................................................................................ iii
Acknowledgments ................................................................................................................................. iv
Executive Summary ................................................................................................................................ v
1 Introduction ....................................................................................................................................... 1
2 Methods ............................................................................................................................................. 1
3 Results ............................................................................................................................................... 3
  3.1 Water Quality Variables ............................................................................................................. 3
     3.1.1      Spring Total Phosphorus .................................................................................................. 3
     3.1.2      Spring Soluble Silica ....................................................................................................... 4
     3.1.3      Secchi Depth .................................................................................................................... 4
     3.1.4      Chlorophyll-a ................................................................................................................... 6
  3.2 Biology Variables....................................................................................................................... 9
     3.2.1      Phytoplankton .................................................................................................................. 9
     3.2.2      Crustacean Zooplankton ................................................................................................ 11
     3.2.3      Mysis.............................................................................................................................. 13
     3.2.4      Benthos .......................................................................................................................... 13
4 Conclusions ..................................................................................................................................... 17
5 References ....................................................................................................................................... 20
Appendix A – List of the Sampling and Analytical Standard Operating Procedures ........................... A-1

MARCH 2021                                                                                                                                   PAGE | ii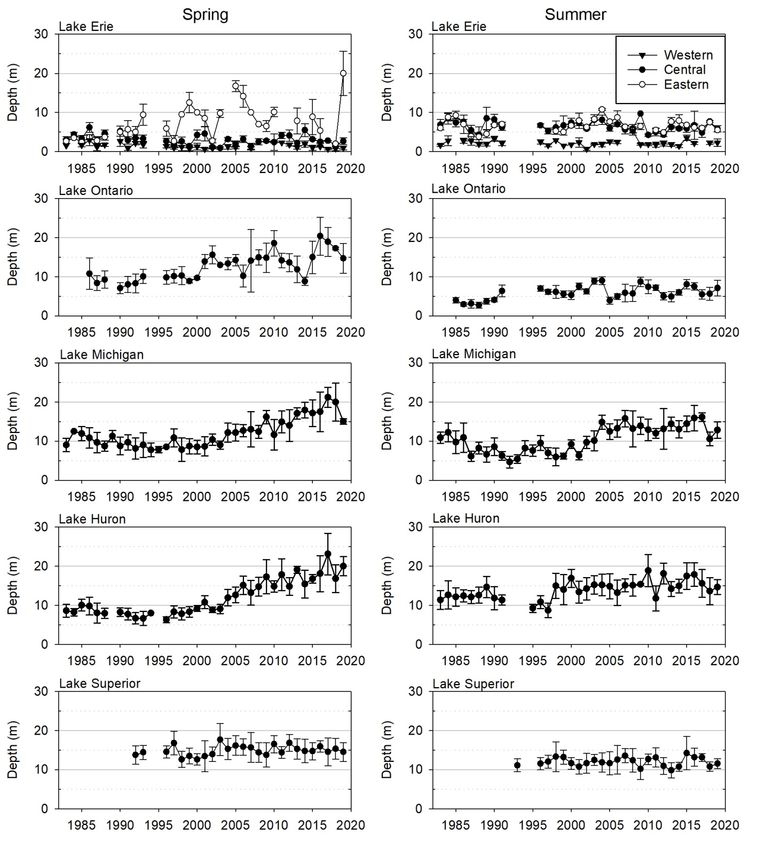
STATUS OF THE LOWER FOOD WEB IN THE OFFSHORE WATERS OF THE LAURENTIAN GREAT LAKES
LIST OF FIGURES
Figure 1. Map of GLNPO long-term monitoring stations for annual spring and summer nutrient and
plankton sampling (includes phytoplankton, zooplankton, Mysis) and summer
benthos sampling..................................................................................................................... 3
Figure 2. Spring total phosphorus (TP) and soluble silica (Si) from 1983 to 2018 in the Great Lakes. . 5
Figure 3. Spring (left panels) and summer (right panels) Secchi depth from 1983 to 2019 in the
Great Lakes. ............................................................................................................................ 7
Figure 4. Monthly averaged (March–October) surface chlorophyll concentrations at GLNPO WQS
station locations in the Great Lakes, 1998–2018. .................................................................... 8
Figure 5. Basin-wide averages of phytoplankton biovolume in spring (left) and summer (right) from
2001 to 2018. ........................................................................................................................ 10
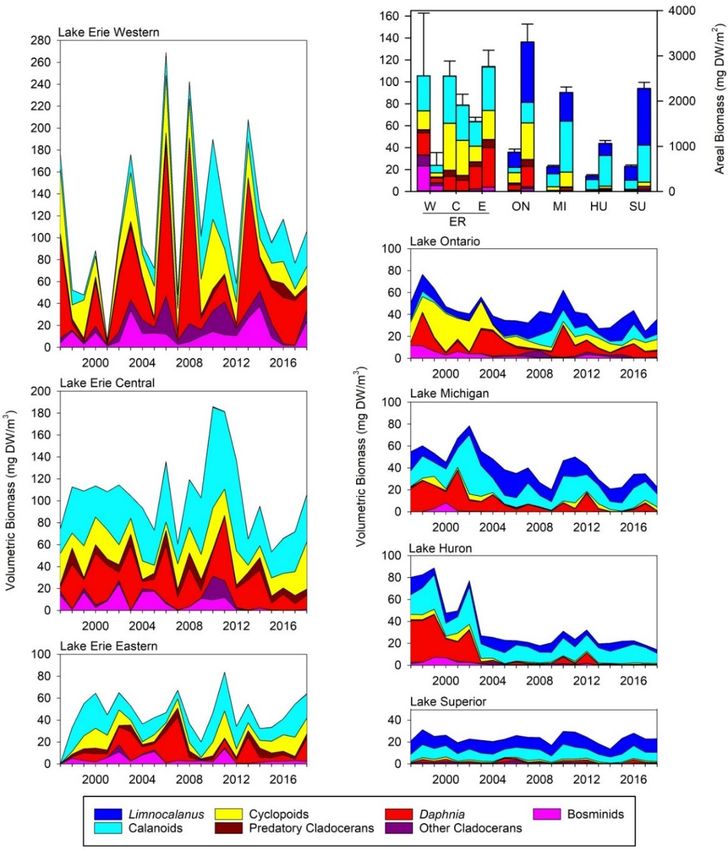
Figure 6. Summer crustacean volumetric biomass (mg DW/m3), by major taxonomic group, for the
Great Lakes, 1997–2018. The upper right graph shows zooplankton volumetric
(left axis; left bars) and areal (right axis; right bars) biomass for all five lakes in 2018. ....... 12
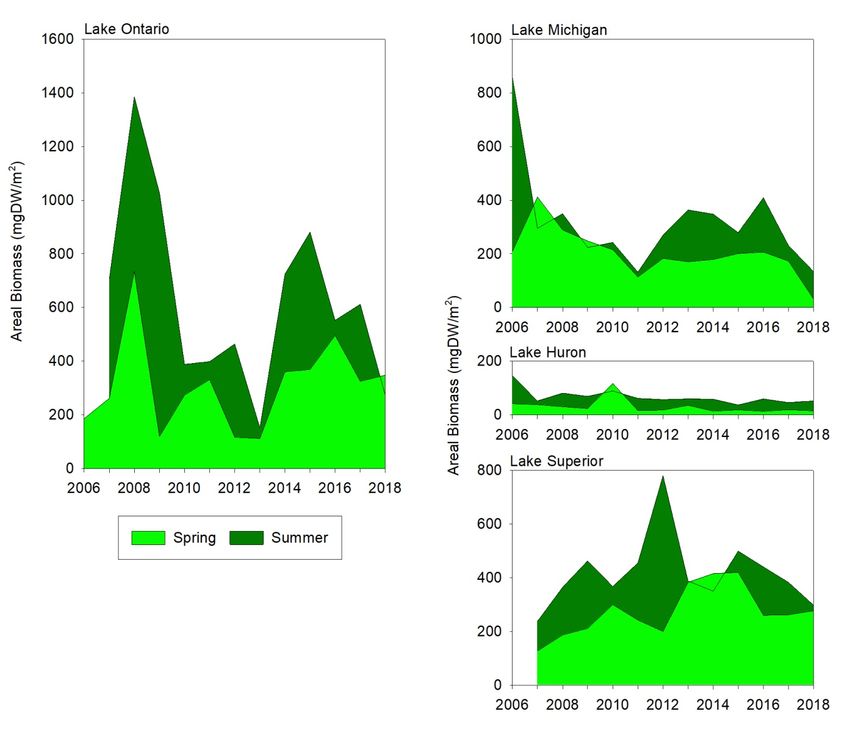
Figure 7. Mysis diluviana areal density (mg DW/m2) from 2006–2018 from stations deeper than 30
meters in Lakes Ontario, Michigan, Huron, and Superior ..................................................... 14
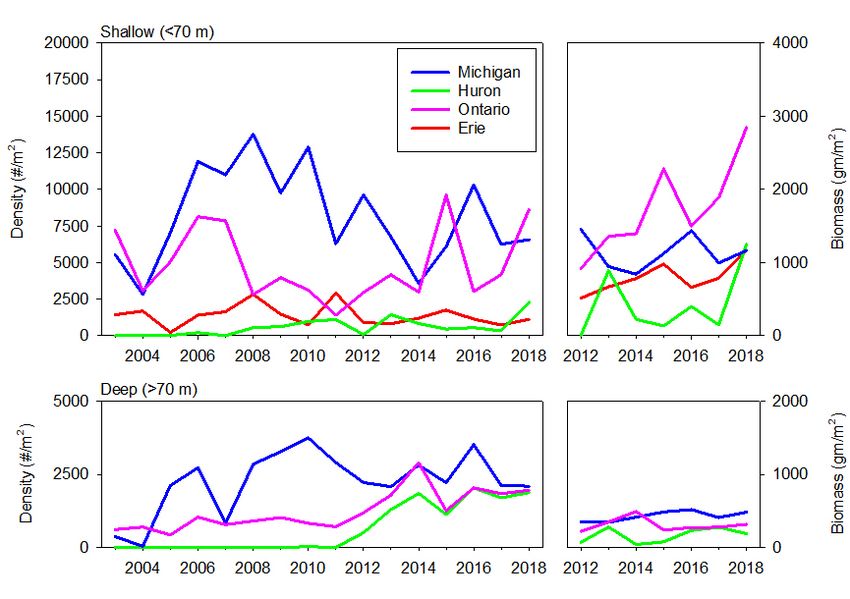
Figure 8. Density (2003–2018) and biomass (2012–2018) of dreissenid mussels for shallow sites
(< 70 m, top plots) and deep sites (> 70 m, bottom plots) in the Great Lakes. . ..................... 15
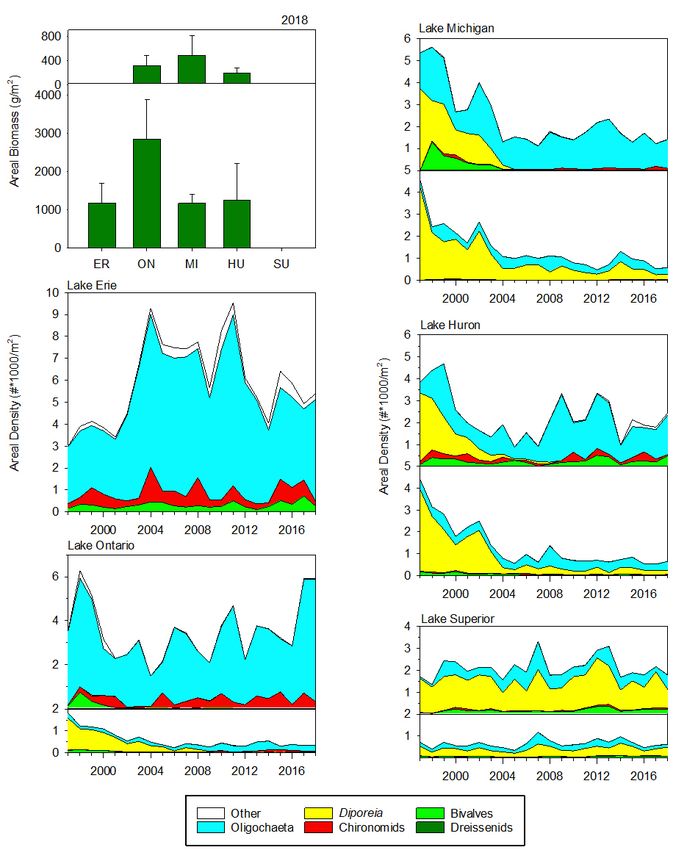
Figure 9. Great Lakes total areal biomass (wet weight) by major taxonomic group for 2018
in all lakes (upper left plot) and areal density by major taxonomic group for 1997–2019 by
individual lake....................................................................................................................... 16
LIST OF TABLES
Table 1. Results of Spearman rank correlations on selected lower food web variables in the
Great Lakes ........................................................................................................................... 19
MARCH 2021 PAGE | iii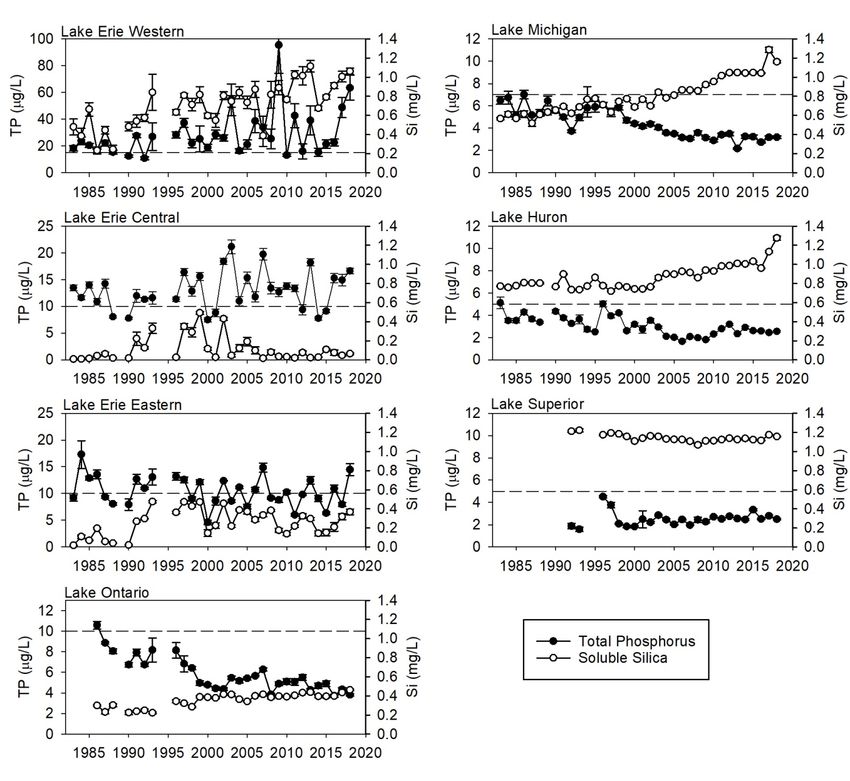
STATUS OF THE LOWER FOOD WEB IN THE OFFSHORE WATERS OF THE LAURENTIAN GREAT LAKES
ACKNOWLEDGMENTS
This work was supported under the Great Lakes Restoration Initiative by the U.S. Environmental
Protection Agency (USEPA) Great Lakes National Program Office (GLNPO) as part of EPA Contract
No. EP-C-15-012, Technical, Analytical, and Regulatory Mission Support for the Water Security
Division, with CSRA, LLC, a General Dynamics Information Technology (GDIT) company, under the
direction of Louis Blume, Project Manager as well as by agreements with Cornell University
(Department of Natural Resources) under award agreement GL-00E01184 from the USEPA “Great
Lakes Long Term Biological Monitoring of Zooplankton, Benthos, and Chlorophyll-a” and with
Regents of the University of Minnesota from the USEPA under award agreements GL-00E23101-2 and
GL-00E01980 “Great Lakes Biological Monitoring: Phytoplankton.” GLNPO gratefully acknowledges
the support of the following team members in the preparation of this Technical Report:
Affiliation Team Member(s)
USEPA GLNPO Elizabeth Hinchey Malloy, Anne Scofield, Eric Osantowski, Nicole
Singleton, Marc Tuchman, Louis Blume
Cornell University Jim Watkins, Lars Rudstam, Toby Holda
Buffalo State College Lyubov Burlakova, Alexander Karatayev
University of Minnesota Euan Reavie
Duluth
GDIT Richard Barbiero, Barry Lesht, Julie Lietz, Molly Middlebrook Amos
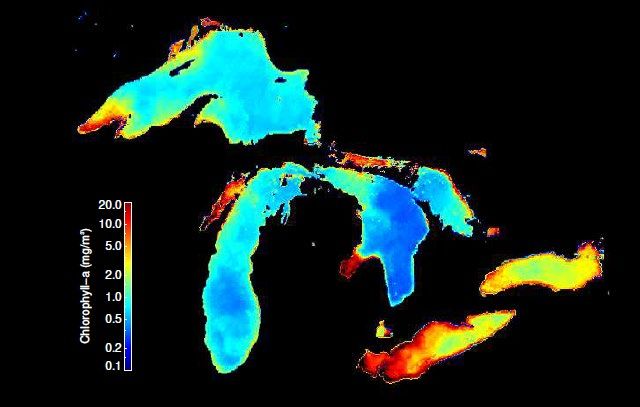
Cover Photo: Satellite-estimated surface chlorophyll-a concentration in the Great Lakes – August 2018
Citation: U.S. EPA 2021. Status of the Lower Food Web in the Offshore Waters of the Laurentian
Great Lakes: Trends for chemical, physical, and biological variables through 2018. EPA 905-R-20-007.
MARCH 2021 PAGE | iv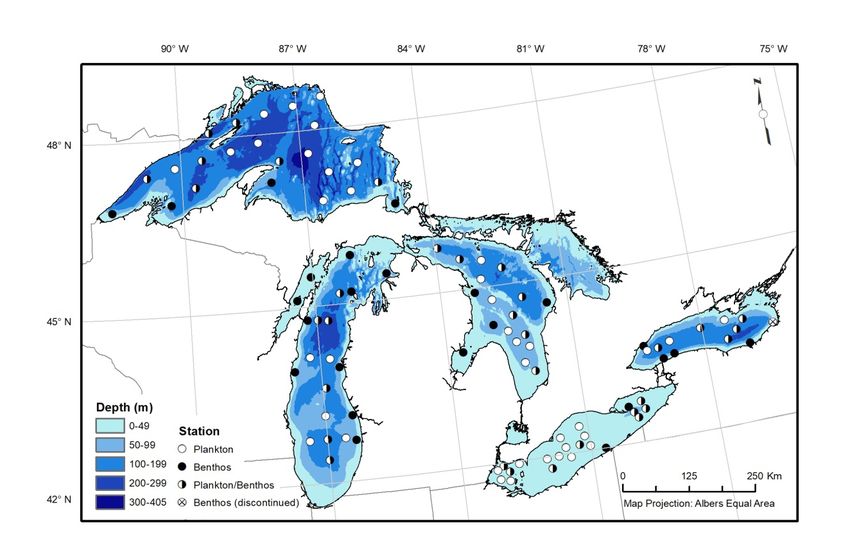
STATUS OF THE LOWER FOOD WEB IN THE OFFSHORE WATERS OF THE LAURENTIAN GREAT LAKES

EXECUTIVE SUMMARY
This report presents data on selected chemical, physical, and biological variables that characterize the
base of the Great Lakes ecosystem in offshore waters.
Lake Erie is currently the only Great Lake in which total phosphorus concentrations consistently
(western and central basin) or intermittently (eastern basin) exceed interim substance objectives
contained in the 2012 Great Lakes Water Quality Agreement (GLWQA). Summer cyanobacterial
blooms are a consistent feature of the western basin, while summer/autumn chlorophyll-a has been
notably higher in the central and eastern basins in the past 10 years. Abundant phytoplankton are likely
contributing to late-summer hypoxia in the central basin. During summer, crustacean zooplankton
biomass (volumetric) is also highest in Lake Erie, although there is considerable interannual variability;
summer biomass is dominated by cladocerans and cyclopoid copepods. There has been no evidence of
directional change in zooplankton or benthos communities in the past decade.
Recent total phosphorus concentrations, transparencies, and surface chlorophyll-a concentrations in
Lake Ontario are characteristic of an oligotrophic system. Crustacean zooplankton communities have
shifted away from species indicative of high planktivory (cyclopoids, bosminids, small daphnids,
Cercopagis) and towards calanoid copepods, larger daphnids, and Bythotrephes. In addition, the
amphipod Diporeia, absent from shallow Lake Ontario sites by 1997, had almost entirely disappeared
from deep sites by 2011. Current benthos communities are dominated by Dreissena, which continues to
increase in deep region of the lake, and oligochaetes.
The rapid shifts in the lower food web experienced by Lake Huron and, to a lesser extent, Lake
Michigan, in the early to mid-2000s are moderating. The offshore lower food webs of both lakes are
currently characterized by greatly increased transparency, low phytoplankton abundance, and lack of a
pronounced spring chlorophyll-a maximum; summer crustacean zooplankton communities are
dominated by calanoid copepods with relatively few cladocerans, and benthic communities are
dominated by dreissenids, with residual populations of Diporeia found only in the deepest portions of
the two lakes. Profundal populations of Dreissena are still increasing in Lake Huron but appear to have
stabilized in Lake Michigan. In recent years, these lakes have exhibited ultra-oligotrophic conditions
similar to those of Lake Superior. The loss of prey items favored by forage fish, such as Daphnia and
Diporeia, is expected to affect higher trophic levels, particularly in Lake Huron where biomass of
Mysis, another important prey item, is extremely low.
Proliferation of Dreissena has been coincident with major food web changes in the Great Lakes,
especially lakes Ontario, Michigan, and Huron. Although there is uncertainty about the mechanisms by
which Dreissena impact the food web, they can have significant effects on nutrient cycling; furthermore,
mussel feeding activity has been associated with increased water transparency and reduced phytoplankton
abundance in offshore waters. Changes to mussel populations have co-occurred with trends in other lower
food web factors, including nutrients, water clarity, and both the abundances and community
compositions of phytoplankton and zooplankton communities.
Lake Superior is consistently classified as ultra-oligotrophic based on phytoplankton and nutrient
conditions. No systematic change has been seen in chlorophyll-a since 1998, although increasing spring
phytoplankton abundance and opposing trends in total phosphorus and soluble silica concentrations
suggest a slight long-term increase in springtime productivity. However, little evidence of directional
change has been seen in crustacean zooplankton or benthos communities.

MARCH 2021                                                                                       PAGE | v
STATUS OF THE LOWER FOOD WEB IN THE OFFSHORE WATERS OF THE LAURENTIAN GREAT LAKES

1 INTRODUCTION
The Great Lakes National Program Office (GLNPO) of the United States Environmental Protection
Agency (USEPA) has been conducting regular surveillance monitoring of the lower trophic levels of
the Great Lakes since 1983 (Barbiero et al., 2018a). This monitoring effort is focused on the relatively
homogeneous offshore waters of the lakes and is currently limited to two well-defined periods during
the year: the spring isothermal period and the stratified summer period. Monitoring was initially limited
to Lakes Michigan, Huron, and Erie; in 1986 sampling was extended to include Lake Ontario, and in
1992 sampling of Lake Superior was added. The base monitoring program included collection of water
quality data (e.g., nutrients, water clarity), along with phytoplankton samples and zooplankton samples
to depths of 20 m. Zooplankton sampling to depths of up to 100 m and collection of benthos were
added to the program in 1997, and mysid sampling began in 2006. Although monitoring of
phytoplankton communities has always been part of the program, we only report data from 2001 to
present (with greater spatial representation after 2006) due to data consistency concerns for earlier
years (Reavie et al., 2014). The program has also been extended to include a remote sensing
component, providing estimates of chlorophyll-a (hereafter referred to as chlorophyll) concentrations
spanning from 1998 to present using an algorithm specifically tuned to the waters of the Great Lakes
(Lesht et al., 2013).
This report presents data on a selection of chemical, physical, and biological variables that characterize
the base of the Great Lakes open water ecosystem. A detailed report presenting the full results of the
annual Great Lakes Biology Monitoring Program (GLBMP) is available elsewhere (U.S. EPA, 2020);
in addition, detailed analyses of GLBMP data have recently been published for phytoplankton (Reavie
et al., 2014), zooplankton (Barbiero et al., 2019), mysids (Jude et al., 2018), and benthos (Burlakova et
al., 2018). The goal of this report is to integrate information from the different components of
GLNPO’s Water Quality Survey (WQS) to provide a general description of the status of the lower food
web of all five Great Lakes. We assess the lower food web using measurements of satellite-derived
chlorophyll (1998–2018), phytoplankton (2001–2018), summer crustacean zooplankton (1997–2018),
the semi-benthic crustacean Mysis diluviana (2006–2018, also referred to as mysids), and benthic
invertebrates (1997–2018).
These biological variables are supplemented by representative spring nutrient concentrations (total
phosphorus and soluble silica) and transparency, as measured by spring and summer Secchi depth.
Spring total phosphorus concentration has been shown to be a good indicator of average summer
production, while silica is a nutrient taken up by diatoms, one of the main primary producers in the
lakes. Secchi depth is correlated to algal biomass and phosphorus concentration, and it has served as
the basis for the most widely used lake trophic state index (Carlson, 1977). In addition, water clarity as
measured by Secchi depth is an important factor modifying interactions among visually feeding
predators, such as planktivorous fish and predatory zooplankton.

2 METHODS
Spring surveys are conducted as early as possible after ice out conditions in the Straits of Mackinac,
typically in April, and summer surveys are conducted during the period of stable thermal stratification,
typically in August. Samples for nutrients, phytoplankton, and zooplankton are currently collected from
72 regular open water stations; mysid samples are taken at all regular stations visited at night. Benthos
samples are collected from 33 of these open water stations, as well as from an additional 25 exclusively
benthos stations (Figure 1). Historically, a greater number of WQS stations have been sampled; only

MARCH 2021                                                                                        PAGE | 1
STATUS OF THE LOWER FOOD WEB IN THE OFFSHORE WATERS OF THE LAURENTIAN GREAT LAKES

those located in lake regions that are currently sampled are included in this report. Further details on
locations and characteristics of stations are available in Barbiero et al. (2018a) and Lesht et al. (2018).
Samples for nutrients (spring) are taken at discrete depths throughout the entire water column; data
reported herein were averaged from discrete samples taken from depths > 10 m from the bottom (or > 2 m
from the bottom in western and central Lake Erie). References to analytical methods for soluble silica (Si)
and total phosphorus (TP) are provided in Appendix A. Phytoplankton samples are composites of water
sampled at discrete depths from the euphotic zone. Isothermal spring samples integrate water from 1, 5,
10, and 20 m. In shallower locations (Lake Erie), the 20-m sample is replaced by a collection just above
the lake bottom. For summer, equal volumes are integrated from 1 m, 5 m, 10 m, and the lower
epilimnion. Phytoplankton biomass is estimated using cell dimension measurements, applying historical
dimension averages when required dimensions are not able to be measured.
Zooplankton samples are collected by vertical tow from the lesser of 2 meters above the bottom or 100 m
using a 0.5-m diameter 153-µm mesh net. Mysids are collected using a 1-m diameter 500-µm mesh net
(250-µm cod end jar) towed vertically from near the bottom (3 m or 5 m off the bottom in water
shallower than or deeper than 100 m, respectively). Both zooplankton and mysids are narcotized with
soda water, preserved in buffered formalin, and later enumerated and measured in the lab. Biomass of
zooplankton and mysids is estimated using length measurements and length-weight relationships from the
literature. Samples for benthic invertebrate analysis are collected in triplicate using a Ponar grab sampler,
sieved through a 500-µm mesh net and preserved in buffered formalin with Rose Bengal. Oligochaetes
and chironomids are mounted on slides and identified under a compound microscope at 63x; other
organisms are identified under a dissecting microscope. Dreissena spp. (the zebra mussel D. polymorpha,
and the quagga mussel D. rostriformis bugensis) were first enumerated in 2003. Biomass of benthos (total
wet weight; with shell for molluscs) has been recorded since 2012. Further details on biological sampling
and analysis methods are available from the references in Appendix A.
Estimates of chlorophyll concentration in the surface waters of the offshore are estimated with data
from the Sea-viewing Wide Field-of-view (SeaWiFS, 1998–2007) and Moderate resolution imaging
spectroradiometer (MODIS, 2002–present) ocean color sensors using a band-ratio retrieval algorithm
developed with GLNPO monitoring data (Lesht et al., 2013; 2016). To maintain consistency with other
datasets presented here, satellite chlorophyll estimates from the pixels nearest to the WQS open-water
sampling stations were extracted and averaged.
Monotonic trends in water quality variables were assessed with Spearman rank correlations with year.
Being a rank-based test, it assesses trends by testing for successive increases/decreases in a variable
over time, without regard to the magnitude of change. Similarly, phytoplankton trends were assessed
with Kendall’s rank correlation test. Significance for all tests was assessed at α = 0.05.

MARCH 2021                                                                                          PAGE | 2
STATUS OF THE LOWER FOOD WEB IN THE OFFSHORE WATERS OF THE LAURENTIAN GREAT LAKES

Figure 1. Map of GLNPO long-term monitoring stations for annual spring and summer nutrient and plankton
sampling (includes phytoplankton, zooplankton, Mysis) and summer benthos sampling.

3 RESULTS
3.1     WATER QUALITY VARIABLES
3.1.1   Spring Total Phosphorus
Spring TP has increased significantly since 1983 in the western basin of Lake Erie, although inter-
annual variability has been high (Figure 2). Years with elevated TP levels have been particularly
apparent since the early 2000s. No trends in TP were observed in the central or eastern basins of Lake
Erie. All three basins have exceeded Great Lakes Water Quality Agreement (GLWQA) interim
substance objectives for TP concentrations in open waters in some years, the western and central basins
most consistently.
Spring TP concentrations have declined in lakes Ontario, Huron, and Michigan since the mid-1980s
(Figure 2; Table 1). The most notable declines in Lake Ontario were between the mid-1980s and the
late 1990s, with some evidence of further, more moderate decreases during the last decade. Recent TP
concentrations in Lake Ontario are less than half those seen at the beginning of our surveys in 1986.
The longer time series collected by Environment and Climate Change Canada shows that the decline in
spring TP was even larger in the late 1970s and early 1980s, prior to the initiation of the GLNPO WQS
(Dove and Chapra, 2015). TP concentrations in Lake Michigan have declined by nearly 50% since the
start of our monitoring in 1983. Declines in Lake Huron first became apparent in the mid-1990s; recent
(2014–2018) concentrations are approximately 35% lower than those seen at the beginning (1983–
1987) of our program. Since approximately 2005–2010, declines in both lakes have abated, with
concentrations in Lake Huron increasing slightly. Concentrations in lakes Ontario, Huron, and

MARCH 2021                                                                                        PAGE | 3
STATUS OF THE LOWER FOOD WEB IN THE OFFSHORE WATERS OF THE LAURENTIAN GREAT LAKES

Michigan are currently substantially below GLWQA interim substance objectives for TP concentrations
in open waters.
Spring TP has increased in Lake Superior (Table 1), though the absolute increase has been slight.
Currently, spring concentrations in lakes Superior and Huron are virtually identical (2018: 2.5 and 2.6
µg P/L, respectively) while concentrations in Lake Michigan are slightly higher (2018: 3.2 µg P/L).
Based on TP concentrations, the upper lakes (Michigan, Huron, and Superior) are considered
ultraoligotrophic (Ryding and Rast, 1994). Spring TP in Lake Ontario is only slightly higher than that
in the three upper lakes (2018: 3.8 µg P/L).

3.1.2   Spring Soluble Silica
The western basin of Lake Erie has shown a significant increasing trend in soluble silica (Figure 2;
Table 1), perhaps influenced by increased concentrations in Lake Huron, which provides the majority
of water input to Lake Erie. In the central basin, elevated silica concentrations were seen in the 1990s–
early 2000s, a period corresponding to peak dreissenid abundance in that basin (Karatayev et al., 2018).
Although there are no significant long-term trends for the period presented, silica concentrations have
been lower in the central basin since 2003, likely due to growth of large centric diatoms during the
winter-spring bloom (Reavie et al., 2016). In the eastern basin, spring silica concentrations increased
notably during the mid-1990s and have remained elevated since. This was accompanied by a reduction
in the size of the spring phytoplankton community and a shift towards centric diatom species with high
silica requirements, changes that were likely due to dreissenid grazing (Barbiero et al., 2006).
As might be expected given the decreases in TP, silica has increased in lakes Ontario, Huron, and
Michigan (Figure 2). These increases in silica are consistent with limitation of diatom growth through
reduced availability of phosphorus, leading to lower diatom production and/or increased grazing, e.g.,
by dreissenid mussels (Mida et al., 2010), perhaps in combination with decreased long-term burial rates
of silica (Barbiero et al., 2002). It is worth noting that Lake Huron experienced a marked increase in
silica concentrations in 2003, a year associated with a notable decline in spring phytoplankton
(Barbiero et al., 2011a), owing mainly to a loss in pelagic diatoms (Reavie et al., 2014); this change
was accompanied by drastic changes to the zooplankton community as well (Kovalenko et al., 2018).
Both lakes Michigan and Huron experienced further increases in soluble silica in 2017 and 2018,
although these were not accompanied by notable changes in transparency or chlorophyll (see below).
In contrast to the other lakes, the Lake Superior silica concentration has decreased significantly, although
the absolute change is modest. This might indicate an increase in productivity (Schelske et al., 1983),
which is supported by the observed increasing trends in both TP and spring phytoplankton (see below).

3.1.3   Secchi Depth
The western basin of Lake Erie experienced a significant reduction in spring transparency during the mid-
1990s (Figure 3), despite high abundances of dreissenid mussels during those years (Karatayev et al.,
2014). The lack of a dreissenid impact on transparency in the western basin has been ascribed to high
sediment inputs and resuspension of unassimilated non-algal particulates (Barbiero and Tuchman, 2004).
No changes were seen in the central basin of Lake Erie. In contrast, transparency has increased in the
eastern basin of Lake Erie, with most of this change taking place in the mid-1990s, a likely consequence
of dreissenid activity (Karatayev et al., 2018). Despite these long-term changes in spring Secchi depth
(western and eastern basins), there were no statistically significant trends in summer Secchi depth for any
basin of Lake Erie (Table 1).

MARCH 2021                                                                                         PAGE | 4
STATUS OF THE LOWER FOOD WEB IN THE OFFSHORE WATERS OF THE LAURENTIAN GREAT LAKES

Figure 2. Spring total phosphorus (TP) and soluble silica (Si) from 1983 to 2018 in the Great Lakes. Bars
indicate one standard error. The horizontal dashed line within each plot indicates the 2012 interim substance
objectives for TP concentrations in open waters. Note different Y-axis scales in TP plots.

As might be expected from other indicators of oligotrophication, spring and summer Secchi depths
showed marked increases in lakes Ontario, Michigan, and Huron over the time series. However, the
trajectories of increase were different in the three lakes. Spring transparency in Lake Ontario has been
notably higher, albeit quite variable, since the early 2000s (Figure 3). Although our data lack
information from 1992 to 1995, other sampling programs show that summer Secchi disk depth
increased continuously from the 1980s to 2000, and then stabilized around 7 m (Rudstam et al., 2017).
The continued increase in water clarity from 1990s to 2018 mirrors an increased lake-wide biomass of
dreissenid mussel in the lake (Birkett et al., 2015), suggesting an effect of filtering by dreissenid mussels
(see also Barbiero et al., 2006).

MARCH 2021                                                                                               PAGE | 5
STATUS OF THE LOWER FOOD WEB IN THE OFFSHORE WATERS OF THE LAURENTIAN GREAT LAKES

Trends in lakes Michigan and Huron Secchi depth have been remarkably similar (Barbiero et al.,
2018b), with steady increases in spring and summer transparency throughout most of the last 20 years
and some evidence of a recent stabilization. After a short period of relatively high values at the
beginning of our data series, which has been attributed to high zooplankton herbivory (Scavia et al.,
1986), Secchi depth in Lake Michigan decreased and remained low (
STATUS OF THE LOWER FOOD WEB IN THE OFFSHORE WATERS OF THE LAURENTIAN GREAT LAKES

Figure 3. Spring (left panels) and summer (right panels) Secchi depth from 1983 to 2019 in the Great Lakes. Bars
indicate one standard error.

MARCH 2021                                                                                            PAGE | 7
STATUS OF THE LOWER FOOD WEB IN THE OFFSHORE WATERS OF THE LAURENTIAN GREAT LAKES

Figure 4. Monthly averaged (March–October) surface chlorophyll concentrations at GLNPO WQS
station locations in the Great Lakes, 1998–2018. Note different color scales in Erie and Ontario compared to the
other three lakes.

MARCH 2021                                                                                              PAGE | 8
STATUS OF THE LOWER FOOD WEB IN THE OFFSHORE WATERS OF THE LAURENTIAN GREAT LAKES

3.2     BIOLOGY VARIABLES
3.2.1   Phytoplankton
The Great Lakes phytoplankton community includes hundreds of unique taxa including diatoms,
chrysophytes, green algae, cryptomonads, cyanophytes, euglenoids and dinoflagellates (Figure 5).
Temporal changes in phytoplankton abundance over 18 years are shown through histograms that
summarize within-lake averages (within-basin averages for Erie; Figure 5). In many cases, these
changes are attributed to food web shifts and changes in water quality. Likely reasons for these changes
include size-specific preferences of food organisms by successful grazers (Barbiero et al., 2018),
nutrient shifts (e.g., increases in soluble reactive phosphorus loads in Lake Erie; Kane et al., 2014) and
climate-related changes in physical properties of the lakes (Reavie et al., 2017). These mechanisms are
discussed in greater detail in respective, published manuscripts.
Spring phytoplankton biovolumes are highest in Lake Erie, which is overwhelmingly dominated by
diatoms (especially the centric diatom Aulacoseira islandica), particularly in the central basin (Reavie
et al., 2014). Very high spring biovolumes of diatoms, relative to that of other taxa later in the year,
have been linked to late-summer hypoxia (Reavie et al., 2016). It is notable that there have been erratic
fluctuations in algal abundance and composition in the spring, but summer has exhibited a persistent
increase in cyanophytes (dominated by Aphanocapsa and Microcystis). During summer, phytoplankton
biovolumes are typically highest in Lake Erie’s western basin, where there are often especially high
abundances of the nuisance cyanophyte Microcystis aeruginosa (Bridgeman et al., 2013), although
there are also some high abundances of diatoms, chrysophytes, dinoflagellates, and cryptophytes.
Lake Ontario has been dominated by centric diatoms and dinoflagellates in the spring and pennate
diatoms, cryptophytes, chlorophytes, and dinoflagellates in the summer. While not easily apparent in
the histograms (Figure 5), total phytoplankton density and biovolume exhibited a slight increase over
the last 18 years. During that time, the abundance of dinoflagellates (Peridinium) increased, as did that
of summer cyanophytes (largely Aphanocapsa).
Algal abundance overall is lower in the upper lakes. Spring dominants tend to be opportunistic diatom
taxa (Aulacoseira, Stephanodiscus) that make use of abundant nutrients, such as phosphorus and silica.
As nutrient limitation is established later in the year, cyanophytes and dinoflagellates increase in
abundance. In terms of biovolume, spring in Lake Michigan is dominated by centric diatoms with an
increasing relative abundance of flagellates such as cryptophytes (Figure 5). Total spring phytoplankton
biovolume has decreased in Lake Michigan, largely due to a decline in centric diatoms. Summer
phytoplankton abundance has fluctuated, showing no long-term trend, although relative contributions
from chrysophytes may be increasing (Figure 5).
Lake Huron is dominated by diatoms and cryptophytes in the spring, and by diatoms, chrysophytes, and
dinoflagellates in the summer. Spring diatom biovolume plummeted after 2002, while summer data
reveal a less dramatic decline followed by a gradual recovery in algal abundance favoring chrysophytes
and dinoflagellates. This decline is associated with concurrent declines in nutrients, chlorophyll,
zooplankton, and benthos (Kovalenko et al., 2018), as well as with the rapid spread of dreissenids.
Lake Superior is dominated by diatoms, chrysophytes, cryptophytes and dinoflagellates in the spring,
with the addition of cyanophytes by summer. Although algal abundance has consistently represented an
oligotrophic system, spring data suggest an increase in biovolume over the period presented (Figure 5),
which appears to be driven by increased flagellated cryptophytes; there were no significant trends in
summer algal abundance or composition.

MARCH 2021                                                                                       PAGE | 9
STATUS OF THE LOWER FOOD WEB IN THE OFFSHORE WATERS OF THE LAURENTIAN GREAT LAKES

Figure 5. Basin-wide averages of phytoplankton biovolume in spring (left) and summer (right) from 2001 to
2018. Spring/summer scales are aligned (except for Lake Erie) for easier comparison. A significant increasing (+)
or decreasing (-) trend (Kendall’s rank correlation test, p < 0.05) for the 18-year period is indicated following
each lake/basin name.

MARCH 2021                                                                                            PAGE | 10
STATUS OF THE LOWER FOOD WEB IN THE OFFSHORE WATERS OF THE LAURENTIAN GREAT LAKES

3.2.2   Crustacean Zooplankton
Crustacean zooplankton communities differ from lake to lake, both in abundance and composition; data
from 1997 to 2016 were recently analyzed by Barbiero et al. (2019). Volumetric biomass is highest in
the western and central basins of Lake Erie, followed by Erie’s eastern basin and Lake Ontario, and
similarly low biomass in lakes Michigan, Huron, and Superior (Figure 6). At the start of the time series,
the crustacean zooplankton community was dominated by cladocerans and cyclopoids in lakes Erie and
Ontario, by cladocerans and calanoids in lakes Michigan and Huron, and by calanoids in Lake Superior.
This pattern is consistent with a greater prevalence of cladocerans and cyclopoids in more highly
productive systems, although zooplankton community structure also depends on the degree of fish
predation.
The western basin of Lake Erie shows a high degree of inter-annual variability, as would be expected in
this very dynamic and relatively productive system; both the highest (2006) and the lowest (2001)
volumetric biomass values in our dataset were recorded in this basin. There has been no evidence of
directional change in community composition. The western basin was also unique in having the native
Leptodora kindtii as the dominant predatory cladoceran. The central and eastern basins of Lake Erie
also have shown high inter-annual variability and little evidence of directional change. Unlike the
western basin, the non-native Bythotrephes longimanus was the dominant predatory cladoceran in the
eastern and central basins, where its biomass was higher than in any other region of the Great Lakes.
The zooplankton community in Lake Ontario has undergone substantial change since 1997. An initial
assemblage dominated by cyclopoid copepods (mostly Diacyclops thomasi), Daphnia retrocurva, and
bosminids, and with the invasive Cercopagis pengoi as the dominant predatory cladoceran, shifted to
one characterized by reduced numbers of cyclopoids, a more varied predatory cladoceran community,
and increased biomass of calanoid copepods. A further change occurred in 2008, with increased
biomass of the calanoid copepod Leptodiaptomus sicilis, occasional dominance by Bythotrephes
longimanus, and the appearance in substantial numbers of Daphnia mendotae. Total crustacean
biomass has declined since 1997 (Table 1). The shifts in Lake Ontario crustaceans have not been
accompanied by notable reductions in chlorophyll; the replacement of cyclopoids and smaller
cladocerans (Daphnia retrocurva, bosminids) with calanoids and larger cladocerans (D. mendotae, B.
longimanus) instead are consistent with decreased fish predation (Barbiero et al., 2014; Rudstam et al.,
2015). Species composition has been variable in recent years (2014–2018); while cyclopoid biomass
has remained relatively low, dominant cladoceran species and calanoids have varied from year to year,
perhaps indicating variations in the intensity of planktivory by fish.
Lakes Michigan and Huron also have experienced marked shifts in summer zooplankton community
size and composition since 1997; these trends have been similar between the lakes, but the change is
much more pronounced in Lake Huron. In both cases, declines in cladocerans have occurred, with the
resulting communities dominated by calanoid copepods (diaptomids and Limnocalanus macrurus). The
reduction in cladocerans has not been as dramatic in Lake Michigan as in Lake Huron. Since 2003,
total crustacean biomass in Lake Huron has been approximately a third of that observed between 1997
and 2002, with relatively little variation. In contrast, Lake Michigan total biomass in recent years been
approximately half that of 1997–2002, with more notable inter-annual variation. In both lakes, declines
have been statistically significant (Table 1) and followed declines in spring chlorophyll (Barbiero et al.,
2018b), suggesting declining resources as a causal factor. The strongest evidence of bottom-up
regulation of the lower food web has been seen in Lake Huron; evidence in Lake Michigan has been
more ambiguous (Barbiero et al., 2011a; Bunnell et al., 2014).

MARCH 2021                                                                                       PAGE | 11
STATUS OF THE LOWER FOOD WEB IN THE OFFSHORE WATERS OF THE LAURENTIAN GREAT LAKES

Lake Superior has had the lowest and most consistent zooplankton biomass over time. Calanoid
copepods accounted for over 85% of total biomass, on average, over the full time series; the vast
majority of this calanoid biomass was contributed by two large, deep-living species: L. macrurus and
Leptodiaptomus sicilis.
The loss of cladocerans and the increased importance of calanoids in lakes Huron and Michigan have
altered the size- and depth-distributions of crustacean biomass, reducing biomass in intermediate (1.5 –
2.5 mm) size categories and likely shifting biomass deeper in the water column. Crustacean community
structure in these lakes is currently similar to that of Lake Superior. The increased importance of
calanoids in Lake Ontario, in turn, has shifted its community structure closer to those characteristic of
lakes Huron and Michigan during the late 1990s–early 2000s.

Figure 6. Summer crustacean volumetric biomass (mg DW/m3), by major taxonomic group,
for the Great Lakes, 1997–2018. The upper right graph shows zooplankton volumetric (left axis; left bars) and
areal (right axis; right bars) biomass for all five lakes in 2018.

MARCH 2021                                                                                            PAGE | 12
STATUS OF THE LOWER FOOD WEB IN THE OFFSHORE WATERS OF THE LAURENTIAN GREAT LAKES

3.2.3   Mysids
The opossum shrimp Mysis diluviana (formerly M. relicta) is a large omnivorous crustacean
zooplankter that inhabits bottom sediments during the day and migrates into the upper hypolimnion or
lower metalimnion at night. It is both an important predator on other zooplankton and an important
food item for many Great Lakes fish due to its size, year-round availability, and high lipid content. A
detailed analysis of the time series from 2006 to 2016 is in Jude et al. (2018).
M. diluviana occurs in all five of the Great Lakes, but it is rare in Lake Erie. Among the four deeper
lakes, biomass was highest in Lake Ontario, somewhat lower in lakes Michigan and Superior, and
substantially lower in Lake Huron (Figure 7). Since 2006, both lakes Michigan and Huron have
exhibited statistically significant declining trends in spring mysid biomass; an increasing trend in
spring biomass was seen in Lake Superior. No trends were apparent in summer.
Because our data series begins in 2006, we cannot assess whether M. diluviana populations exhibited
declines similar to those seen in other crustacean groups in the early 2000s in lakes Huron and
Michigan. Pothoven and Vanderploeg (2017) reported 54% declines in M. diluviana between 1995–
2002 and 2007–2015 at a 110-m site in southeastern Lake Michigan. Predictions of the effect of
declines in epilimnetic production on mysid populations is complicated by the fact that mysids feed
below the thermocline in the deep chlorophyll layer at night (O’Malley et al., 2017); the biomass of
both algae and zooplankton in this layer varies by lake (Scofield et al., 2020a; Scofield et al., 2020b).
In Lake Ontario, where the major declines in production occurred earlier than in lakes Michigan and
Huron, M. diluviana populations during the 2000s were approximately half those in the 1990s
(Johannsson et al., 2011). Holda et al., (2019), in an analysis of spatially extensive mysid data from
Lake Ontario in 2013, suggested that the decline was due to increased mortality.

3.2.4   Benthos
Benthos community size and structure in the Great Lakes has been shown to vary with depth, with a
notable breakpoint occurring at 70 m (Burlakova et al., 2018). Therefore, data are presented separately
for shallow (< 70 m) and deep (> 70 m) regions, for both dreissenids (Figure 8) and the whole benthic
community (Figure 9). Abundances (excluding dreissenids) were highest in Lake Erie, where all sites
were < 70 m (Figure 9). Within lakes, abundances were often higher at shallower sites, particularly in
recent years. Detailed analysis of the 1998 to 2016 benthos data are in Burlakova et al. (2018).
The highest total wet weight biomass of benthos in our most recent year of data (2018) was found in
Lake Ontario, followed by, in order of decreasing biomass, Lake Erie, Michigan, Huron, and Superior
(Figure 9). The largest contributor of biomass (wet weight with shells) in all lakes except Superior was
Dreissena (largely D. r. bugensis), which has increased in abundance over the time series (Figure 8)
and now contributes more than 99% of total benthos biomass in the other four lakes. In 2018, the
highest lake-wide average Dreissena biomass occurred in Lake Ontario, followed by lakes Erie and
Michigan; the lowest biomass was found in Lake Huron, but it has increased five-fold since 2014.
Excluding Dreissena, the highest areal benthos biomass was found in Lake Erie and the highest
biomass in the > 70 m zone was found in Lake Huron. In all lakes, non-dreissenid communities were
dominated by oligochaetes except for Lake Superior, where Diporeia continue to dominate benthos
density and biomass. Dreissena populations are not established in Lake Superior.
One of the most dramatic changes over time was the loss of the amphipod Diporeia from Lake Ontario
and from shallow regions of lakes Michigan and Huron, and its extreme declines in deeper regions of
lakes Michigan and Huron. Like M. diluviana, Diporeia is a relatively large, lipid-rich prey item
consumed by many fish species, and its populations have historically been reliant upon the spring
diatom bloom (Gardner et al., 1990).

MARCH 2021                                                                                       PAGE | 13
STATUS OF THE LOWER FOOD WEB IN THE OFFSHORE WATERS OF THE LAURENTIAN GREAT LAKES

Figure 7. Mysis diluviana areal density (mg DW/m2) from 2006–2018 from stations deeper than 30 meters in
Lakes Ontario, Michigan, Huron, and Superior. Mysis were not sampled during the following cruises: Lake
Ontario (summer 2006) and Lake Superior (spring and summer 2006).
Diporeia was once among the dominant components of the benthic fauna in the eastern basin of Lake
Erie, but has been absent from that lake since the late 1990s (Figure 9; Dermott and Dow, 2008;
Barbiero et al., 2011b). In Lake Ontario, Diporeia was largely absent from shallow sites at the initiation
of our program in 1997, and since 2011 has only been encountered sporadically at our deep stations in
that lake. In lakes Michigan and Huron, Diporeia at shallow sites underwent marked, coincident
declines between 2002 and 2005, and have only occasionally been found since 2010. Deep populations
of Diporeia underwent marked declines at the same time but have remained relatively stable since
2005. The only Great Lake where Diporeia continue to dominate benthos density and biomass is Lake
Superior. Declines have also been seen in fingernail clam (Sphaeriidae) abundances, most notably at
shallow sites in Lake Ontario and Lake Michigan and deep sites in Lake Huron. In contrast,
chironomids and oligochaetes have shown no decline in these three lakes, but instead have increased in
parts of lakes Ontario and Michigan.
These changes have occurred during a period of increasing dreissenid densities in the lakes (Figure 8).
Dreissenid mussels are known to increase habitat complexity and food supply, particularly in the

MARCH 2021                                                                                        PAGE | 14
STATUS OF THE LOWER FOOD WEB IN THE OFFSHORE WATERS OF THE LAURENTIAN GREAT LAKES

littoral and sublittoral zones (Higgins and Vander Zanden, 2010; Karatayev et al., 2015). While
dreissenid populations have largely stabilized at our shallow sites, populations are still increasing in
deep regions of lakes Ontario and Huron. The rapid increases seen in the early 2000s in Lake Michigan
appear to have stabilized.
Overall, benthic communities in lakes Ontario, Michigan and Huron have shifted from dominance by
Diporeia to dreissenids and oligochaetes during the time series; dreissenid populations continue to
increase in Lake Huron and deep regions of Lake Ontario, but non-dreissenid populations have
exhibited relative stability over the past decade.

Figure 8. Density (2003–2018) and biomass (2012–2018) of dreissenid mussels for shallow sites (< 70 m, top
plots) and deep sites (> 70 m, bottom plots) in the Great Lakes. Dreissenid mussel populations are not established
in Lake Superior.

MARCH 2021                                                                                             PAGE | 15
STATUS OF THE LOWER FOOD WEB IN THE OFFSHORE WATERS OF THE LAURENTIAN GREAT LAKES

Figure 9. Great Lakes total areal biomass (wet weight) by major taxonomic group for 2018 in all lakes (upper left
plot) and areal density by major taxonomic group for 1997–2018, by individual lake. All plots are split into two
panels, for data from stations < 70 meters depth (upper panel) and > 70 meters deep (lower panel). There are no
deep stations in Lake Erie. Note that dreissenids are excluded from areal density plots.

MARCH 2021                                                                                            PAGE | 16
STATUS OF THE LOWER FOOD WEB IN THE OFFSHORE WATERS OF THE LAURENTIAN GREAT LAKES

4 CONCLUSIONS
Lake Erie is the only lake with consistently eutrophic conditions, and there is evidence of ongoing
eutrophication in recent years. Spring blooms of diatoms and summer blooms of cyanophytes appear to be
consistent features of the western and central basins, with summer/autumn chlorophyll and summer
phytoplankton biovolume notably higher in the central and eastern basins in the 10-year period from
2008–2018. These increases in chlorophyll have not been accompanied by increases in spring TP,
although concentrations in all three basins have consistently (western and central basin) or intermittently
(eastern basin) exceeded GLWQA interim substance target levels. It should be noted that spring TP may
not be the best indicator of potential productivity in this lake, since inflows of more highly bioavailable
forms of phosphorus have been increasing in recent years despite constant TP loads (Richards et al., 2010;
Scavia et al., 2014). While other elements of the lower food web have exhibited marked inter-annual
variability, particularly in the western and central basins, there has been no evidence of directional change
in zooplankton or benthos communities during this period (2008–2018).
The dramatic declines in TP seen in the 1980s/90s in Lake Ontario were accompanied by declines in
chlorophyll and increased transparency; any further changes in these variables during the 2000s have
been subtle. Recent TP concentrations, transparencies, phytoplankton biovolume, and surface
chlorophyll concentrations are characteristic of an oligotrophic system. TP concentrations are currently
well below GLWQA interim target levels. Crustacean zooplankton communities have changed
dramatically in recent years, with a shift away from species indicative of high planktivory (cyclopoids,
bosminids, small daphnids, Cercopagis) towards calanoid copepods, larger daphnids and Bythotrephes.
In addition, the amphipod Diporeia, already absent from our shallow sites by 1997, disappeared also
from deep sites by 2011.
The rapid shifts in the lower food web experienced by Lake Huron and, to a lesser extent, Lake Michigan,
in the early to mid-2000s are showing signs of moderation. Total phosphorus, spring chlorophyll,
phytoplankton biovolume, crustacean zooplankton communities, and Diporeia populations have exhibited
slight, if any, changes from 2008–2018. The offshore lower food webs of both lakes are currently
characterized by greatly increased transparency, the lack of a pronounced spring chlorophyll maximum,
and reduced spring phytoplankton (diatom) abundances. Summer crustacean zooplankton communities
are dominated by calanoid copepods with relatively few cladocerans, and benthos are dominated by
dreissenids, with residual populations of Diporeia found only in the deepest portions of the lakes.
Measurements of TP, transparency, and chlorophyll indicate the trophic states of these lakes are at or
below that of Lake Superior. The loss of prey items favored by forage fish, such as Daphnia and
Diporeia, can have consequences for higher trophic levels, particularly in Lake Huron where Mysis
biomass, another important prey item, is also low. Greater water clarity can have multiple consequences:
deepening primary productivity, greater negative impacts of UV radiation, forcing zooplankton
vulnerable to predation into less ideal environments deeper in the water column, and both increasing
predation success of planktivores and increasing their susceptibility to visual predators.
Proliferation of Dreissena has been coincident with major food web changes in the Great Lakes,
especially lakes Ontario, Michigan, and Huron. These mussels filter water, removing nutrients and
phytoplankton from the lake and binding energy in benthic resources. Thus, they contribute to changes
such as increased transparency and reduced nutrients and phytoplankton in offshore waters. Although
there is still uncertainty about the mechanisms by which Dreissena impact water quality and the food
web, there is a clear correlation between changing mussel abundances and trends in other components of
the lower food web.

MARCH 2021                                                                                        PAGE | 17
STATUS OF THE LOWER FOOD WEB IN THE OFFSHORE WATERS OF THE LAURENTIAN GREAT LAKES

Lake Superior has exhibited less change than the other Great Lakes. Although no trends have been
seen in chlorophyll or summer phytoplankton since 1998, both increasing spring phytoplankton
biovolume and opposing trends in TP and Si suggest a slight long-term increase in productivity.
Little evidence of directional change has been seen in crustacean zooplankton or benthos
communities, although Mysis populations have increased. Benthic communities are also relatively
unchanged, as Dreissena have not established significant populations in Lake Superior and Diporeia
populations remain stable.

MARCH 2021                                                                                PAGE | 18
STATUS OF THE LOWER FOOD WEB IN THE OFFSHORE WATERS OF THE LAURENTIAN GREAT LAKES

Table 1. Results of Spearman rank correlations on selected lower food web variables in the Great Lakes. Significant trends (a = 0.05) are indicated by red
cells (negative trends) and green cells (positive cells). Note that analyses for benthos in Lake Erie were conducted on lake-wide averages. Phytoplankton
trends were evaluated using Kendall rank tests, so ‘r’ values indicate average slope of the relationship (µm3/mL/y) for 2001–2018. Bivalve trends exclude
dreissenid mussels.
                                       ER W               ER C               ER E              ON                   MI                 HU                SU
 Variable           Season         r          P       R          P       r          P      r         P        r           P        r        P     r            P
 TP*                Spring         0.35     0.047     0.21   0.231      -0.25   0.159     -0.80     0.000   -0.87        0.000   -0.68   0.000   0.41         0.044
 Si*                Spring         0.75     0.000     0.13   0.460       0.27   0.135      0.83     0.000    0.96        0.000    0.76   0.000   -0.47        0.017
 Secchi†            Spring        -0.37     0.049    -0.33   0.056       0.48   0.011      0.84     0.000    0.69        0.000    0.74   0.000   0.34         0.085
 Secchi†            Summer        -0.10     0.587    -0.33   0.065       0.01   0.953      0.62     0.000    0.66        0.000    0.44   0.014   -0.02        0.908
 Chlorophyll§       Spring        -0.32     0.157     0.36   0.105       0.23   0.314      0.27     0.228   -0.95        0.000   -0.95   0.000   -0.28        0.223
 Chlorophyll§       Summer         0.24     0.284     0.77   0.000       0.44   0.048      0.20     0.373   -0.66        0.001   -0.41   0.063   0.29         0.193
 Chlorophyll§       Autumn        -0.24     0.284     0.87   0.000       0.81   0.000      0.43     0.051    0.21        0.355   -0.16   0.491   0.35         0.115
 Phytoplankton‡     Spring      -31313      0.345   -85107   0.009    -30275    0.249     8606      0.047    -767        0.048   -5324   0.000   1940         0.000
 Phytoplankton‡     Summer     154452       0.047   42134    0.013     29929    0.178    22403      0.007    6151        0.151   6427    0.047    -62         0.163
 Zooplankton**      Summer         0.26     0.232    -0.25   0.255      -0.10   0.661     -0.60     0.003   -0.75        0.000   -0.80   0.000   -0.04        0.856
 Mysis††            Spring                                               0.22   0.683      0.26     0.416   -0.62        0.039   -0.72   0.011   0.83         0.000
 Mysis††            Summer                                              -0.06   0.839     -0.21     0.520    0.03        0.924   -0.52   0.095   0.53         0.082
 Shallow
 Bivalves**         Summer                                               0.11   0.635     -0.84     0.000   -0.55        0.009    0.04   0.868   0.54         0.010
 Chironomids**      Summer                                              -0.01   0.948      0.42     0.050    0.51        0.015    0.05   0.821   0.29         0.181
 Diporeia**         Summer                                               0.02   0.936     -0.41     0.055   -0.84        0.000   -0.94   0.000   -0.08        0.736
 Oligochaetes**     Summer                                               0.04   0.844      0.19     0.397   -0.19        0.388    0.39   0.073   0.13         0.554
 Other**            Summer                                               0.52   0.013     -0.32     0.147    0.31        0.153    0.89   0.000   0.47         0.026
 Deep
 Bivalves**         Summer                                                                -0.48     0.023   -0.44        0.040   -0.77   0.000   0.31         0.159
 Chironomids**      Summer                                                                 0.77     0.000    0.62        0.002   -0.38   0.083   0.20         0.363
 Diporeia**         Summer                                                                -0.94     0.000   -0.84        0.000   -0.78   0.000   0.25         0.266
 Oligochates**      Summer                                                                 0.69     0.000   -0.11        0.635   -0.24   0.278   0.05         0.813
 Other**            Summer                                                                -0.28     0.199   -0.12        0.593    0.13   0.572   0.15         0.508
Years included: *1983–2018             †1983–2019     §1998–2018       ‡2001–2018        **1997–2018        ††2006–2016

MARCH 2021                                                                                                                                            PAGE | 19
STATUS OF THE LOWER FOOD WEB IN THE OFFSHORE WATERS OF THE LAURENTIAN GREAT LAKES
5 REFERENCES
Barbiero, R.P., Lesht, B.M., Hinchey, E.K., Nettesheim, T.G., 2018a. A brief history of the US EPA
Great Lakes National Program Office’s water quality survey. J. Great Lakes Res. 44, 539–546.
Barbiero, R.P., Lesht, B.M., Warren, G.J., 2011a. Evidence for bottom-up control of recent shifts in the
pelagic food web of Lake Huron. J. Great Lakes Res. 37, 78–85.
Barbiero, R.P., Lesht, B.M., Warren, G.J., 2014. Recent changes in the offshore crustacean zooplankton
community of Lake Ontario. J. Great Lakes Res. 40, 898–910.
Barbiero, R.P., Lesht, B.M., Warren, G.J., Rudstam, L.G., Watkins, J.M., Reavie, E.D., Kovalenko,
K.E., Karatayev, A.Y., 2018b. A comparative examination of recent changes in nutrients and
lower food web structure in Lake Michigan and Lake Huron. J. Great Lakes Res. 44, 573–589.
Barbiero, R.P., Rockwell, D.C., Warren, G.J., Tuchman, M.L., 2006. Changes in spring phytoplankton
communities and nutrient dynamics in the eastern basin of Lake Erie since the invasion of
Dreissena spp. Can. J. Fish. Aquat. Sci. 63, 1549–1563.
Barbiero, R.P., Rudstam, L.G., Watkins, J.M., Lesht, B.M., 2019. A cross-lake comparison of
crustacean zooplankton communities in the Laurentian Great Lakes, 1997–2016. J. Great Lakes
Res. 45, 672–690.
Barbiero, R.P., Schmude, K., Lesht, B.M., Riseng, C.M., Warren, G., Tuchman, M.L., 2011b. Trends of
Diporeia populations across the Laurentian Great Lakes, 1997–2009. J. Great Lakes Res. 37,
9–17.
Barbiero, R.P., Tuchman, M.L., 2004. Changes in the crustacean communities of Lakes Michigan,
Huron, and Erie following the invasion of the predatory cladoceran Bythotrephes longimanus.
Can. J. Fish. Aquat. Sci. 61, 2111–2125.
Barbiero, R.P., Tuchman, M.L., Warren, G.J., Rockwell, D.C., 2002. Evidence of recovery from
phosphorus enrichment in Lake Michigan. Can. J. Fish. Aquat. Sci. 59, 1639-1647.
Birkett, K., Lozano, S., Rudstam, L.G., 2015. Long-term trends in Lake Ontario’s benthic
macroinvertebrate community from 1994-2008. Aquat. Ecosystem Health Manage. 18, 76-85.
Bridgeman, T.B., Chaffin, J.D., Filbrun, J.E., 2013. A novel method for tracking western Lake Erie
Microcystis blooms, 2002–2011. J. Great Lakes Res. 39, 83-89.
Bunnell, D.B., Barbiero, R.P., Ludsin, S.A., Madenjian, C.P., Warren, G.J., Dolan, D.M., Brenden,
T.O., Briland, R., Gorman, O.T., He, J.X., 2014. Changing ecosystem dynamics in the
Laurentian Great Lakes: Bottom-up and top-down regulation. Bioscience 64, 26–39.
Burlakova, L.E., Barbiero, R.P., Karatayev, A.Y., Daniel, S.E., Hinchey, E.K., Warren, G.J., 2018. The
benthic community of the Laurentian Great Lakes: Analysis of spatial gradients and temporal
trends from 1998 to 2014. J. Great Lakes Res. 44, 600–617.
Carlson, R.E., 1977. A trophic state index for lakes. Limnol. Oceanogr. 22, 361–369.
Dermott, R., Dow, J., 2008. Changing benthic fauna of Lake Erie between 1993 and 1998, in:
Munawar, M., Heath, R. (Eds.), Checking the Pulse of Lake Erie: Ecovision World Monograph
Series. Backhuys Publishers, Leiden, The Netherlands, pp. 409–438.
MARCH 2021 PAGE | 20STATUS OF THE LOWER FOOD WEB IN THE OFFSHORE WATERS OF THE LAURENTIAN GREAT LAKES
Dove, A., Chapra, S.C., 2015. Long-term trends of nutrients and trophic response variables for the
Great Lakes. Limnol. Oceanogr. 60, 696–721.
Gardner, W.S., Landrum, P.F., Cavaletto, J.F., 1990. Lipid-partitioning and disposition of
benzo(a)pyrene and hexachlorobiphenyl in Lake Michigan Pontoporeia hoyi and Mysis relicta.
Environ. Toxicol. Chem. 9, 1269–1278.
Hecky, R.E., Smith, R.E.H., Barton, D.R., Guildford, S.J., Taylor, W.D., Charlton, M.N., Howell, T.,
2004. The near shore phosphorus shunt: a consequence of ecosystem engineering by
dreissenids in the Laurentian Great Lakes. Can. J. Fish. Aquat. Sci. 61, 1285-1293.
Higgins, S.N., Vander Zanden, M.J., 2010. What a difference a species makes: a meta-analysis of
dreissenid mussel impacts on freshwater ecosystems. Ecol. Monogr. 80, 179–196.
Holda, T.J., Rudstam, L.G., Bowen, K.L., Weidel, B.C., Watkins, J.M., Sullivan, P.J., Holden, J.P.,
Connerton, M.J., 2019. Status of Mysis diluviana in Lake Ontario in 2013: Lower abundance
but higher fecundity than in the 1990s. J. Great Lakes Res. 45, 307–316.
Johannsson, O.E., Bowen, K.L., Holeck, K.T., Walsh, M.G., 2011. Mysis diluviana population and
cohort dynamics in Lake Ontario before and after the establishment of Dreissena spp.,
Cercopagis pengoi, and Bythotrephes longimanus. Can. J. Fish. Aquat. Sci. 68, 795–811.
Jude, D.J., Rudstam, L.G., Holda, T.J., Watkins, J.M., Euclide, P.T., Balcer, M., 2018. Trends in Mysis
diluviana abundance in the Great Lakes, 2006–2016. J. Great Lakes Res. 44, 590–599.
Kane, D.D., Conroy, J.D., Richards, R.P., Baker, D.B., Culver, D.A., 2014. Re-eutrophication of Lake
Erie: Correlations between tributary nutrient loads and phytoplankton biomass. J. of Great
Lakes Res., 40, 496-501.
Karatayev, A.Y., Burlakova, L.E., Mehler, K., Barbiero, R.P., Hinchey, E.K., Collingsworth, P.D.,
Kovalenko, K.E., Warren, G., 2018. Life after Dreissena: The decline of exotic suspension
feeder may have significant impacts on lake ecosystems. J. Great Lakes Res. 44, 650–659.
Karatayev, A.Y., Burlakova, L.E., Padilla, D.K., 2015. Zebra versus quagga mussels: a review of their
spread, population dynamics, and ecosystem impacts. Hydrobiologia 746, 97–112.
Karatayev, A.Y., Burlakova, L.E., Pennuto, C., Ciborowski, J., Karatayev, V.A., Juette, P., Clapsadle,
M., 2014. Twenty five years of changes in Dreissena spp. populations in Lake Erie. J. Great
Lakes Res. 40, 550–559.
Kovalenko, K.E., Reavie, E.D., Barbiero, R.P., Burlakova, L.E., Karatayev, A.Y., Rudstam, L.G.,
Warren, G.J., Watkins J.M., 2018. Patterns of long-term dynamics of aquatic communities and
water quality parameters in the Great Lakes: Are they synchronized? J. Great Lakes Res. 44,
660-669.
Lesht, B.M., Barbiero, R.P., Warren, G.J., 2013. A band-ratio algorithm for retrieving open-lake
chlorophyll values from satellite observations of the Great Lakes. J. Great Lakes Res. 39, 138–
152.
Lesht, B.M., Barbiero, R.P., Warren, G.J., 2016. Verification of a simple band ratio algorithm for
retrieving Great Lakes open water surface chlorophyll concentrations from satellite
observations. J. Great Lakes Res. 42, 448–454.
MARCH 2021 PAGE | 21You can also read