An Acoustic Survey of the Cathédrale Notre-Dame de Paris before and after the Fire of 2019 - MDPI
←
→
Page content transcription
If your browser does not render page correctly, please read the page content below
acoustics

Article
An Acoustic Survey of the Cathédrale Notre-Dame de
Paris before and after the Fire of 2019
Brian F.G. Katz *        and Antoine Weber
 Institut Jean Le Rond d’Alembert UMR7190, Sorbonne Université, CNRS, 75006 Paris, France;
 antoine.weber@dalembert.upmc.fr
 * Correspondence: brian.katz@sorbonne-universite.fr

 Received: 27 September 2020; Accepted: 29 October 2020; Published: 6 November 2020

 Abstract: The Cathédrale Notre-Dame de Paris is amongst the most well-known worship spaces in
 the world. Its large volume, in combination with a relatively bare stone construction and marble floor,
 leads to rather long reverberation times. The cathedral suffered from a significant fire in 2019, resulting
 in damage primarily to the roof and vaulted ceiling. Despite the notoriety of this space, there are few
 examples of published data on the acoustical parameters of this space, and these data do not agree.
 Archived measurement recordings from 1987 were recovered and found to include several balloon
 bursts. In 2015, a measurement session was carried out for a virtual reality project. Comparisons
 between results from these two sessions show a slight but significant decrease in reverberation time
 (8%) in the pre-fire state. Measurements were recently carried out on the construction site, 1 year since
 the fire. Compared to 2015 data, the reverberation time significantly decreased (20%). This paper
 presents the preliminary results of these measurements, providing a documentation of the acoustics
 of this historic worship space both prior to and since the 2019 fire.

 Keywords: room-acoustic measurement; Notre-Dame de Paris; reverberation time; cultural heritage

1. Introduction
     The acoustics of worship spaces have been a topic of research for many decades. Due to their
significant dimensions, these spaces have been used over the centuries for cultural as well as religions
activities. Such spaces often exhibit acoustic anomalies (e.g., whispering galleries and coupled volumes).
An overview of a significant portion of this research has been reviewed in Girón et al. [1], discussing
different experimental procedures, results, and their theoretical interpretations. A number of notable
studies have been carried out in spaces of significant historical importance: St. Peter’s Basilica [2],
Haghia Sofia and Süleymaniye Mosque [3], St. John’s Baptistery [4], Saint-Germain-des-Prés Abbey [5],
and St. Paul’s Cathedral [6].
     The Cathédrale Notre-Dame de Paris is amongst the most well-known worship spaces in the
world. This medieval cathedral is widely considered to be one of the finest examples of French Gothic
architecture. The large volume in combination with its vast exposed limestone and marble surfaces lead
to long reverberation times. Despite the notoriety of this space, there are few examples of published
data on the acoustical parameters of this space.
     Built at the end of the 12th century, the Gothic Cathédrale Notre-Dame de Paris became the
emblematic place of musical creation in Europe, which historians call the “Ecole Notre Dame”.
Documents testify to the musical activity during this period and it is possible to think that the
spectacular development of this Parisian polyphony coincided with the organization of the liturgy
in the new choir inaugurated in 1182. The decrees of Cathédrale Notre-Dame de Paris, promulgated
in 1198 and 1199 by Bishop Eudes de Sully, attest to a practice of two, three, and four voices for the
responsorial chants of the mass and offices as well as for the Benedicamus Domino of Vespers [7,8].

Acoustics 2020, 2, 791–802; doi:10.3390/acoustics2040044                      www.mdpi.com/journal/acoustics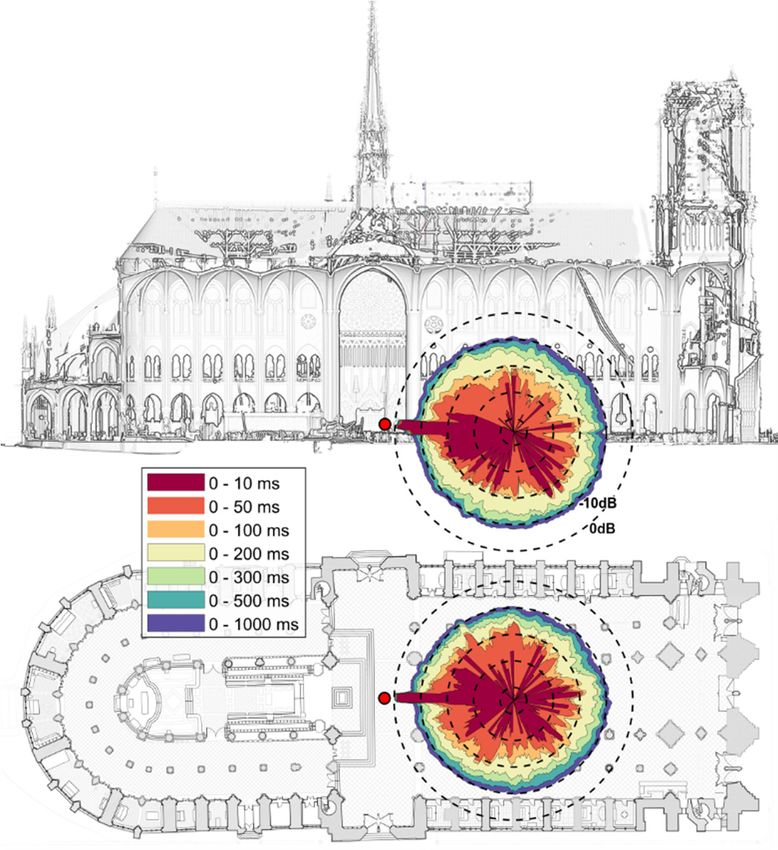
Acoustics 2020, 2                                                                                     792

      We are fortunate to have a historic text written by an English schoolmaster [9], which describes
the musical practices around 1275 in the choir of this Cathedral where the sound of the organum and
semi-improvised conductus could rise, towards the apse, before being noted in various manuscripts
which testify to the richness of the Magnus liber organi [10] (Latin for “Great Book of Organum” in
use by the Parisian School of Notre-Dame around the turn of the 12th & 13th centuries). Over the
centuries, the methods evolved and with the Gregorian melodies, which escape the closed choir or
circulate with the processions, the sounds of the organ, the bells, and the complex polyphonic works of
the Franco-Flemish counterpoint were mixed together. “The appointment of Antoine Brumel in 1498
brought a breath of fresh air: the future choirmaster of the Duke of Ferrara brought with him the best
and latest in Franco-Flemish polyphony” [11]. The history of music will remember the names of great
masters and composers such as André Campra, Jean-François Lalouette, or Jean-François Lesueur,
who, after the revolutionary period, composed the famous March of the Coronation, for Napoleon’s
entry into the cathedral in 1804, and various pieces for the Coronation Mass. (Edited excerpt from
http://acoustic-task-force-notre-dame.dalembert.upmc.fr/doku.php?id=lavierge2020)
      On 15 April 2019 a fire broke out in the attic of the Cathédrale Notre-Dame de Paris. The resulting
damage destroyed the roof and left three large holes in the vaulted ceiling when the spire and other
debris fell. As the restoration work continues, with significant documentation efforts being carried out
on the structural and material aspects of the cathedral, this work presents recent efforts to document
the room acoustic conditions of the cathedral, providing analysis of data acquired both before the fire
and during the reconstruction process. Certain elements of this work have been presented previously
in a scientific conference [12].

2. Published Acoustic Data
     Despite the notoriety of this space, there are few examples of published data on the acoustical
parameters of this space. Hamayon [13] presented reverberation time estimations as a function of
octave bands [125 to 4000 Hz: 8.5, 8.0, 7.5, 6.0, 4.5, 2.7 s]. Mercier [14] presented slightly different
reverberation time values [125 to 4000 Hz: 8.5, 8.2, 6.5, 6.2, 4.7, 2.5 s]. Both studies presented simply
the reverberation times without any reference or measurement protocol information.

3. Materials and Methods: Measurements in the 20th & 21st Centuries

3.1. Historical Data from 1987
     Archival recordings (1987) were recovered from an acoustic study relating to a new organ [15]
which included several balloon bursts.
     Measurement protocol—Figure 1a shows the measurement plan for the 1987 measurements with
source-receiver (S–R) positions. While a variety of techniques using different stimuli were employed,
only balloon burst sources were exploitable due to lack of excitation stimuli details (e.g., anechoic
signals, sweep stimuli parameters). Three balloon bursts from source position 1 were recorded as
well as 1 balloon burst from source position 2. These positions corresponded to “relavent” source
positions [16] for the cathedral, with S2 being near the center of the altar area in the transept and S1
being near the pulpit, which is closer to the center of the public area.
     Measurement equipment input—The sound was recorded with 13 omnidirectional microphones
which were connected to amultitrack reel-to-reel recorder (Tascam). While not an ideal omnidirectional
source, balloon bursts are a useful tool in certain situations, offering a portable impulsive source [17].
Recordings were digitized from the analog tape.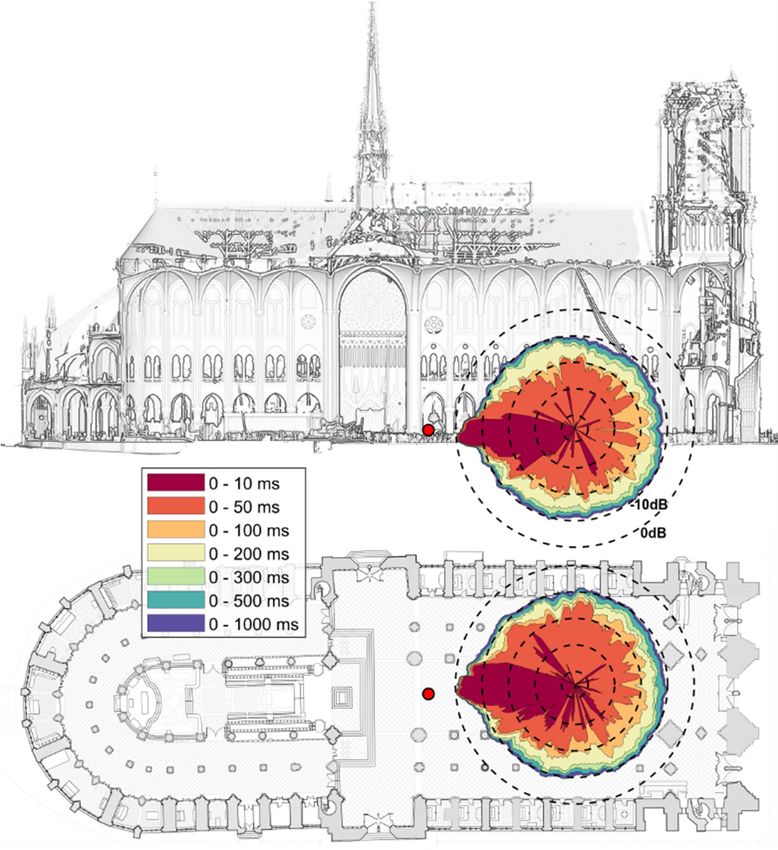
Acoustics 2020, 2                                                                                                      793
Acoustics 2018, 1, x FOR PEER REVIEW                                                                                           3 of 12

               (a) 1987                                   (b) 2015                                    (c) 2020
      Figure
        Figure1.1.Measurement
                    Measurementplans  plansfor
                                            forthe
                                                 the(a)
                                                     (a)1987,
                                                         1987,(b)
                                                               (b)2015,
                                                                   2015,and
                                                                          and(c)(c)2020
                                                                                    2020sessions
                                                                                           sessions at
                                                                                                    at the
                                                                                                        the Cathédrale
                                                                                                             Cathédrale Notre-
        Notre-Dame
      Dame            dePositions
              de Paris.   Paris. Positions   are centered
                                      are centered   underunder   numbered
                                                            numbered     sourcesource   (S# (red))
                                                                                   (S# (red))  andand    microphone
                                                                                                    microphone         (#
                                                                                                                    (# (blue and
        (blue and  green)) labels  or at points when  the measured  grid  too dense.   The  2020 plan
      green)) labels or at points when the measured grid too dense. The 2020 plan (c) also indicates in(c) also indicates
        in shaded
      shaded       regions
               regions   thethescaffolding
                                 scaffolding (yellow),
                                              (yellow), exclusion
                                                         exclusionzone
                                                                    zoneto people   (red),
                                                                            to people      and encumbered/damaged
                                                                                         (red),  and encumbered/damaged
        ground of the exclusion zone (blue) where it was not possible to place measurement equipment.
      ground of the exclusion zone (blue) where it was not possible to place measurement equipment.
  3.2. Detailed Measurements in 2015
3.2. Detailed Measurements in 2015
        On the evening of 13 April 2015, almost 4 years to the day before the 2019 fire, a series of acoustic
      On the evening
  measurements     were of    13 April
                          carried         2015, almost
                                     out following        4 years
                                                     a small         to the
                                                               concert       day before the 2019 fire, a series of acoustic
                                                                         performance.
        Measurement
measurements      wereprotocol—Figure
                           carried out following1b shows   the measurement
                                                        a small                   plan highlighting S-R positions for
                                                                   concert performance.
  theMeasurement
       2015 measurement        (see   photos   in Figure   2a).  Source
                         protocol—Figure 1b shows the measurement plan     positions     reflected  those from
                                                                                               highlighting     S-Rthepositions
                                                                                                                        1987     for
  measurements      as well  as S3   representing   the  choir  and   S4 as this was    tested
the 2015 measurement (see photos in Figure 2a). Source positions reflected those from the 1987  in 1987,  though    without
  balloon burst as was discovered after the measurements were carried out. Three measurement sets of
measurements as well as S3 representing the choir and S4 as this was tested in 1987, though without
  2 sine-sweeps during which microphones 1–8 changed positions were carried out (height of 1.5 m,
balloon burst as was discovered after the measurements were carried out. Three measurement sets
  the changing positions of these microphones are represented by the letters behind the measurement
ofposition).
   2 sine-sweeps
              Due toduring     which
                       excessive         microphones
                                    exterior               1–8 measurement
                                              noise, the first  changed positionsrepetitionwere   carried
                                                                                                was  carriedout
                                                                                                              87 (height
                                                                                                                 out twice,of 1.5 m,
the changing     positions    of these    microphones       are  represented      by   the   letters
  resulting in 4 measurement sets. Microphones 9–16 hung from the ceiling (7 m above floor 88 level,  behind   the  measurement
position).
  to capture Due
               thetoreverberant
                      excessive field
                                    exterior    noise,
                                           for use  by the
                                                        the first   measurement
                                                             recording    engineersrepetition         was carried
                                                                                        for the concert               87 out
                                                                                                            recording),   89 twice,
resulting   in 4 measurement
  thus remained                       sets. Microphones
                    at the same position       and consequently9–16 recorded
                                                                      hung from      thesimilar
                                                                                 eight     ceilingRIRs.
                                                                                                     (7 mThese
                                                                                                           aboverepeated
                                                                                                                    floor 88 level,
to capture the reverberant field for use by the recording engineers for the concert recording),
  90 measurements       allowed    for  an  investigation   into  the  stability of  the   acoustic   response  over   time,89 thus
  91 addressing
remained          subtle
             at the   same effects  of temperature
                              position                change [18].recorded
                                           and consequently            After the eight
                                                                                  last sweep     measurement,
                                                                                           similar    RIRs. These a balloon
                                                                                                                       repeated 90
  burst  at every source    position   was   recorded  with   the  receivers  at the  final   position.
measurements allowed for an investigation into the stability of the acoustic response over time, 91
addressing subtle effects of temperature change [18]. After the last sweep measurement, a balloon
burst at every source position was recorded with the receivers at the final position.
     Measurement equipment output—The audio output was sent to an amplifier (SAMSOM, model
Servo 120a, Hicksville, USA) and sequentially to four miniature dodecahedral sound sources (Dr-
Three, model 3D-032, Tokyo, Japan). Signal—The excitation signal was based on the Swept Sine
method. The sweep frequency rose exponentially over 20 s from 20 to 20,000 Hz. However, due to
the frequency response of these specific speakers, there was insufficient energy below the 250 Hz
octave band for analysis. The sweep was played at a sample rate of 44.1 kHz using the DAW software
Reaper and sound card (RME, Fireface 800, Haimhausen, Germany).
     Measurement equipment input—The reverberated signal was recorded by two measurement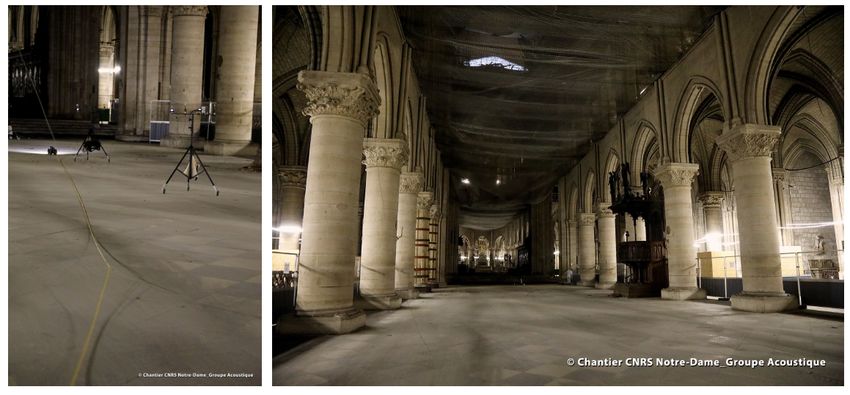
(Alleroed, Denmark), model 4006 (1–4) and 1 Schoeps (Karlsruhe, Germany) model MK5 omni (5), 1
dummy-head (KU-80, equipped with DPA 4060) and a 1st-order Ambisonic microphone (Core Audio,
Tetramic, Teaneck, NJ, USA), all recorded using a sound card (RME, Fireface 800). (II) The sweep was
recorded at a2sample rate of 48 kHz by the other 11 omni-directional microphones (6 DPA model 4006
Acoustics 2020, 794
(11–16), 5 Schoeps model MK5 omni, (6–10)) and using a sound card (RME, Micstacy).
(a)
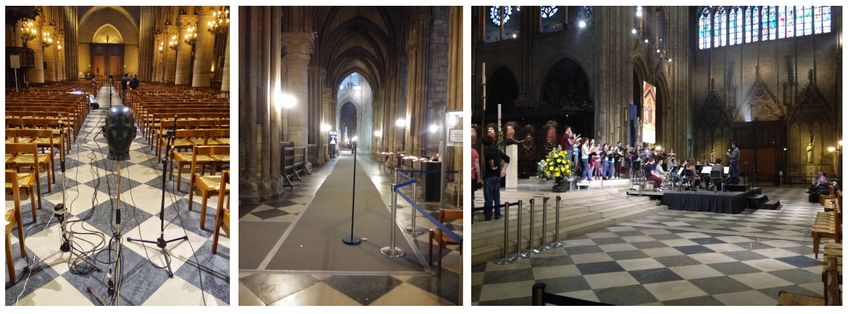
(b)
Photosof
Figure2.2.Photos
Figure of conditions for
for the
the(a)
(a)2015,
2015,highlighting
highlightingmeasurement
measurement equipment,
equipment, carpet runner,
carpet and
runner,
small
and concert
small risers
concert in place
risers during
in place the measurement
during session;
the measurement (b) 2020,
session; (b) highlighting microphone
2020, highlighting tripods
microphone
pulled by
tripods remote
pulled bycontrolled robot, barrier,
remote controlled robot,and generaland
barrier, empty state empty
general of the nave
stateduring
of thethe measurements.
nave during the
measurements.
Measurement equipment output—The audio output was sent to an amplifier (SAMSOM, model
Servo 120a, Hicksville,
3.3. Measurements USA)
Post-Fire and sequentially
during to four
Reconstruction, 2020miniature dodecahedral sound sources (Dr-Three,
model 3D-032, Tokyo, Japan). Signal—The excitation signal was based on the Swept Sine method.
Access was granted to the reconstruction site and acoustic measurements were carried on the 30
The sweep frequency rose exponentially over 20 s from 20 to 20,000 Hz. However, due to the frequency
June 2020. Due to the restrictions on the work site, only certain areas were accessible. Due to the risk
response of these specific speakers, there was insufficient energy below the 250 Hz octave band for
of falling debris, the central nave and transept was off-limits to people, as detailed in Figure 1c. The
analysis. The sweep was played at a sample rate of 44.1 kHz using the DAW software Reaper and
central part of the transept/altar marble floor was damaged by the falling spire. The choir area was
sound card (RME, Fireface 800, Haimhausen, Germany).
cluttered with debris, sorted by the recovery team, and therefore totally inaccessible. Many of the
Measurement equipment input—The reverberated signal was recorded by two measurement
side altars have been used to store objects. There was also scaffolding installed for the removal of the
chains as the measured session was carried out in conjunction with a concert recording installation.
organ and a protection barrier (construction fencing and waist-height perforated metal panels)
(I) The sweep was recorded at a sample rate of 44.1 kHz by 5 omni-directional microphones (4 DPA
surrounding the central nave. See photos in Figure 2b; a short video documenting the measurement
(Alleroed, Denmark), model 4006 (1–4) and 1 Schoeps (Karlsruhe, Germany) model MK5 omni (5),
session is available online (https://youtu.be/YLi7ASosKvw).
1 dummy-head (KU-80, equipped with DPA 4060) and a 1st-order Ambisonic microphone (Core Audio,
Measurement protocol—Figure 1c shows the measurement plan highlighting S-R positions for
Tetramic, Teaneck, NJ, USA), all recorded using a sound card (RME, Fireface 800). (II) The sweep was
the 2020 measurement. Source position S1 was chosen for the loudspeaker, so as to be as close as
recorded at a sample rate of 48 kHz by the other 11 omni-directional microphones (6 DPA model 4006
(11–16), 5 Schoeps model MK5 omni, (6–10)) and using a sound card (RME, Micstacy).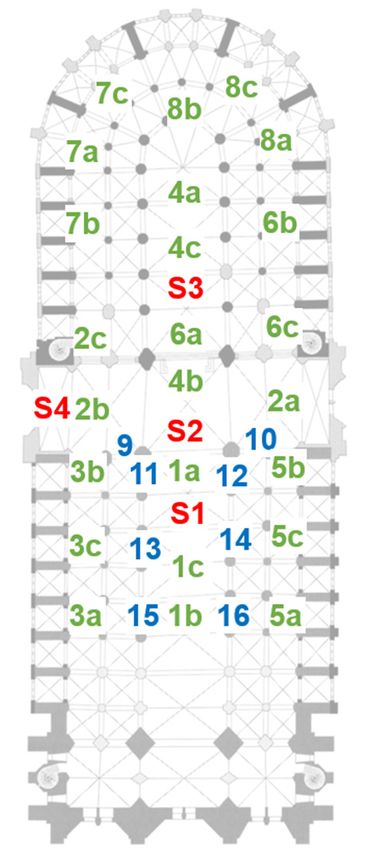
Acoustics 2020, 2                                                                                    795

3.3. Measurements Post-Fire during Reconstruction, 2020
     Access was granted to the reconstruction site and acoustic measurements were carried on the
30 June 2020. Due to the restrictions on the work site, only certain areas were accessible. Due to the
risk of falling debris, the central nave and transept was off-limits to people, as detailed in Figure 1c.
The central part of the transept/altar marble floor was damaged by the falling spire. The choir area
was cluttered with debris, sorted by the recovery team, and therefore totally inaccessible. Many of
the side altars have been used to store objects. There was also scaffolding installed for the removal of
the organ and a protection barrier (construction fencing and waist-height perforated metal panels)
surrounding the central nave. See photos in Figure 2b; a short video documenting the measurement
session is available online (https://youtu.be/YLi7ASosKvw).
     Measurement protocol—Figure 1c shows the measurement plan highlighting S-R positions for the
2020 measurement. Source position S1 was chosen for the loudspeaker, so as to be as close as possible
to positions used in previous measurements, given the access constraints. Source position S2 was used
for hand-held impulse sources, as this was the closest position to S1 achievable. A remote controlled
robot (used for tunnel inspections) was employed to pull microphones installed on wheeled tripods.
Microphone positions 1–5 represented the first measurement trajectory. Due to the time remaining, the
return trajectory by the robot (positions 6–19) allowed for a denser distribution. Sweeps were played
from position S1.
     Measurement equipment output—The source was a battery powered dodecahedron acoustic
source (Look Line, S103 ACDC, Massa Finalese, Italy), equipped with its own internal amplifier and
sweep generator, remote controlled, positioned at source position S1. The excitation signal was the
internal 20 s Swept Sine. Several supplemental impulsive stimuli, starter pistol gun shots and balloon
bursts, were made from source position S2, at the limits of the exclusion zone.
     Measurement equipment input—The reverberated signal was recorded on a variety of portable
recording devices, in order to limit cabling and clutter due to the robot manipulations. Recordings
were made using two omni-directional microphones (Bedrock, BAMT1 1/2”, Delft, The Netherlands)
connected to a portable recorder (Zoom, H6, Tokyo, Japan) in addition to one MS pair (Zoom, H6).
Two 3D microphones (Core Audio, Tetramic and Octomic) were recorded onto portable recorders
(Zoom, F8,). Finally, two autonomous 3D microphones (Zoom, H3-VR) were used, one in conjunction
with a 360◦ camera (Samsung, Gear360, Seoul, South Korea). Source/receiver heights were 1.7 m,
limited by the wheeled-tripod apparatus used to place the equipment.

3.4. Post-Processing
     Subsequent deconvolution for swept sine stimuli, sample rate conversion, and post-processing
steps were performed in MATLAB. RIRs were analyzed using our in-house MATLAB IR analysis (IRA)
toolkit in accordance with the ISO 3382 standard [19].

3.5. Architectural Details
     The Cathédrale Notre-Dame de Paris is approximately 130 m long, 48 m wide, and 35 m high.
     In a telephone conversation with the office of the Cathédrale Notre-Dame de Paris, it was confirmed
that a carpet runner was installed in several areas and two confirmation booths were added in the
two chapels (side alcoves or bays) adjacent to the first two bays of the south naves during this time
period. As such, the difference between 1987 and 2015 is principally the installation of a carpet runner
(see Figures 2a and 3a). From the 2015 to 2020, the principal differences following the fire are the
removal of the carpet runner, the removal of the pews, and the holes in the vaulted ceiling. Figure 3b
shows the principal reported holes in the ceiling from the restoration team. The size of the holes in the
architectural drawing was estimated at 263 m2 , using a 2D projection (ignoring elevation topology).
This equates to about 1% of the bounding box’s surface area, based on the above dimensions.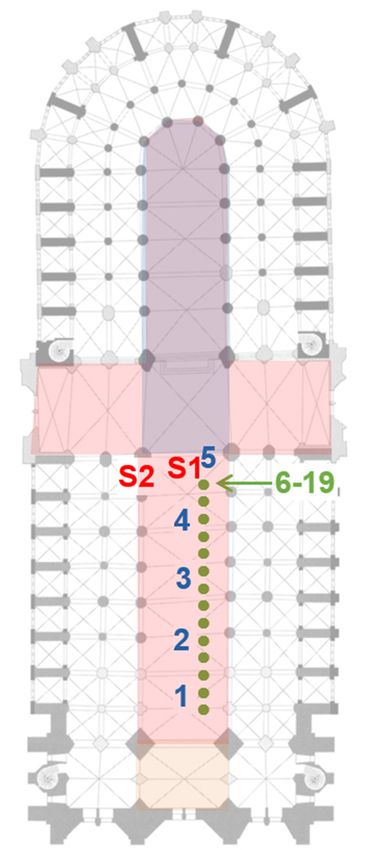
re 3b shows the principal reported holes in the ceiling from the restoration team. The size o
s in the architectural drawing was estimated at 263 m2, using a 2D projection (ignoring elev
logy). This equates to about 1% of the bounding box’s surface area, based on the a
             Acoustics 2020, 2                                                 796
ensions.

tics 2018, 1, x FOR PEER REVIEW                                     (a)

                                                                    (b)
                  Figure 3. Schematics
 Figure 3. Schematics       of the of    the Cathédrale Notre-Dame
                                       Cathédrale           Notre-Dame de Paris highlighting
                                                                                 de Paris    specific surfaces. (a) Computer
                                                                                                highlighting           specific surfaces. (a
                  model highlighting pew locations (yellow) and carpet runner addition (red); (b) Architectural plans
 Computer model        highlighting
                  indicating                pew
                             the principal holes (red)locations       (yellow)
                                                       in the vaulted ceiling (2020). and carpet runner addition (red); (b
 Architectural4.plans  indicating
                 Measurement    Resultsthe principal holes (red) in the vaulted ceiling (2020).

                  4.1. Acoustic Parameters
easurement Results
                     Due to the variations in source/receiver positions over the three measurement sessions, and the
                drastic differences in conditions for the 2020 measurements, preliminary analysis presented here
Acoustic    Parameters
                focuses on reverberation time measurements, rather than parameters which are more sensitive to
                local architectural features. Mean reverberation times (T20) were calculated over omnidirectional
                microphones in all three measurement conditions, shown in Figure 4a.
 Due to the variations in source/receiver positions over the three measurement sessions, an
tic differences in conditions for the 2020 measurements, preliminary analysis presented
ses on reverberation time measurements, rather than parameters which are more sensiti
  architectural features. Mean reverberation times (T20) were calculated over omnidirect
ophones in all three measurement conditions, shown in Figure 4a.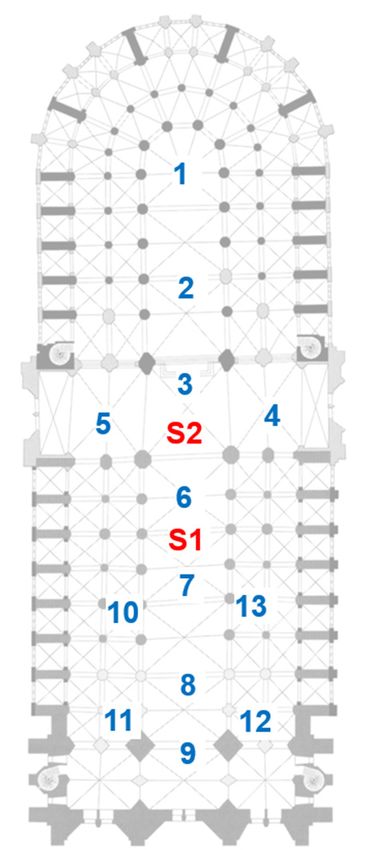
4.1. Acoustic Parameters
            Due to the variations in source/receiver positions over the three measurement sessions, and the
      drastic differences in conditions for the 2020 measurements, preliminary analysis presented here
      focuses on reverberation time measurements, rather than parameters which are more sensitive to
      local architectural features. Mean reverberation times (T20) were calculated over omnidirectional
Acoustics 2020, 2                                                                                                          797
      microphones in all three measurement conditions, shown in Figure 4a.

                                (a)                                                      (b)

                                                             (c)
           Figure 4. Summary of mean reverberation time over receivers, example decay curve, and coupled
           volume analysis, (a) Mean reverberation time (T20) over omnidirectional microphones with standard
     Figureerror bars. 2020 results
              4. Summary      of meanshow    those for sweep
                                        reverberation     timestimuli  (S1) and impulse
                                                                over receivers,  example source
                                                                                           decaygun-shots   (S2, Rec
                                                                                                   curve, and    coupled
           positions 1–5); (b) Example  of  octave band filtered RIC decays, normalized, optimized  SNR
     volume analysis, (a) Mean reverberation time (T20) over omnidirectional microphones with standard   truncation,
     error 2020
           bars.sweep  stimuli show
                  2020 results  data-set; (c) ouble-slope
                                      those               decay 500
                                              for sweep stimuli  (S1)Hz-octave bandsource
                                                                      and impulse   analysis distributions
                                                                                           gun-shots  (S2, showing
                                                                                                           Rec positions
           Early and Late reverberation times and the relative time (BPt) and level (BPdB) of the identified
     1–5); (b) Example of octave band filtered RIC decays, normalized, optimized SNR truncation, 2020
     sweep stimuli data-set; (c) ouble-slope decay 500 Hz-octave band analysis distributions showing Early
     and Late reverberation times and the relative time (BPt ) and level (BPdB ) of the identified bending
     point in the RIC decay curves ([20] for parameter details). Notched boxplots show the median, 95%
     confidence interval, 25th and 75th percentiles of the data spread.

      The 2020 measurement protocol employed non-synchronized audio input/output devices.
While differences in exact clock rates between devices could results in temporal distortions of the
deconvolved signal, Hak and Hak [21] have shown that such errors are less significant for sweep stimuli
when compared to MLS signals. In addition, typical clock errors were found in that study to be sufficiently
small, such that expected deviations in reverberation time would be less than a few percent. To verify the
asynchronous measures, reverberation times were also calculated for the 2020 impulsive source gun shots,
made from source position S2. Results show differences between the two measurement methods varied
within standard error across positions and frequencies, except for the 250 Hz band which showed slightly
higher values (by 7%) and the 125 Hz band which lacked sufficient energy for analysis.
      Examining reverberation time across measurement sessions, a mean reduction of 8% is observed
from 1987 to 2015. Comparison between 2015 and 2020 shows a markedly more significant reduction,
mean decrease in T20 of 20%, across frequency bands.
      Closer inspection of the RIR can provide additional information. An example of the RIC, used to
calculate the above room acoustic parameters, is shown in Figure 4b. Decay curves show a sharp step, or
“cliff” response, as has been observed in open-air theatres [22]. This is reasonable, considering the lack
of proximal reflecting surfaces, other than the smooth empty floor. Some slight change in decay rate is
apparent between the earlier and later part of the response, indicating a lightly coupled volume behavior.
      Further analysis of this has been carried out, using the marching line multiple slope analysis
method [23,24]. For brevity, this analysis has been limited to the 500 Hz octave band filtered RIRs,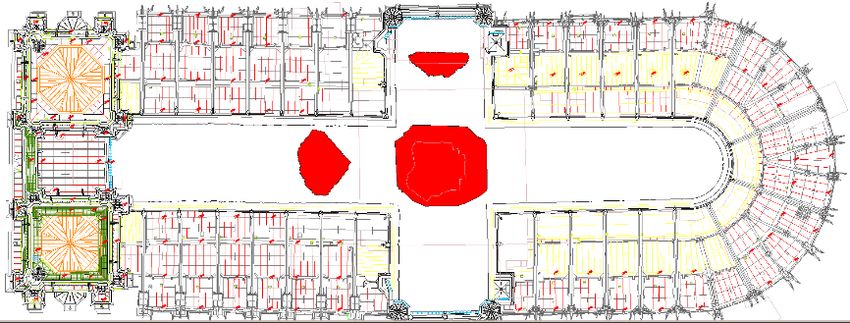
Acoustics 2020, 2                                                                                          798

and compares the 2020 measurements with the subset of 2015 measurements using comparable source
and receiver positions to the reduced measurement zone in 2020. This method estimates the early
and late decay rates in the RIC, in addition to characterizing the bending point in both time and level
relative to the RIR onset. As the behavior of coupled volume decays varies with respect to source and
receiver position within the complex architecture [25], the distribution of results are presented for each
parameter, comparing the 2015 and 2020 RIRs, for source and receiver positions in the lower part of the
nave (the common measurement area in the two datasets).
      Results of the non-linear decay analysis, shown in Figure 4c, reflect the general decrease in
reverberation times indicated in Figure 4a, while also highlighting the problem of using the ISO
parameters when non-linear decays are present. Results show a decrease in both Early and Late decay
rates, indicating reductions in both the primary and secondary “volumes”. In the case of Notre-Dame,
the delimitation of the different acoustic volumes is not as stark and evident as in coupled reverberation
concert hall designs. However, the transept could be considered as rather different from other spaces,
due to its high ceiling, while side areas (except for the transept) have multiple levels. As the holes in the
vaulted ceiling are in the region of the transept (Figure 3b), but one of the holes is over the source/receiver
region, the damage could be imagined to affect multiple acoustic “volumes”. The reduction in decay rates
in these volumes also results in a decrease in the bending point time and, to a lesser extent, level, and it is
noted that all of these parameters are linked to the acoustic coupling conditions. The variability in Late
reverberation times for the 2015 condition could be attributed to the complexity of the space, and the
various acoustic zones, leading to more than a simple double-slope decay, and rather higher order coupling.
Further analysis and measurements would need to be carried out to examine this supposition further.
      Finally, considering perceptual detectability, following Luizard et al. [20], the mean
just-noticeable-difference (JND) for Early decay rates in coupled conditions can be on the order
of 7% to 10%, and twice that for Late decays. Similarly, the JND for BPt is on the order 15% to 30%,
which covers the differences observed here. As such, it can be confidently stated that the differences in
the acoustic conditions are clearly audible.

4.2. Spatial Analysis
     Spatial room impulse responses (SRIR) can be used for a comparative directional analysis of
room acoustics. The method chosen here is a parametric approach, the Spatial Decomposition Method
(SDM) [26]. It is based on the assumption that the sound field can be described as a succession of plane
waves and thus a SRIR can be decomposed into a set of discrete pressure values and their corresponding
direction of arrival (DOA), i.e., an image-source is attributed at each time sample. For this, a small
time window centered on the sample of interest is applied to the SRIR and the DOA is estimated
by least squares solution for the time difference of arrival (TDOA) estimates. The pressure value is
assigned using ideally an omnidirectional impulse response at the center of the array. This method
has been used for analysis and auralization of concert hall SRIR [27], and also for their graphical
representation [28]. These tools are implemented in a MATLAB package, the SDM Toolbox [29].
     SDM analysis was applied to the 2015 and 2020 measurements made with the same 3D tetrahedral
microphone array. DOA were estimated using the A-format signals (representing a tetrahedral array
of near-coincident cardioid microphones). The analysis window was set to the minimal allowed size
defined by twice the time it takes for an impulse to travel through the array, for the microphone used,
representing approximately 0.4 ms. To obtain the pressure value at the center of the microphone,
necessary for graphical representation of SRIR, the post-processed B-format omnidirectional W-channel
signal was used, as such assignment should be applied to a direction independent RIR. Results in
the median and lateral planes for a similar source-receiver pair position are shown in Figure 5. It is
important to note that in 2020, there were no pews, with the floor being empty. In contrast, in 2015
there were both pews and some stage risers and, chairs, and music stands for the music performance
(see Figure 2a). In comparing these results, several observations can be made.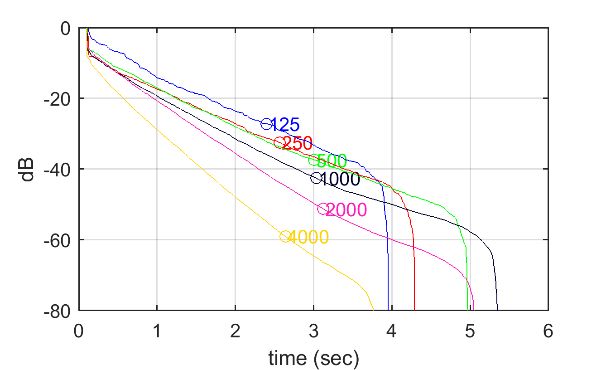
Acoustics 2020, 2                                                                                                         799

Acoustics 2018, 1, x FOR PEER REVIEW                                                                                 9 of 12

                                                           (a)

                                                           (b)
     Figure   5. SDM analysis showing cumulative energy polar distribution curves from 0 ms to [10, 50,
      Figure 5. SDM analysis showing cumulative energy polar distribution curves from 0 ms to [10, 50,
     100,
      100, 200,300,
          200,   300,500,
                      500,1000]
                           1000]ms,
                                 ms,band
                                     bandpass
                                           passfiltered
                                                filtered100
                                                         100HzHzto
                                                                 to5000
                                                                    5000Hz,
                                                                         Hz,5° 5◦sliding
                                                                                  slidingaverage.
                                                                                            average.Source
                                                                                                     Sourceposition
                                                                                                              position
     indicated
      indicated (red dot). (a) SDM analysis: state 2015, Src S2–Rec 1c; (b) SDM analysis: state 2020,Src
                 (red dot). (a) SDM  analysis: state 2015, Src  S2–Rec  1c; (b) SDM    analysis:  state 2020,   SrcS1,
                                                                                                                    S1,
     Rec  16.  Longitudinal   cross-sections obtained   from   the digital  platform   of  the CNRS/MC      scientific
      Rec 16. Longitudinal cross-sections obtained from the digital platform of the CNRS/MC scientific action
     action
      for thefor the restoration
               restoration       of Notre-Dame
                           of Notre-Dame         de Paris,
                                           de Paris,       source:
                                                      source:       3D laser-scanning
                                                              3D laser-scanning           by Andrew
                                                                                   by Andrew     TallonTallon  (2016).
                                                                                                         (2016).

5. Discussion and Future Work
Acoustics 2020, 2 800
Concerning the direct sound, 2015 shows this as well localised and sharp (slightly elevated, which
corresponds to its position and the fact that the source was raised at the time). The floor reflection is
not visible, likely due to the presence of chairs and pews. In 2020, the direct sound “lobe” is broader,
less sharp. Examining the side-view plot, the direct sound (actually the initial 0 ms to 10 ms window of
the response) exhibits a slightly negative elevation. This is likely due to the empty flat floor, where the
strong floor reflection is counted within the 10 ms analysis window, thereby lowering and broadening
the early part of the response.
Concerning the cumulative energy, in 2015 this increases rather smoothly and uniformly from all
directions, as represented by the regular radial spacing between subsequent energy contour curves,
with the largest increase from 100 to 200 ms, thus reflections arriving with path differences of 35 to
70 m after the direct sound, mainly attributed to the vaulted ceiling. The first increase in lateral energy
occurs from 10 to 50 ms after the arrival of direct sound, coinciding with reflections from the rows of
columns in the nave as well as the side balconies. The final analysis window comprising 0 to 1000 ms
is quite round at a relative level of −10 dB, both in plane and section. In contrast, 2020 results show
a more step-function decrease in energy after the initial time window, as mentioned in the earlier
analysis, indicating a lack of progressive reflection accumulation over time, especially in the vertical
direction. The relative cumulative level between 200 and 1000 ms, averaged over all directions, is 2 dB,
which is 2 dB lower than the 2015 results.
5. Discussion and Future Work
As data from [13,14] were comparable to the 2015 measurements, it can be concluded that changes
leading to the shorter reverberation time estimations were carried out between 1987 and 1996. As the
volume of the Cathédrale Notre-Dame de Paris is rather large, the reverberation time difference has
to be the result of substantial changes. The possibility of the atmospheric conditions influencing the
reverberation time results can also be considered. However, as temperature and relative humidity
mainly effect reverberation estimations above 1000 Hz [30], this can be excluded as the cause for the
decrease in reverberation time. The carpet runner is therefore a likely candidate.
The decrease in reverberation time since the destructive fire of 2019 is clearly evident. The same
differences were observed using both swept-sine and impulsive sources and relatively proximal
positions. The architectural elements inducing the drastic reduction in T20 of 20% remain to be verified.
Non-linear decay rates, or coupled acoustic volume analysis, highlight the fact that the changes are
large in scale, affecting different areas of the cathedral, for which the holes in the vaulted ceiling are
likely candidates for at least a significant contribution. Subsequent work will require identifying the
acoustic effects of the fire damage relative to the effects of the temporary installations in place and
remaining debris.
As a geometrical acoustic model of the Cathédrale Notre-Dame de Paris was created and calibrated
from the 2015 measurements for the production of a virtual concert reconstruction based on a concert
performance recording on 24 April 2013 [31], future work on the cathedral’s acoustics can employ this
computer model, the recent measurements, and simulations to adapt the model to the evolving state
of the building. As recent studies have shown the reliability of numerical simulations for studying
complex and coupled acoustic conditions [24], as well as perceptual viability [32], such geometrical
acoustic analysis efforts can be expected to be reliable in the cathedral. Initial efforts will focus on the
2020 post-fire state, in order to attribute the acoustic impact of the various changes. These results will
be made available to the reconstruction team and the model can then be further employed to evaluate
the acoustic impact of architectural reconstruction proposals during the project.
In the same manner that the acoustic model can be used to study possible evolutions during
the reconstruction, it can also be used to explore the evolution of the acoustics of the Cathédrale
Notre-Dame de Paris since its construction over 850 years ago. As many elements of the cathedral have
changed over the centuries, from the various architectural renovations and damage which occurred
during the French revolution, to the varied decorations employed for different events, both religiousAcoustics 2020, 2 801
and political, and across the seasons, the acoustics of the Cathédrale Notre-Dame de Paris was not
a constant throughout history but an evolving intangible product of its environment and human
occupation. Combined with historical research efforts, the acoustic model and associated virtual
simulations can be used to explore and experience these previous states [33].
Author Contributions: Conceptualization, B.F.G.K. and A.W.; methodology, B.F.G.K. and A.W.; software, B.F.G.K.;
validation, B.F.G.K. and A.W.; formal analysis, B.F.G.K. and A.W.; investigation, B.F.G.K. and A.W.; resources,
B.F.G.K.; data curation, B.F.G.K.; writing—original draft preparation, B.F.G.K. and A.W.; writing—review and
editing, B.F.G.K. and A.W.; visualization, B.F.G.K. and A.W.; supervision, B.F.G.K.; project administration, B.F.G.K.;
funding acquisition, B.F.G.K. All authors have read and agreed to the published version of the manuscript.
Funding: This work was funded in part through “Chantier Scientifique Notre-Dame”, and the CNRS Mission pour
les initiatives transverses et interdisciplinaires (MITI). Additional support has been provided by the EU JPI Cultural
Heritage project PHE, exploring cultural heritage of architectural acoustics and soundscapes. The 2015 stages of
this work were funded in part by the French projects ECHO (Grant No. ANR-13-CULT-0004), echo-projet.limsi.fr
and BiLi (Grant No. FUI-AAP14, www.bili-project.org).
Acknowledgments: Special thanks to Cathédrale Notre-Dame de Paris personnel for their assistance and patience
during the measurements. We also thank Michèle Castellengo who made available the original data recordings
from 1987, carried out by the Laboratoire d’Acoustique Musicale at the request of the Ministère de la Culture. The authors
are indebted to Bart Postma, Julie Meyer, and Jean-Marc Lyzwa (CNSM) for their assistance during the 2015
measurements. Additional thanks to Tapio Lokki for discussions regarding the SDM analysis and Frédéric Billiet
for his contribution of the musicological history of Notre-Dame. We would finally like to thank Escadrone for
their help and instruction in renting the robot necessary for moving the equipment in the 2020 measurements.
Conflicts of Interest: The authors declare no conflict of interest. The funders had no role in the design of the
study; in the collection, analyses, or interpretation of data; in the writing of the manuscript, or in the decision to
publish the results.
References
1. Girón, S.; Álvarez Morales, L.; Zamarreño, T. Church acoustics: A state-of-the-art review after several
decades of research. J Sound Vib. 2017, 411, 378–408. [CrossRef]
2. Martellotta, F. Understanding the acoustics of Papal Basilicas in Rome by means of a coupled-volumes
approach. J. Sound Vib. 2016, 382, 413–427. [CrossRef]
3. Sü Gül, Z. Acoustical Impact of Architectonics and Material Features in the Lifespan of Two Monumental
Sacred Structures. Acoustics 2019, 1, 493–516. [CrossRef]
4. D’Orazio, D.; Fratoni, G.; Rossi, E.; Garai, M. Understanding the acoustics of St. John’s Baptistery in Pisa
through a virtual approach. J. Build. Perform. Simul. 2020, 13, 320–333. [CrossRef]
5. Postma, B.N.; Tallon, A.; Katz, B.F. Calibrated Auralization Simulation of the Abbey of Saint-Germain-des-Prés
for Historical Study; International Conference on Auditorium Acoustics: Paris, France, 2015; Volume 37,
pp. 190–197.
6. Anderson, J.; Bratos-Anderson, M. Acoustic Coupling Effects in St Paul’s Cathedral, London. J. Sound Vib.
2000, 236, 209–225. [CrossRef]
7. Handschin, J. Zur Geschichte von Notre-Dame. Acta Mus. 1932, 4, 5–17. [CrossRef]
8. Wright, C. Music and Ceremony at Notre-Dame de Paris; Cambridge University Press: Cambridge, MA, USA,
1989; pp. 500–1500.
9. Anonymous, I.V.; Yudkin, J. The Music Treatise of Anonymous IV: A New Translation; Musicological Studies and
Documents; American Institute of Musicology: Münster, Germany, 1985.
10. Roesner, E.H. Le Magnus Liber Organi de Notre-Dame de Paris; Vol. 1, Les Quadrupla et Tripla de Paris, Musica
Gallica; Editions de l’Oiseau-Lyre: Monaco, Monaco, 1993.
11. L’École Épiscopale [The Episcopal School]. Available online: https://www.notredamedeparis.fr/decouvrir/
musique/lecole-episcopale/ (accessed on 22 September 2020).
12. Postma, B.N.; Katz, B.F.G. Acoustics of Notre-Dame Cathedral de Paris. In Proceedings of the International
Congress on Acoustics (ICA), Buenos Aires, Argentina, 5–9 September 2016; pp. 0269:1–10.
13. Hamayon, L. Comprendre Simplement l’Acoustique des Bâtiments; Le Moniteur Editions: Antony, France, 1996;
ISBN 978-2-281-11682-3.
14. Mercier, D. Le Livre des Techniques du Son, 4th ed.; Dunod: Malakoff, France, 2002.Acoustics 2020, 2 802
15. Castellengo, M.; Fabre, B.; Vivie, E. Etude Acoustique pour la Situation d’un Nouvel Orgue à Notre-Dame de Paris;
Technical Report; Laboratoire d’Acoustique Musicale de l’Université Paris VI: Paris, France, 1987.
16. Martellotta, F.; Cirillo, E.; Carbonari, A.; Ricciardi, P. Guidelines for acoustical measurements in churches.
Appl. Acoust. 2009, 70, 378–388. [CrossRef]
17. Pätynen, J.; Katz, B.; Lokki, T. Investigations on the balloon as an impulse source. J. Acoust. Soc. Am. 2011,
129, EL27–EL33. [CrossRef] [PubMed]
18. Postma, B.N.; Katz, B.F.G. Correction method for averaging slowly time-variant room impulse response
measurements. J. Acoust. Soc. Am. 2016, 140, EL38–EL43. [CrossRef] [PubMed]
19. ISO 3382-1:2009(E). Measurement of the Reverberation Time of Rooms with Reference to Other Acoustical Parameters;
ISO: Geneva, Switzerland, 2009.
20. Luizard, P.; Katz, B.F.; Guastavino, C. Perceptual thresholds for realistic double-slope decay reverberation in
large coupled spaces. J. Acoust. Soc. Am. 2015, 137, 75–84. [CrossRef] [PubMed]
21. Hak, C.; Hak, J. Effect of Stimulus Speed Error on Measured Room Acoustic Parameters. In Proceedings of
the International Congress on Acoustics (ICA), Madrid, Spain, 2–7 September 2007; pp. 1–6.
22. Astolfi, A.; Bo, E.; Aletta, F.; Shtrepi, L. Measurements of Acoustical Parameters in the Ancient Open-Air
Theatre of Tyndaris (Sicily, Italy). Appl. Sci. 2020, 10, 5680. [CrossRef]
23. Luizard, P.; Katz, B.F. Investigation of the effective aperture area of sliding and hinged doors between coupled
spaces. J. Acoust. Soc. Am. 2014, 136, EL135–EL141. [CrossRef] [PubMed]
24. Weber, A.; Katz, B.F.G. Numerical Simulation Round Robin of a Coupled Volume Case as Compared to Scale
Model Measurements. In Proceedings of the International Congress on Acoustics (ICA), Aachen, Germany,
9–13 September 2019; pp. 6051–6058. [CrossRef]
25. Luizard, P.; Polack, J.D.; Katz, B.F. Sound energy decay in coupled spaces using a parametric analytical
solution of a diffusion equation. J. Acoust. Soc. Am. 2014, 135, 2765–2776. [CrossRef] [PubMed]
26. Tervo, S.; Pätynen, J.; Kuusinen, A.; Lokki, T. Spatial decomposition method for room impulse responses.
J. Acoust. Soc. Am. 2013, 61, 17–28.
27. Pätynen, J.; Lokki, T. Concert halls with strong and lateral sound increase the emotional impact of orchestra
music. J. Acoust. Soc. Am. 2016, 139, 1214–1224. [CrossRef] [PubMed]
28. Pätynen, J.; Tervo, S.; Lokki, T. Analysis of concert hall acoustics via visualizations of time-frequency and
spatiotemporal responses. J. Acoust. Soc. Am. 2013, 133, 842–857. [CrossRef] [PubMed]
29. Tervo, S. SDM Toolbox 1.3001. Available online: https://www.mathworks.com/matlabcentral/fileexchange/
56663-sdm-toolbox (accessed on 17 September 2020).
30. Benedetto, G.; Spagnolo, R. A method for correcting the reverberation times of enclosures as a function of
humidity and temperature. Appl. Acoust. 1983, 16, 463–470. [CrossRef]
31. Postma, B.N.; Poirier-Quinot, D.; Meyer, J.; Katz, B.F. Virtual Reality Performance Auralization in a Calibrated
Model of Notre-Dame Cathedral; Euroregio: Porto, Portugal, 2016; pp. 6–10.
32. Postma, B.N.; Katz, B.F. Perceptive and objective evaluation of calibrated room acoustic simulation
auralizations. J. Acoust. Soc. Am. 2016, 140, 4326–4337. [CrossRef] [PubMed]
33. Katz, B.F.G.; Murphy, D.; Farina, A. The Past Has Ears (PHE): XR Explorations of acoustic spaces as
Cultural Heritage. In Proceedings of the International Conference on Augmented Reality, Virtual Reality
and Computer Graphics, Leece, Italy, 7–10 September 2020; Lecture Notes in Computer Science. Springer:
Cham, Switzerland, 2020; pp. 91–98. [CrossRef]
Publisher’s Note: MDPI stays neutral with regard to jurisdictional claims in published maps and institutional
affiliations.
© 2020 by the authors. Licensee MDPI, Basel, Switzerland. This article is an open access
article distributed under the terms and conditions of the Creative Commons Attribution
(CC BY) license (http://creativecommons.org/licenses/by/4.0/).You can also read