Stock Idea Repco Home Finance Limited
←
→
Page content transcription
If your browser does not render page correctly, please read the page content below
Stock Idea
Sector: Banks & Finance                                 January 11, 2021

          Repco Home Finance Limited

                Worthy choice in niche spot

             Powered by Sharekhan’s 3R Research Philosophy
Stock Idea
Repco Home Finance Limited
Worthy choice in niche spot
Powered by the Sharekhan 3R Research Philosophy Banks & Finance Sharekhan code: REPCOHOME Initiating Coverage
3R MATRIX + = - Summary
Right Sector (RS) ü We initiate coverage on Repco Home Finance Ltd (RHFL) with a Buy and PT of Rs. 330.
Repco is an attractively valued HFC with a niche loan book (salaried & professional
Right Quality (RQ) ü class borrowers), stable asset quality, strong ratings and good return ratios.
With disbursements gaining pace since September, company return to growth in
Right Valuation (RV) ü FY2021E itself; collection efficiency at 93% in September.
Stock has corrected ~72% from highs; multiples have fallen to 0.9x forward ABVPS
+ Positive = Neutral - Negative from 2.5x. Valuation reasonable at 0.9x/0.8x FY22E / FY23E, considering healthy
ROE of 14+%; ROA of over 2.3%; easy liquidity and declining cost of funds that will
shield NIMs from medium-term risks.
Reco/View
Repco Home Finance (RHFL) is an attractively valued housing finance company (HFC) with
Reco: Buy a niche loan book (salaried/professional borrower mix is 48:52, Tamil Nadu forms 56% of
loan book) with stable asset quality, strong ratings and good return ratios. The HFC is well
CMP: Rs. 252 capitalised and has a strong business model. Despite the fierce competition in the home loan
market, Repco’s presence in the niche small-ticket, non-salaried home loan segment has helped
it maintain attractive spreads as compared to peers as well as face lesser competition from
Price Target: Rs. 330 banks, etc. RHFL has an attractive business model of housing mortgages, which caters to a
segment largely under-served by banks and other NBFCs. Small ticket, non-salaried borrowers
represent an attractive but challenging business opportunity (granular segment, which requires
a player with diligent risk management, deep understanding and high level of servicing).
Company details Hence, despite the segment comparatively offering higher yields, banks and large HFCs have
found it difficult to penetrate in this space. Industry reports indicate that while housing sales in
Market cap: Rs. 1,574 cr Chennai fell by 43% in 2020 due to COVID-19 and its impact, the Confederation of Real Estate
Developers’ Association of India (CREDAI) has indicated that sales have picked up in the past
52-week high/low: Rs. 366/91 four months. For Repco, however, disbursements have picked up pace since September and
the HFC is looking to return to growth in FY2021E itself. In Q3FY21, we expect stable NIMs and
NSE volume: near normal disbursements for RHFL. Its collection efficiency for September 2020 stood at
3.6 lakh 93% with 90+ days per due (dpd) stable at 4%. We believe that developments such as increased
(No of shares) pricing changes will help offset for medium term possible credit risks emanating. Moreover,
easy funding availability has aided in a fall in cost of funds, and hence we expect NIMs to be
BSE code: 535322 protected from risks in the medium term as RHFL substitutes high‐cost liabilities with low‐cost
ones. While NBFC-HFCs operate in the smaller-ticket size housing loan segment, we believe
NSE code: REPCOHOME that experience & knowledge are key differentiators for HFCs and this facet makes it difficult
banks to compete. This explains why RHFL has been able to maintain its NIMs at ~4.5% despite
Free float: interest rate cycles and fierce competition in the home loan market. A strong business model,
3.9 cr stable ratings and strong historical underwriting, with attractive return ratios make RHFL one
(No of shares) of the attractive players in the niche housing finance space, and we believe that the economic
recovery, improving demand and a resilient rural economy brighten the growth outlook. We
initiate coverage on the stock with a Buy Rating and price target of Rs. 330.
Shareholding (%) Our Call
Valuation: Repco Home Finance is available at 0.9x/0.8x FY22E / FY23E which we believe is
Promoters 37.1 reasonable considering the healthy return ratios (ROE at over 14%; ROA at over 2.3%). Repco
has focused on niche, small-ticket, non- salaried home loans, resulting in higher spreads for
FII 19.8 the company, along with reasonably controlled Asset quality. Going forward, we believe
margins to sustain as disbursement growth picks up spreads could moderate given competition
DII 20.1 and pressure on yields. We expect EPS growth to clock a ~10% CAGR over FY20-23E, with
stable asset quality. The stock has corrected by ~72% from highs and valuation multiples too
Others 23.0 have fallen to 0.9x forward ABVPS from 2.5x earlier. Hence, we believe that the risk-reward is
favourable for long-term investors. A strong business model, stable ratings and strong historical
underwriting, with attractive return ratios make RHFL among the attractive players in the niche
Housing financing space, and we believe that with economic recovery demand along with
Price chart resilient rural economy brighten the growth outlook. We initiate coverage on the stock with a
400.0 Buy Rating and price target of Rs. 330.
300.0 Key risk
Delayed recovery in economic activity and an adverse interest rate regimen will affect
200.0
growth and profitability.
100.0 Stress of migration of performing assets to banks & other HFCs on account of takeovers
may impact overall asset quality.
0.0
Jan-20
Jan-21
May-20
Sep-20
Valuation Rs cr
Particulars FY19 FY20 FY21E FY22E FY23E
Net Interest Income 469.3 520.5 571.0 602.8 670.2
Price performance PPOP 376.8 419.6 462.2 486.1 544.7
PAT 234.6 280.4 285.2 334.6 381.1
(%) 1m 3m 6m 12m EPS (Rs) 37.5 44.8 45.6 53.5 60.9
Absolute -2.5 26.6 95.6 -22.4 Adj BVPS (Rs) 210.9 233.1 266.6 292.3 323.8
P / EPS (x) 6.7 5.6 5.5 4.7 4.1
Relative to P / ABVPS (x) 1.2 1.1 0.9 0.9 0.8
-9.5 5.2 61.3 -39.6
Sensex ROA (%) 2.2 2.5 2.2 2.3 2.4
Sharekhan Research, Bloomberg ROE (%) 15.4 15.7 14.4 15.0 15.3
Source: Company, Sharekhan estimates
January 11, 2021 2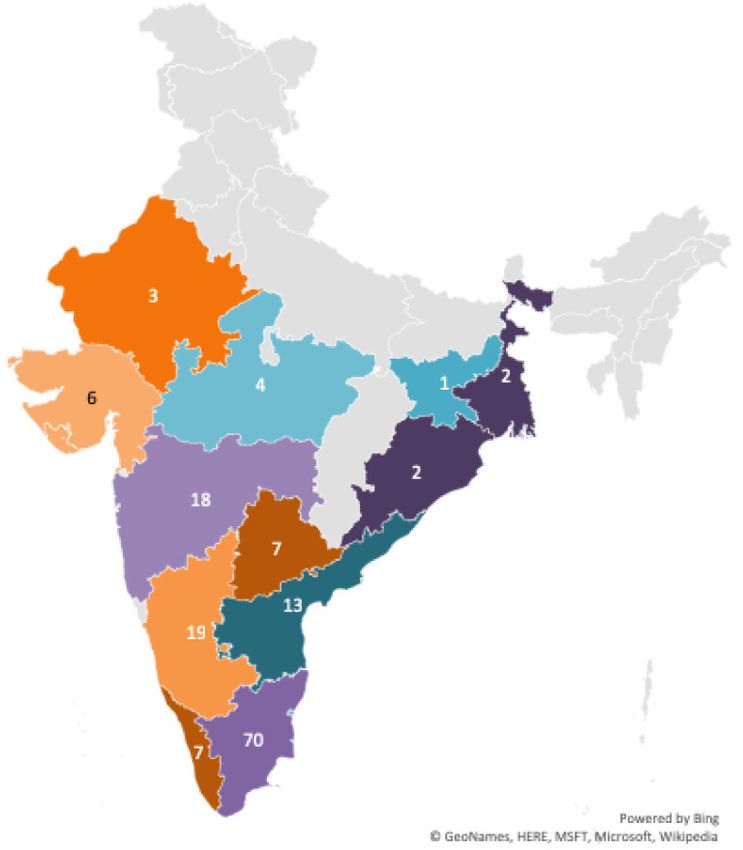
Stock Idea
Powered by the Sharekhan
 3R Research Philosophy

                                       Executive Summary

    3R Research Positioning Summary                     Valuation and return potential
    Right Sector:                                  •   Lowering of AAA and AA NBFC spreads has
     Encouraging demand recovery, lower                 led to Sector re-rating, but upside potential
     funding costs, and improving asset quality         remain as valuations still reasonable.
     trends (high collection efficiency and low
     restructuring pipeline).
                                                    •   Cost to Income ratio to be ~20-21% range,
                                                        with RoEs stable at ~15% for FY2022E and
    Right Quality:                                     FY2023E.
     Repco Home Finance (RHFL) has an attractive
     business model, caters to niche under-served
                                                    •   We initiate coverage with a Buy rating and a
     segment that has low competition from              price target of Rs 330.
     banks, higher margins; strong underwriting
     standards.
    Right Valuation:
     Repco Home Finance is available at 0.9x/0.8x
     FY22E / FY23E ABVPS which we believe is
     reasonable considering the healthy return
     ratios (ROE at 14+%; ROA at 2.3+%).

    Catalysts                                           Earnings and Balance sheet highlights
  Medium Term Triggers
  • Repricing of borrowing book as AAA / AA         •   We expect disbursements to grow by 10%
                                                        y-o-y in H2FY21, AUMs growth to pick up form
     NBFC 1-year spreads have declined, will be
                                                        FY2022E & FY2023E.
     positive for cost of funds.
  • Growth to return from Q4 FY2021E;               •   Asset quality outlook is improving, with
  • Govt sops to boost housing / affordable             September collection efficiency surging to
     housing in Union Budget possible.                  93% and seeing m-o-m improvement trend
  Long-term triggers                                    continuing.
  • Rating upgrades potential due to high           •   Management has indicated ~Rs 300 crores
     capitalisation and improved asset quality          of portfolio can be potentially restructured,
  • Drop in cost of funds and pickup in demand to       which is manageable; and improving cost of
     boost margins                                      funding will be positive for NIMs.
  • Strong GDP recovery to support AUM pick-up      •   Company well-capitalized with Tier 1 ratio at
     in FY2022E and FY2023E                             26.8% (provisional) is positive.

January 11, 2021                                                                                        3
Stock Idea
Powered by the Sharekhan
3R Research Philosophy
Table of Contents Pages
3R Research Positioning Summary 3
Why we like the Financials (NBFC) sector 5
Funding environment has improved, especially for financially strong entities 5
Largely stable Asset quality of HFCs, collections efficiency heatlhy 6
Indian home mortgage sector has long-term tailwinds 7
Housing demand in India is backed by structural, demographic factors 7
Healthy pickup in home sales augurs well for Housing Mortgage sector 8
Underpenetrated Market in Indian Housing Mortges – Provides headroom for growth 9
Supportive Regulatory, government steps have improved outlook 9
Why we like Repco Home Finance 11
Unique and Niche business space 11
Stable spreads, driven by business mix and falling Cost of funds 11
Stable asset quality balanced by higher/prudent provisions 12
Concentration in Tamil Nadu is diversifying now 13
Strong underwriting standards – provides comfort on book Quality 14
Lowering cost of borrowing – falling G-sec spreads, high capitalization provide for margin
15
lever in long term
Financials in charts 16
Outlook and Valuation 19
One-year forward P/BV (x) band 20
Peer valuation 20
About the Company 21
Investment theme 21
3R Philosophy definitions 22
January 11, 2021 4Stock Idea
Powered by the Sharekhan
3R Research Philosophy
Why we like the Financials (NBFC) sector:
The recovery in the NBFC sector in the past six months has been encouraging, with lower funding costs,
improving traction in sales etc. Asset quality trends, too, have improved, driven by high collections
efficiency and management’s assessment of a narrow pipeline for asset restructuring. As the industry
focuses more on collections, we expect loan growth likely to pickup from Q4 FY2021 or early Q1 FY2022.
be in mid-single digits. Most HFCs commentary indicate that they do not foresee a major asset quality
stress in the Retail Lending segment. The Non-Retail segment however, remains a key monitorable.
Funding environment has improved, especially for financially strong entities:
Policy stimulus has resulted in interest rates falling to multi year lows globally, and even in India, due to
supportive liquidity stance and the increasing risk perception has led the Indian NBFCs (especially the
higher rated ones) to have more comfortable and benign interest rate environment with wide spread credit
availability. We believe this will facilitate not only refinancing of existing book, but also healthy growth for
companies with strong balance sheets.
Bond Market rates coming down - AAA borrowings costs
AAA borrowing spreads for NBFCs
10.00
9.00
8.00
7.00
6.00
5.00
4.00
3.00
2.00
1.00
-
Pre-IL&FS IL&FS peak 3QFY20 COVID19 peak Current
1Yr 3Yr 5Yr
Source: Bloomberg, Sharekhan Research
Borrowing costs coming down - AA borrowings costs
AA borrowing costs
3.50
3.00
2.50
2.00
1.50
1.00
0.50
-
Pre-IL&FS IL&FS peak 3QFY20 COVID19 peak Current
1Yr 3Yr 5Yr
Source: Bloomberg, Sharekhan Research
January 11, 2021 5Stock Idea
Powered by the Sharekhan
3R Research Philosophy
Since May 2020, the AAA NBFC 1-yr spread has declined by ~180 bps to 77 bps and AA NBFC 1 -year spread
has fallen by 145 bps to 196 bps, which has led to a re-rating of the sector.
Resources profile of HFCs
HFCs predominantly rely on debentures and bank
1.6
4.8 2.6 3.5
borrowings for funds, constituting around 66 % of 4.4 4.3
total resources. The dependence of HFCs on bank 17.4 17.3 15.7
borrowings grew significantly in 2019-20, reflecting 9.8 9.4 10.4
rising reliance on long term-resources amidst risk 23.6 27.9 31.3
averse market conditions. With the decline in Market
borrowing rates, as well as the reducing MCLR based
lending rates by banks, HFCs are placed today with 42.8 38.3 34.9
a scenario of decreasing Cost of Funds which not
only provides them with competitive strength, but
FY2018 FY2019 FY2020
also provides margin cushion. Debentures Banks Public Deposits
Others NHB Foreign Borrowings
Source: RBI, Sharekhan Research.
Largely stable Asset quality of HFCs, collections efficiency healthy
Prima facie, on an overall industry basis, the GNPA and NNPA ratios had increased slightly in 2018-19 but they
registered a sharp leap in 2019-20 on account of marked decline in net profit and provisioning. However, this
was mainly on account of 2 major HFCs which had seen troubles and had skewed the picture for the entire
set.
NPA Ratio of HFCs (Overall) NPA ratios of HFCs (excluding two players) was stable
1.4 1.4
6.7 1.3
1.1 1.1
0.8 0.8
4.6
0.6
0.5 0.5
1.3 1.4
1.1 1.1
0.6 0.8
0.5 0.5
2016 2017 2018 2019 2020 2016 2017 2018 2019 2020
GNPA % NNPA % GNPA % NNPA %
Source: RBI Source: RBI
Two major HFCs registered a spurt in its GNPA and NNPA ratios in 2019-20. Without considering the
aforementioned 2 HFCs the overall asset quality performance was stable. The GNPA and NNPA ratios stood
at 1.4 % and 0.8 %, respectively in 2019-20.
Collection Efficiency of NBFCs
97%
96%
95%
94%
93%
92%
91%
Repco LICHF HDFC PNBHFC CANFINH
Source: Company, Sharekhan Research
January 11, 2021 6Stock Idea
Powered by the Sharekhan
3R Research Philosophy
Indian home mortgage sector has long-term tailwinds
The Indian housing loan industry has long-term structural tailwinds to support its growth. Housing has become
increasingly affordable over the years due to rising per capita incomes, as well as increasing affordability
due to low interest rates. Moreover, easy availability of mortgage products and a young demography are
growth drivers.
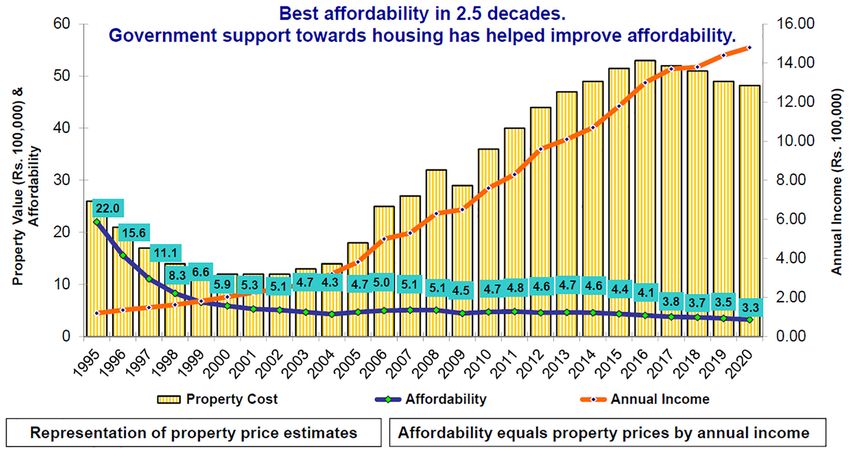
Improved affordability – Falling property costs versus rising incomes
Source: Company
In the past few years, property prices in India have generally not gone up, which we believe will in turn fuel
demand for home loans. Income levels have risen and, therefore, the cost of a house as a multiple of annual
income of a customer has declined, making homes more affordable.
Housing demand in India is backed by structural, demographic factors
Housing demand is quite robust largely due to the Growing urbanisation in India
growing population (Growth at about 1% per annum) Urbanisation in India
in India, which is complimented by acute housing
shortage of 40 million houses (both urban and rural), 31.2
27.8
favourable demographics, rise in concept of nuclear 25.7
23.3
families, greater migration to urban areas, fiscal
benefits, rising income aspirations could lead to a 18 18.2
further demand for another 8-10 million houses.
By 2050, `900 million people are estimated will be
added to Indian cities. The rapid pace of urbanisation
owing to the rural–urban migration is behind a massive
1960-61 1970-71 1980-81 1990-91 2000-01 2010-11
urban housing shortage plaguing the country. The
Source: Census data, Sharekhan Research
shortage, prominent within the EWS (economically
weaker sections) and LIG (lower income groups), was
estimated at 18.78 million households in 2012.
January 11, 2021 7Stock Idea
Powered by the Sharekhan
3R Research Philosophy
Demand drivers in place
Urbanisation:
Nuclear Households: Currently 32% of the
Rise in the number of Indian population live
nuclear families in cities; estimated to
be 50% by 2030
Favourable Interest Rates:
Demographics: 66% of Improved affordability
India’s population is via rising disposableStock Idea
Powered by the Sharekhan
3R Research Philosophy
Underpenetrated market in Indian housing mortgage – Provides headroom for growth
Looking at the Indian housing mortgage market, while a lot of growth and penetration has happened in the
recent past, comparing the economy with international markets is indicative of the headroom available for
growth.
Mortgages as a percent of naminal GDP
100%
88%
90%
80%
70% 67%
60% 56%
52%
50% 45%
38% 40%
40% 34%
31%
30%
18% 20%
20%
10%
10%
0%
Taiwan
Thailand
UK
Malyasia
Denmark
Germany
USA
India
Singapore
Korea
China
Hongkong
Source: Company
Going by the mortgage to GDP ratio metric, India’s sub-10% indicates that the Indian mortgage market has
low penetration relative to global peers and offers significant and attractive growth prospects going forward.
Notwithstanding that growth in population may be decelerating, rapid urbanisation in the country also reflects
favourable prospects for the sector. About 67% of our country’s population comprises persons who are in the
mid-thirties age group and given that house purchase decisions are made roughly during this stage of human
life-cycle presents a large opportunity for the sector.
Supportive Regulatory, government steps have improved outlook
A window of Rs 50,000 crore under targeted long-term repo operations (TLTRO) will enable NBFCs to lend to
micro segments of each sector in the economy. Reduction in reverse repo rates by 90 bps in March 2020 and
further 25 bps in April 2020 to 3.75% is another big step, as it will encourage banks and NBFCs to increase
lending and investment. Further, a special liquidity scheme of up to Rs 30,000 crore has been announced for
NBFCs, housing financiers and micro-financiers.
Going forward, the government’s strong focus on infrastructure and construction sectors will be an important
driving force for commercial vehicles in India.
January 11, 2021 9Stock Idea
Powered by the Sharekhan
3R Research Philosophy
Improved affordability – Falling property costs versus rising incomes
A window of Rs
50,000 crore under
targeted long-term
repo operations
(TLTRO).
Going forward, the
Reduction in reverse
government’s strong
focus on repo rates by RBI will
Advantag encourage banks and
infrastructure and
e NBFCs NBFCs to increase
construction sectors
will be an important lending and
investment.
driving force
A special liquidity
scheme of up to Rs
30,000 crore has
been announced for
NBFCs, housing
financiers and micro
financiers
Source: Sharekhan Research
January 11, 2021 10Stock Idea
Powered by the Sharekhan
3R Research Philosophy
Why we like Repco Home Finance
Repco Home Finance Limited (RHFL) has an attractive business model of housing mortgages which
caters to an under-served segment by banks and other NBFCs. The small-ticket, non salaried segment
is an attractive but a challenging business that requires a player with diligent risk management, deep
understanding of the market and focus, which is why there is lesser competitive intensity. Hence, despite
the segment comparatively offering higher yields, banks and large HFCs have found it difficult to penetrate
in this space. This is because a lower ticket size and close level of servicing required for the segment. Over
the last three years, Repco has endeavoured to lower exposure to non-housing loans (LAP) and to bring a
balance between salaried and non-salaried loans that has helped keep its balance sheet quality robust.
Strong underwriting practices have seen controlled credit costs, which we expect to continue.
Unique and niche business space
RHFL has an attractive business model of housing mortgages which caters to an under-served segment by
banks and other NBFCs. The small-ticket, non salaried segment is an attractive but very challenging business
that requires a player with diligent risk management, deep understanding of the market and focus. RHFL
operates with two products – individual home loans and loans against property (LAP). The company extends
all of its loans to retail clients.
Loan book break-up
RHFL due to its focus on underpenetrated small
ticket non-salaried segment (51% of book) in tier-2
and -3 cities has helped Repco sustain higher yields
54.1 51.6
as compared to peers. Going forward, as the book 60.2 57.1
expands, and also due to management’s strategic
vision of having a more balanced mix, is likely to
result in an even mix.
42.9 45.9 48.4
However, for RHFL, the salaried segment is not 39.8
exactly the ‘ubiquitous’ salaried segment (as is the
target with banks, etc). Most salaried class borrowers FY17 FY18 FY19 FY20
have a mix of income sources, apart from the usual Salaried Non Salaried
salary income. Around 50% of their income may be Source: Company, Sharekhan Research
from salary (not high ranking job profile), which is
augmented by a source of second income as well (ex. do tuition, do mechanic job etc) which makes them
more unique and which are therefore below radar of competition from most banks, etc.
Stable spreads, driven by business mix and falling cost of funds
Hence, despite it being a comparatively higher
Stable NIMs and spreads across cycles
yield segment, banks and large HFCs have found it
5.0
difficult to penetrate because of the lower ticket size
and close level of servicing required. 4.5
Self-occupied residential real estate is an attractive 4.0
segment because immovable collateral is considered 3.5
relatively safe. While NBFC-HFCs do have presence
3.0
in the smaller ticket size housing loan to below-
the-radar segment, we believe that experience and 2.5
knowledge are key differentiators for HFCs and
2.0
difficult to be challenged by banks. This explains FY17 FY18 FY19 FY20 FY21 FY22 FY23
RHFL being able to maintain NIMs of 4-4.7% since Net interest margin (%) Spreads (%)
last 5 years despite interest rate cycles and fierce Source: Company, Sharekhan Research
competition for home loan markets.
January 11, 2021 11Stock Idea
Powered by the Sharekhan
3R Research Philosophy
We believe that a moderation in funding costs could cushion the impact on spreads from a business mix
perspective. We expect spreads to be at around 3% in FY2021E-FY2023E with NIMs at 4.5-4.6% for the same
period.
Stable asset quality balanced by higher/prudent provisions:
RHFL saw rise in Stage-3 (NPAs) assets, which were higher than its earlier run-rate. However, mitigating
factors are provisioning has also been higher and conservative.
4.5% 4.3% 4.3%
4.2% 4.2%
4.0% 4.0%
3.9%
4.0%
3.6%
3.5%
3.0%
3.0%
2.5%
2.0%
Jul-19
Jul-20
Sep-18
Sep-19
Sep-20
Jan-19
Jan-20
May-19
May-20
Nov-18
Nov-19
Mar-19
Mar-20
Stage 3(%)
Source: Company
The company has adequate cushion in provisions as seen from the historically observed loss given default
(LGD) and hence has comfortable asset coverage.
Conservative provisions on Stage-3 assets (as of FY2020)
NPA
NPA/Stage 3 Average Provision Provision
amount
ageing LTV (Rs Crs) cover
(Rs Crs)
Less than 1 year 46% 238 60 25%
1-2 years 49% 110 31 28%
2-3 years 49% 86 30 35%
Beyond 3 years 49% 76 62 82%
Grand Total 47% 512 183 36%
Source: Company
While near-term asset quality may be volatile mainly as a result of the impact of migration of performing
assets to banks & other HFCs on account of takeovers that may impact overall asset quality. However, with
pickup in disbursements and seen on a yearly basis, we believe that asset quality trends will smoothen out.
January 11, 2021 12Stock Idea Powered by the Sharekhan 3R Research Philosophy Concentration in Tamil Nadu is diversifying now South India accounts for 89% of RHFL’s loan book. Tamil Nadu represents almost 62% of its loan book. Presence outside South is mainly in West Bengal, Odisha, Maharashtra, Gujarat, Madhya Pradesh and Jharkhand. Source: Company January 11, 2021 13
Stock Idea
Powered by the Sharekhan
 3R Research Philosophy

As of now, the company has 179 points of presence,                           Geographical loan book spread
comprising 153 business branches, two asset                                                                  3.3%
recovery branches and 24 satellite centers; presence                                                  6.0%
                                                                                               4.6%
in 12 states and a union territory; greater focus on
direct sourcing. The retail network is now spread                                            3.7%
across states of Tamil Nadu, Karnataka, Andhra
                                                                                           14.1%
Pradesh, Telangana, Kerala, Maharashtra, Odisha,
West Bengal, Gujarat, Madhya Pradesh, Jharkhand,                                                                                               55.7%
                                                                                               3.3%
Rajasthan and the Union Territory of Puducherry.
                                                                                                       9.3%

                                                                                    Tamil Nadu           Maharshatra           Kerala         Karnataka
                                                                                    Gujarat              Telengana             Andhra Pradesh Others

                                                                             Source: Company, Sharekhan Research

Repco has been diversifying its footprint to non-southern states. From ~61% of business coming from Tamil
Nadu, it has now reduced its exposure to Tamil Nadu to ~56%.

                       Diversifying exposure
                                                                Exposure
                       States                                                                YoY Growth             QoQ Growth
                                                   Sep-19         June-20      Sep-20
                       Andhra Pradesh                6.4%             6.1%       6.0%                   -2%                -3.00%
                       Telangana                     4.6%            4.6%        4.6%                    5%                 3.00%
                       Gujrat                        3.4%            3.6%        3.7%                   14%                10.00%
                       Karnataka                    14.0%            14.1%       14.1%                   6%                 2.00%
                       Kerala                        3.5%            3.3%        3.3%                    -1%                0.00%
                       Maharashtra                   8.7%            9.2%        9.3%                   13%                 8.00%
                       Tamil Nadu                   56.2%           55.9%       55.7%                    4%                 2.00%
                       Others                        3.2%            3.2%        3.3%                    7%                16.00%
                                                   100.0%          100.0%      100.0%                  5.0%                   3.0%
                       Source: Company, Sharekhan Research

Also, the focus on tier-II and tier-III cities and peripheral areas of tier-I cities results in lesser competition from
banks and other HFCs, leading to a possibility of high growth in advances.

Strong underwriting standards – provides comfort on book Quality

RHFL, has over the years, gained significant insights in underwriting risks involved in lending to non-salaried
class, which is highly underpenetrated, relatively less competitive and offers higher yields.

Asset quality over the years                                                 Segment wise NPA mix – trending for improvement
 5.00
                                                                                                                                               6.8%
 4.50                                                                                                                  6.4%
                                                                                        6.2%
 4.00
 3.50
 3.00                                                                                          4.0%                           4.0%                    4.2%
 2.50                                                                            3.4%                          3.5%                     3.6%
 2.00
 1.50
 1.00
 0.50
   -
           FY17            FY18         FY19             FY20                           Sep'20                        June'20                Sep'19
                    Gross NPA (%)          Net NPA (%)                                       Housing Loan                   LAP             Overall
Source: Company, Sharekhan Research                                          Source: Company, Sharekhan Research

January 11, 2021                                                                                                                                             14
Stock Idea
Powered by the Sharekhan
3R Research Philosophy
Occupation wise NPA mix – trending for improvement
7.0%
6.0%
5.0%
4.0%
3.0%
2.0%
1.0%
0.0%
Sep'20 June'20 Sep'19
Salaried Non-Salaried Overall
Source: Company, Sharekhan Research
Lowering borrowing cost – falling G-sec spreads, high capitalization provide for margin lever in long term
Borrowing Profile
100% 0% 0%
3%
7%
90%
80%
70%
60% 72%
75%
50%
40%
30%
20% 10%
8%
10% 15%
10%
0%
Sep'19 Sep'20
NHB Repco Bank Commercial Banks NCDs CPs
Source: Company, Sharekhan Research
Bank funding is the key funding source for RHFL. With a fall in cost of funds and the reduction of MCLR rates
for the banking space, cost of Funds for the HFC has also been improving.
Weighted average borrowing costs movement
10.00%
9.00% 8.59% 8.58% 8.52% 8.53% 8.52% 8.46% 8.37% 8.41% 8.40% 8.23% 8.13% 8.05%
8.00% 7.68%
7.00%
6.00%
5.00%
8.68% 8.78% 8.74% 8.44% 8.37% 8.48% 8.23%
4.00% 8.22% 8.19% 7.87%
7.32%
3.00% 6.37% 6.61%
2.00%
1.00%
0.00%
Sep-19 Oct-19 Nov-19 Dec-19 Jan-20 Feb-20 Mar-20 Apr-20 May-20 Jun-20 Jul-20 Aug-20 Sep-20
Weighted Average Borrowing Cost Incremental Borrowing cost for the Month
Source: Company, Sharekhan Research
While the average weighted cost of funds coming down, yield of new incremental disbursement yields is also
improving, due to repricing. Hence we believe that the outlook on NIMs is likely to be stable with a positive
bias.
January 11, 2021 15Stock Idea
Powered by the Sharekhan
3R Research Philosophy
Financials in charts
Network expansion Region wise Loan Book
177 177 3.3%
170 6.0%
156 160
150 4.6%
142
122 3.7%
88 92
14.1%
55.7%
3.3%
9.3%
Mar-12 Mar-13 Mar-14 Mar-15 Mar-16 Mar-17 Mar-18 Mar-19 Mar-20 Sep-20 Tamil Nadu Maharshatra Kerala Karnataka
Branches Gujarat Telengana Andhra Pradesh Others
Source: Company, Sharekhan Research Source: Company, Sharekhan Research
Loan Book composition Borrowing profile
100% 0% 0%
3%
7%
90%
80%
57.1 54.1 51.6
60.2 70%
60% 72%
75%
50%
40%
48.4 30%
39.8 42.9 45.9
20% 10%
8%
10% 15%
10%
0%
FY17 FY18 FY19 FY20 Sep'19 Sep'20
Salaried Non Salaried NHB Repco Bank Commercial Banks NCDs CPs
Source: Company, Sharekhan Research Source: Company, Sharekhan Research
NIMs and Spreads Return on Equity, Return on Assets
5.0 20 2.6
19 2.5
4.5
18
2.4
4.0
17
2.3
3.5 16
2.2
15
3.0
2.1
14
2.5 2
13
2.0 12 1.9
FY17 FY18 FY19 FY20 FY21 FY22 FY23 FY15 FY16 FY17 FY18 FY19 FY20
Net interest margin (%) Spreads (%) RoE RoA
Source: Company, Sharekhan Research Source: Company, Sharekhan Research
January 11, 2021 16Stock Idea Powered by the Sharekhan 3R Research Philosophy REPCO HOME FINANCE LTD Rs cr P&L Account FY18 FY19 FY20 FY21E FY22E FY23E Revenue from operations - Interest income 1,085.1 1,163.4 1,317.4 1,377.5 1,475.2 1,638.2 Other loan related income 22.1 25.9 28.1 30.3 33.4 37.4 Total revenue from operations 1,107.2 1,189.3 1,345.5 1,407.9 1,508.6 1,675.5 Other income 2.9 5.9 5.6 6.1 6.7 7.5 Total income 1,110.1 1,195.2 1,351.1 1,413.9 1,515.3 1,683.1 Net Interest Income 458.3 469.3 520.5 565.8 592.1 658.3 Finance costs 648.9 720.0 825.0 842.0 916.5 1,017.3 Employee benefits expenses 49.5 58.5 66.4 71.1 75.8 80.5 Depreciation, amortisation and impairment 3.1 5.0 12.9 13.8 14.8 15.7 Others expenses 26.4 34.9 27.1 29.9 32.9 36.9 Pre Provision Operating Profits 382.2 376.8 419.6 457.1 475.3 532.8 Provisions and write-offs 74.8 17.0 59.4 95.8 56.2 55.1 Profit before tax 307.4 359.8 360.2 361.3 419.1 477.7 Tax expense: 106.4 125.2 79.8 80.1 92.9 105.9 Profit for the year 201.0 234.6 280.4 281.2 326.2 371.8 Source: Company; Sharekhan Research Balance Sheet FY18 FY19 FY20 FY21E FY22E FY23E Assets Financial Assets Cash and cash equivalents 25.8 57.5 324.3 149.5 137.6 105.0 Bank balances other than cash and cash 0.1 0.1 0.0 0.0 0.0 0.0 equivalents Loans 9,649.2 10,837.9 11,587.7 12,772.2 14,049.4 15,635.0 Other financial assets 8.3 9.6 10.1 11.1 12.1 13.1 Investment in associate 15.6 22.0 22.0 22.0 22.0 22.0 Non-financial Assets Property, plant and equipment 12.3 13.6 14.2 15.2 16.2 17.2 Other intangible assets 1.2 1.9 2.3 3.3 4.3 5.3 Right-of-use (ROU) assets - - 20.7 20.7 20.7 20.7 Other non-financial assets 18.4 14.3 12.6 12.6 12.6 12.6 Total Assets 10,957.0 10,957.0 11,993.9 12,880.6 14,139.8 15,830.9 Liabilities and equity Financial Liabilities Debt securities 2,134.3 876.0 680.2 340.1 170.1 85.0 Borrowings (other than debt securities) 6,000.0 8,472.7 9,428.8 10,600.9 11,801.5 13,178.0 Other financial liabilities 247.4 16.9 46.3 23.1 11.6 5.8 Non-financial Liabilities Current Tax Liablity (Net) - - - - - Provisions 12.8 12.0 15.9 19.1 22.9 27.5 Deferred tax liabilities (net) 28.0 52.0 35.8 39.4 43.4 47.7 Total liabilities 8,422.5 9,429.6 10,207.1 11,022.7 12,049.4 13,344.0 Equity Equity share capital 62.6 62.6 62.6 62.6 62.6 62.6 Other equity 1,245.9 1,464.8 1,724.3 1,921.4 2,162.9 2,424.3 Total equity 1,308.5 1,527.4 1,786.9 1,983.9 2,225.5 2,486.9 Total liabilities and equity 9,731.0 10,957.0 11,993.9 13,006.6 14,274.9 15,830.9 Source: Company; Sharekhan Research January 11, 2021 17
Stock Idea
Powered by the Sharekhan
 3R Research Philosophy

Valuation                   FY18     FY19      FY20      FY21E     FY22E      FY23E
Net Interest Income        458.3     469.3     520.5     565.8       592.1     658.3
PPOP                       382.2     376.8      419.6     457.1     475.3      532.8
PAT                        201.0     234.6     280.4      281.2     326.2       371.8
EPS (Rs)                     32.1      37.5      44.8      44.9       52.1       59.4
BVPS (Rs)                  209.2      244.1    285.6       317.1    355.7      397.5
Adj BVPS (Rs)               189.1    210.9      233.1    266.3      291.5      322.3
P / EPS (x)                   7.8      6.72     5.62       5.61       4.83       4.24
P / BVPS (x)                  1.2      1.03     0.88       0.79        0.71      0.63
P / ABVPS (x)                 1.3       1.19     1.08      0.95      0.86        0.78
ROA (%)                       2.1       2.2        2.5      2.2         2.3       2.4
ROE (%)                      17.5      15.4       15.7     14.2        14.7      15.0

Per Share Ratios             FY19    FY19      FY20      FY21E     FY22E      FY23E
EPS (Rs)                     32.13    37.5      44.8      44.9        52.1      59.4
BVPS (Rs)                  209.15    244.1     285.6       317.1    355.7      397.5
Adj BVPS (Rs)              189.09    210.9      233.1    266.3      291.5      322.3
P / EPS (x)                   7.84     6.7        5.6       5.6        4.8       4.2
P / BVPS (x)                  1.20    1.03      0.88       0.79       0.71      0.63
P / ABVPS (x)                 1.33     1.19      1.08     0.95       0.86       0.78

January 11, 2021                                                                   18
Stock Idea
Powered by the Sharekhan
 3R Research Philosophy

Outlook and Valuation
n Sector view - Outlook improves for NBFCs
Long-term structural indicators remain strong for housing and mortgages in India. Ruling interest rates are low
and several states have given incentive for home-buying, which is likely to prop up demand. With the recent
fall in borrowing costs, which was steep for high-rated NBFCs, is another positive in its favour. Moreover, rising
affordability and softening pricing (helped by tax incentives) are positive for demand offtake and loan-to-
value (LTV) outlook for HFCs. India has a young population and government schemes such as credit-linked
subsidy scheme (CLSS) etc, which will facilitate even the affordable housing segments, are also enablers
along with low penetration levels of mortgages in India (at 10% of GDP, against 18% in China and 56% in the
US). We believe that the economic recovery is also gaining momentum and stimulus/supportive measures by
the government and the Reserve Bank of India (RBI) will further aid to the same. We believe the outlook has
turned positive on the NBFC sector in general and HFCs in particular.
n Company outlook - Strong fundamentals, with improving growth outlook, resilient margins
RHFL is well-placed in terms of liquidity management and falling interest would certainly augur well for
the company in the coming quarters. During the quarter, RHFL witnessed improved loan disbursement and
stable NIM, indicating a recovering traction post the lockdown and slower economic activity due to COVID-19
pandemic. RHFL has comfortable access to liquidity and enjoys stable credit ratings, which due to its high
capitalisation and improving asset quality outlook have a potential to improve. Even though competitive
intensity is present in the home loan segment, we believe that the niche segment in which RHFL operates,
there is ample growth opportunity, lower competitive intensity and hence stable margin prospects. We expect
margin outlook to be stable (with a positive bias) due to its declining cost of funds and improving disbursement
traction. We believe asset-quality outlook and well-managed costs of borrowings are positives in its favour.
n Valuation - Initiate coverage with a Buy and price target of Rs. 330.
Repco Home Finance is available at 0.9x/0.8x FY22E / FY23E which we believe is reasonable considering
the healthy return ratios (ROE at over 14%; ROA at over 2.3%). Repco has focused on niche, small-ticket,
non- salaried home loans, resulting in higher spreads for the company, along with reasonably controlled
Asset quality. Going forward, we believe margins to sustain as disbursement growth picks up spreads could
moderate given competition and pressure on yields. We expect EPS growth to clock a ~10% CAGR over
FY20-23E, with stable asset quality. The stock has corrected by ~72% from highs and valuation multiples too
have fallen to 0.9x forward ABVPS from 2.5x earlier. Hence, we believe that the risk-reward is favourable for
long-term investors. A strong business model, stable ratings and strong historical underwriting, with attractive
return ratios make RHFL among the attractive players in the niche Housing financing space, and we believe
that with economic recovery demand along with resilient rural economy brighten the growth outlook. We
initiate coverage on the stock with a Buy Rating and price target of Rs. 330.

January 11, 2021                                                                                                19
Stock Idea
Powered by the Sharekhan
 3R Research Philosophy

One-year forward P/BV (x) band
 5.0

 4.0

 3.0

 2.0

 1.0

  -
                                            Jul-19

                                                       Aug-19

                                                                                                                                                                 Jul-20

                                                                                                                                                                          Aug-20
                                                                         Oct-19

                                                                                                                                                                                               Oct-20
                 Apr-19

                          May-19

                                                                                   Nov-19

                                                                                                                                    Apr-20

                                                                                                                                              May-20

                                                                                                                                                                                                        Nov-20
                                                                Sep-19

                                                                                                                 Feb-20

                                                                                                                                                                                     Sep-20
                                                                                                        Jan-20

                                                                                                                                                                                                                            Jan-21
        Mar-19

                                                                                                                          Mar-20
                                   Jun-19

                                                                                              Dec-19

                                                                                                                                                        Jun-20

                                                                                                                                                                                                                   Dec-20
                                            PBV                                             3-yr Avg                                          +1 sd                                           -1 sd

Source: Sharekhan Research

Peer valuation
                              CMP                          P/BV(x)                                          P/E(x)                                      RoA (%)                                         RoE (%)
Particulars                     Rs/
                                            FY21E FY22E FY23E                                FY21E FY22E FY23E                               FY21E FY22E FY23E                            FY21E FY22E FY23E
                              Share
Repco Home                    252.0                  0.9          0.9             0.8             5.5             4.7              4.2          2.2              2.3           2.4            14.4               15.0         15.0
Finance
HDFC Ltd                       2653                  4.6          4.3             4.0           44.0             38.1         33.3                1.9            2.0               2.1         11.7              12.3        12.9
LICHF                          409.4                 1.0          0.9             0.8            8.7              7.2           6.1               1.0            1.2               1.3        12.2               13.3        13.9
PNBHF                          361.5                 0.7          0.7             0.6             8.1            6.8           5.8                1.0            1.2               1.3         8.9               10.4        11.14
Source: Company, Sharekhan research

January 11, 2021                                                                                                                                                                                                                 20
Stock Idea
Powered by the Sharekhan
3R Research Philosophy
About company
Repco Home Finance (RHFL), is promoted by Repco Bank (holds 37.13% stake), is a housing finance company (HFC)
with strong concentration in south India, especially Tamil Nadu incorporated in April 2000. As at the end of Sep
2020, RHFL is operating through 153 branches and 24 satellite centres in Tamil Nadu, Andhra Pradesh, Jharkhand,
Kerala, Karnataka, Maharashtra, Madhya Pradesh, Gujarat, Odisha, West Bengal and Puducherry. The NBFC
operates in Housing Finance with innovative loan products, direct customer contact and customer ownership,
focus on quality customer servicing, transparency and speed of operations, focus on relatively under-penetrated
markets and balanced portfolio mix, robust risk management systems and processes, low cost operations, well
recognized brand in south India with an established track record, stable and experienced senior management
team. The Company’s products have been developed to suit the needs of different customers.
Investment theme
Repco Home Finance (RHFL) is an attractive HFC with a niche loan book (salaried, non-salaried) with stable asset
quality, stable Ratings and attractive return ratios. The HFC is backed by strong capitalization, and despite the
competitive intensity in the home loan segment, due to its presence in niche small ticket, non-salaried Housing
loan segment Repco has attractive spreads as compared to peers. Repco Home Finance (RHFL) has an attractive
business model of housing mortgages which caters to an under-served segment by banks and other NBFCs. The
small ticket, non-salaried segment is an attractive but very challenging business that requires a player with diligent
risk management, deep understanding of the market and focus. The company has witnessed a steady growth and
is increasing its geographical footprint by deepening its reach selectively in existing regions and expanding to
new regions, with continuing focus on under penetrated markets, focus on risk management, accessing low cost
and diversified sources of funds, and maintaining low operating costs. The company has a sound risk management
system in place.
Key Risks
Delayed recovery in economic activity and an adverse interest rate regimen will affect growth and profitability.
Stress of migration of performing assets to banks & other HFCs on account of takeovers may impact overall
asset quality.
Additional Data
Key management personnel
Mr Yaspal Gupta MD & CEO
Mr T Karunkaran CFO
Mr K Pandiarajan CTO
Mr Arun Mishra Chief Devlopment Officer
Mr Shanthi Srikanth Chief Risk Officer
Source: Company Website
Top 10 shareholders
Sr. No. Holder Name Holding (%)
1 India Capital Fund Ltd 7.4
2 Aditya Birla Sun Life Asset Management Co Ltd 6.5
3 Aditya Birla Sun Life Trustee Co Ltd 6.1
4 HDFC Company Ltd 6.1
5 HDFC Asset Management Co ltd 6.1
6 DSP Investment Managers Pvt Ltd 4.4
7 Fidelity Funds SICAV 2.9
8 FIL Ltd 2.8
9 ICICI Prudential Asset Management Co Ltd 2.4
10 APAX Global ALOHA Ltd 2.1
Source: Bloomberg
Sharekhan Limited, its analyst or dependant(s) of the analyst might be holding or having a position in the companies mentioned in the article.
January 11, 2021 21Stock Idea
Powered by the Sharekhan
3R Research Philosophy
Understanding the Sharekhan 3R Matrix
Right Sector
Positive Strong industry fundamentals (favorable demand-supply scenario, consistent
industry growth), increasing investments, higher entry barrier, and favorable
government policies
Neutral Stagnancy in the industry growth due to macro factors and lower incremental
investments by Government/private companies
Negative Unable to recover from low in the stable economic environment, adverse
government policies affecting the business fundamentals and global challenges
(currency headwinds and unfavorable policies implemented by global industrial
institutions) and any significant increase in commodity prices affecting profitability.
Right Quality
Positive Sector leader, Strong management bandwidth, Strong financial track-record,
Healthy Balance sheet/cash flows, differentiated product/service portfolio and
Good corporate governance.
Neutral Macro slowdown affecting near term growth profile, Untoward events such as
natural calamities resulting in near term uncertainty, Company specific events
such as factory shutdown, lack of positive triggers/events in near term, raw
material price movement turning unfavourable
Negative Weakening growth trend led by led by external/internal factors, reshuffling of
key management personal, questionable corporate governance, high commodity
prices/weak realisation environment resulting in margin pressure and detoriating
balance sheet
Right Valuation
Positive Strong earnings growth expectation and improving return ratios but valuations
are trading at discount to industry leaders/historical average multiples, Expansion
in valuation multiple due to expected outperformance amongst its peers and
Industry up-cycle with conducive business environment.
Neutral Trading at par to historical valuations and having limited scope of expansion in
valuation multiples.
Negative Trading at premium valuations but earnings outlook are weak; Emergence of
roadblocks such as corporate governance issue, adverse government policies
and bleak global macro environment etc warranting for lower than historical
valuation multiple.
Source: Sharekhan Research
January 11, 2021 22Know more about our products and services
For Private Circulation only
Disclaimer: This document has been prepared by Sharekhan Ltd. (SHAREKHAN) and is intended for use only by the person or entity
to which it is addressed to. This Document may contain confidential and/or privileged material and is not for any type of circulation
and any review, retransmission, or any other use is strictly prohibited. This Document is subject to changes without prior notice.
This document does not constitute an offer to sell or solicitation for the purchase or sale of any financial instrument or as an official
confirmation of any transaction. Though disseminated to all customers who are due to receive the same, not all customers may
receive this report at the same time. SHAREKHAN will not treat recipients as customers by virtue of their receiving this report.
The information contained herein is obtained from publicly available data or other sources believed to be reliable and SHAREKHAN
has not independently verified the accuracy and completeness of the said data and hence it should not be relied upon as such. While
we would endeavour to update the information herein on reasonable basis, SHAREKHAN, its subsidiaries and associated companies,
their directors and employees (“SHAREKHAN and affiliates”) are under no obligation to update or keep the information current. Also,
there may be regulatory, compliance, or other reasons that may prevent SHAREKHAN and affiliates from doing so. This document is
prepared for assistance only and is not intended to be and must not alone be taken as the basis for an investment decision. Recipients
of this report should also be aware that past performance is not necessarily a guide to future performance and value of investments
can go down as well. The user assumes the entire risk of any use made of this information. Each recipient of this document should
make such investigations as it deems necessary to arrive at an independent evaluation of an investment in the securities of companies
referred to in this document (including the merits and risks involved), and should consult its own advisors to determine the merits and
risks of such an investment. The investment discussed or views expressed may not be suitable for all investors. We do not undertake to
advise you as to any change of our views. Affiliates of Sharekhan may have issued other reports that are inconsistent with and reach
different conclusions from the information presented in this report.
This report is not directed or intended for distribution to, or use by, any person or entity who is a citizen or resident of or located in any
locality, state, country or other jurisdiction, where such distribution, publication, availability or use would be contrary to law, regulation
or which would subject SHAREKHAN and affiliates to any registration or licensing requirement within such jurisdiction. The securities
described herein may or may not be eligible for sale in all jurisdictions or to certain category of investors. Persons in whose possession
this document may come are required to inform themselves of and to observe such restriction.
The analyst certifies that the analyst has not dealt or traded directly or indirectly in securities of the company and that all of the
views expressed in this document accurately reflect his or her personal views about the subject company or companies and its or
their securities and do not necessarily reflect those of SHAREKHAN. The analyst further certifies that neither he or its associates
or his relatives has any direct or indirect financial interest nor have actual or beneficial ownership of 1% or more in the securities of
the company at the end of the month immediately preceding the date of publication of the research report nor have any material
conflict of interest nor has served as officer, director or employee or engaged in market making activity of the company. Further, the
analyst has also not been a part of the team which has managed or co-managed the public offerings of the company and no part
of the analyst’s compensation was, is or will be, directly or indirectly related to specific recommendations or views expressed in this
document. Sharekhan Limited or its associates or analysts have not received any compensation for investment banking, merchant
banking, brokerage services or any compensation or other benefits from the subject company or from third party in the past twelve
months in connection with the research report.
Either SHAREKHAN or its affiliates or its directors or employees / representatives / clients or their relatives may have position(s), make
market, act as principal or engage in transactions of purchase or sell of securities, from time to time or may be materially interested
in any of the securities or related securities referred to in this report and they may have used the information set forth herein before
publication. SHAREKHAN may from time to time solicit from, or perform investment banking, or other services for, any company
mentioned herein. Without limiting any of the foregoing, in no event shall SHAREKHAN, any of its affiliates or any third party involved
in, or related to, computing or compiling the information have any liability for any damages of any kind.
Compliance Officer: Mr. Joby John Meledan; Tel: 022-61150000; email id: compliance@sharekhan.com;
For any queries or grievances kindly email igc@sharekhan.com or contact: myaccount@sharekhan.com
Registered Office: Sharekhan Limited, 10th Floor, Beta Building, Lodha iThink Techno Campus, Off. JVLR, Opp. Kanjurmarg
Railway Station, Kanjurmarg (East), Mumbai – 400042, Maharashtra. Tel: 022 - 61150000. Sharekhan Ltd.: SEBI Regn. Nos.: BSE
/ NSE / MSEI (CASH / F&O / CD) / MCX - Commodity: INZ000171337; DP: NSDL/CDSL-IN-DP-365-2018; PMS: INP000005786;
Mutual Fund: ARN 20669; Research Analyst: INH000006183;
Disclaimer: Client should read the Risk Disclosure Document issued by SEBI & relevant exchanges and the T&C on www.sharekhan.com;
Investment in securities market are subject to market risks, read all the related documents carefully before investing.You can also read