Reactive Transport Simulation of Low-pH Cement Interacting with Opalinus Clay Using a Dual Porosity Electrostatic Model
←
→
Page content transcription
If your browser does not render page correctly, please read the page content below
minerals
Article
Reactive Transport Simulation of Low-pH Cement Interacting
with Opalinus Clay Using a Dual Porosity Electrostatic Model
Andreas Jenni *            and Urs Mäder

                                          Institute of Geological Sciences, University of Bern, CH-3012 Bern, Switzerland; urs.maeder@geo.unibe.ch
                                          * Correspondence: andreas.jenni@geo.unibe.ch; Tel.: +41-31-684-87-65

                                          Abstract: Strong chemical gradients between clay and concrete porewater lead to diffusive transport
                                          across the interface and subsequent mineral reactions in both materials. These reactions may influence
                                          clay properties such as swelling behaviour, permeability or radionuclide retention, which are relevant
                                          for the safety of a radioactive waste repository. Different cement types lead to different interactions
                                          with Opalinus Clay (OPA), which must be understood to choose the most suitable material. The
                                          consideration of anion-depleted porosity due to electrostatic repulsion in clay modelling substantially
                                          influences overall diffusive transport and pore clogging at interfaces. The identical dual porosity
                                          model approach previously used to predict interaction between Portland cement and OPA is now
                                          applied to low-alkali cement—OPA interaction. The predictions are compared with corresponding
                                          samples from the cement-clay interaction (CI) experiment in the Mont Terri underground rock
                                laboratory (Switzerland). Predicted decalcification of the cement at the interface (depletion of C–S–H

                                          and absence of ettringite within 1 mm from the interface), the Mg enrichment in clay and cement
Citation: Jenni, A.; Mäder, U.            close to the interface (neoformation of up to 17 vol% Mg hydroxides in concrete, and up to 6 vol%
Reactive Transport Simulation of
                                          in OPA within 0.6 mm at the interface), and the slightly increased S content in the cement 3–4 mm
Low-pH Cement Interacting with
                                          away from the interface qualitatively match the sample characterisation. Simulations of Portland
Opalinus Clay Using a Dual Porosity
                                          cement—OPA interaction indicate a weaker chemical disturbance over a larger distance compared
Electrostatic Model. Minerals 2021, 11,
                                          with low-pH cement—OPA. In the latter case, local changes in porosity are stronger and lead to
664. https://doi.org/10.3390/
min11070664                               predicted pore clogging.

Academic Editors: Ana                     Keywords: cement—clay interaction; diffusion; dual porosity; electrostatic effects; reactive transport
María Fernández, Stephan Kaufhold,        modelling; near field; radioactive waste repository; low-pH cement
Markus Olin, Lian-Ge Zheng,
Paul Wersin and James Wilson

Received: 27 April 2021                   1. Introduction
Accepted: 18 June 2021
                                                Deep geological repository designs include cementitious materials for structural
Published: 22 June 2021
                                          elements, backfill or waste matrix. While mineralogy in Opalinus Clay (OPA) has proven
                                          stability for the last 170 million years, cementitious minerals are subject to deterioration;
Publisher’s Note: MDPI stays neutral
                                          hence, concrete infrastructure has a typical service life between 50 and 100 years.
with regard to jurisdictional claims in
                                                Chemical gradients between porewaters of cement and contrasting materials cause
published maps and institutional affil-
                                          diffusive fluxes of dissolved species. In case of cement—clay interfaces, this may lead to
iations.
                                          mineralogical alterations, which in turn are expected to locally influence important barrier
                                          properties like permeability, swelling pressure or specific retention.
                                                Experimental literature documents chemical and mineralogical changes at clay—
                                          cement interfaces [1–10]. Local decalcification (instability of portlandite, calcium silicate
Copyright: © 2021 by the authors.
                                          hydrate (C–S–H), and ettringite) is the main alteration of the cement. The resulting Ca
Licensee MDPI, Basel, Switzerland.
                                          depletion within a thin layer down to 0.2 mm can be measured by element mapping with
This article is an open access article
                                          various techniques, but mineralogical characterisation with such high spatial resolutions
distributed under the terms and
                                          is still demanding [1]. Even more challenging is the characterisation of the measured Mg
conditions of the Creative Commons
                                          enrichments at the interface: the most likely neoformation, nano-crystalline magnesium
Attribution (CC BY) license (https://
creativecommons.org/licenses/by/
                                          silicate hydrate (M–S–H), shows no distinct reflections in X-ray diffraction [11]. Mg X-ray
4.0/).
                                          absorption near-edge spectroscopy reveal a crystallographic structure similar to certain

Minerals 2021, 11, 664. https://doi.org/10.3390/min11070664                                                 https://www.mdpi.com/journal/minerals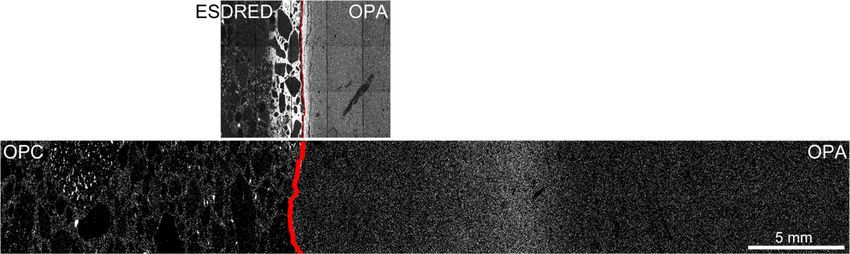
Minerals 2021, 11, 664                                                                                          2 of 17

                         clay minerals [12,13], which impedes M–S–H detection within OPA by this technique.
                         The location and Mg content of the Mg-enriched layer in OPA depend on the nature of
                         the cement [14]. Other interactions between cement and OPA result in carbonation in
                         the cement and a sulphate enrichment detached from the interface, and the change of
                         the exchanger population in OPA [6]. Reactive transport model approaches predict such
                         changes [11,14–19], but studies rarely compare modelling results with experimental data.
                         Of value are modelling studies comparing different cement types interacting with clay
                         under similar conditions to contribute to the engineering design of a repository.
                               Changes in porosity, its distribution and connectivity—and therefore also permeabilit-
                         y—near such interfaces are important processes governing the long-term physicochemical
                         evolution of the engineered barrier and its geological near-field [17]. Increasing poros-
                         ity in the Portland cement close to the interface, and clogging in the claystone adjacent
                         to it are experimentally observed and commonly predicted by reactive transport mod-
                         elling [15–17]. These studies all use a simplified porosity concept and do not account for
                         the clay-specific influence of clay layer charge on the porewater solute distribution and on
                         diffusive transport.
                               Dual porosity reactive transport modelling can take into account such clay-specific
                         features, and this may be crucial when modelled porosity clogging approaches zero-
                         porosity. Jenni, Gimmi, Alt–Epping, Mäder and Cloet [14] describe a novel dual porosity
                         approach, simulate the short-term evolution of Portland cement concrete (OPC) in contact
                         with OPA, and compare the results with experimental data from the CI experiment (Cement-
                         clay Interaction) carried out in the Mont Terri rock laboratory (www.mont-terri.ch). The
                         current study repeated the simulation but exchanged the OPC concrete with a low-alkali
                         cement concrete (ESDRED, named after the European project “Engineering Studies and
                         Demonstrations of Repository Designs” 2004–2008, which included the development of
                         this concrete formulation). Both types of concrete were installed in the CI experiment, and
                         their interfaces were sampled and characterised several times after emplacement. The
                         simulation outcome was compared with element maps of the appropriate interface sample,
                         and with the outcome of the previous OPC-OPA model.

                         2. Materials and Methods
                               The multicomponent reactive transport modelling was performed in 1D with the
                         FLOTRAN code [20] in the same way the OPC—OPA interaction was modelled [14,19].
                         These publications contain further details, especially on the dual porosity approach used
                         for the OPA part of the model, which is summarised in Section 2.2. Advection is negligible
                         in these types of clay host systems. Site-specific transport studies on undisturbed OPA
                         state diffusion-dominated transport [21]. Small hydraulic heads in the OPA close to the
                         repository are expected, which lead to Peclet numbers in the range of 10−2 to 10−3 [22].
                         Glaciations or tunnel convergence might increase the importance of advection only tem-
                         porarily. Therefore, only diffusion and electrochemical migration were included in this
                         model approach.
                               Comparable reactive transport simulations considering electrostatic effects on the
                         solutes were carried out by using CrunchFlowMC and PhreeqC. Alt–Epping, et al. [23]
                         compare the capabilities of these codes with respect to dual porosity. Results of OPC—OPA
                         interface simulations with these codes have been presented in Jenni, et al. [24].

                         2.1. Modelling of the Concrete Domain
                               Diffusive transport followed by reactions between concrete and clay rock start when
                         the freshly-mixed cement slurry is applied to a clay rock surface. Substantial interactions
                         between the materials are likely to occur during the early stage of cement hydration. There-
                         fore, the initial condition of the simulation should consist of unhydrated cement clinker and
                         water. Initial conditions with hardened cement are appropriate in case of pre-cast elements
                         brought in contact with clay, and should not be used to simulate shotcrete applications.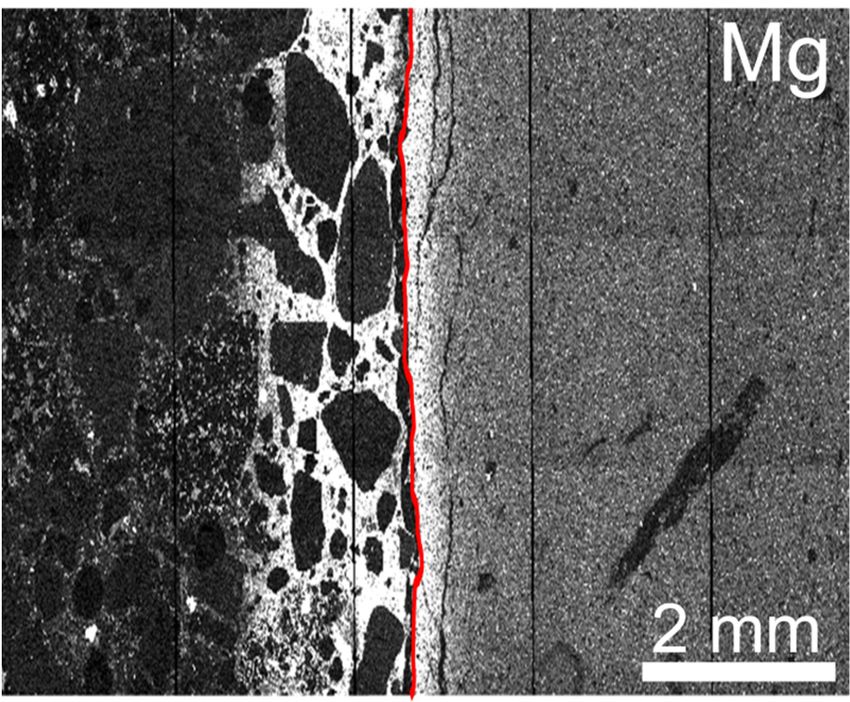
Minerals 2021, 11, 664                                                                                               3 of 17

                               Concrete properties used in the model (e.g., aggregate content, ESDRED cement
                         composition) matched the concrete used in the Mont Terri CI experiment (Table 1, taken
                         from Jenni, Mäder, Lerouge, Gaboreau and Schwyn [6]). The concrete aggregates were
                         considered as non-porous and were included in the initial condition because they lowered
                         total diffusive transport. The low specific surface areas and reaction rates of the aggregate
                         minerals suggested treating them as inert for the limited time-scale of the model, in contrast
                         to reactive clinker phases and nanosilica.

                         Table 1. Characteristics of concrete and cement. Binder represents all reactive components (cement,
                         silica). Cement composition was determined by XRD Riedtveld analysis using an internal standard.

                             Concrete Composition
                                  CEM I 42.5 N                        [kg/m3 ]                            210
                                    silica fume                       [kg/m3 ]                            140
                                 superplasticiser                     [kg/m3 ]                            4.2
                                    accelerator                       [kg/m3 ]                           16.8
                                       water                          [kg/m3 ]                           175
                            water/binder weight ratio                    –                                0.5
                                   sand, gravel                       [kg/m3 ]                           1800
                              Cement Composition
                                       alite                           [wt%]                             52.8
                                      belite                           [wt%]                             22.8
                                    aluminate                          [wt%]                             5.0
                                      ferrite                          [wt%]                              7.9
                                     periclase                         [wt%]                              1.0
                                      calcite                          [wt%]                              2.9
                                      quartz                           [wt%]                              0.5
                                    anhydrite                          [wt%]                              1.9
                                   hemihydrate                         [wt%]                              1.7
                                     gypsum                            [wt%]                             0.0
                                    syngenite                          [wt%]                             2.0
                                     dolomite                          [wt%]                             1.5

                              Within the cement, a geometric factor (ratio of constrictivity/tortuosity) of G = 0.1
                         was chosen, following arguments in Jenni, Gimmi, Alt-Epping, Mäder and Cloet [14].
                              The clinker dissolution rates mainly control the overall cement hydration kinetics,
                         and the formation of hydrates is generally considered to be instantaneous [25,26]. Here,
                         all cement hydrates formed with a fast rate constant of 10−3 mol/m3 /s and a generic
                         surface area of 0.01 m2 /g (rate law described in [27,28]). Two combined dissolution rates
                         per mineral (Table 2) were derived by a best-fit of clinker and silica fume dissolution
                         data, measured by quantitative XRD on reference samples of the same cement [29]. The
                         two rates were implemented by incorporating two reacting versions of the same mineral.
                         Reaction rates of potentially forming non-cement hydrates were taken from Palandri and
                         Kharaka [30] (generic surface area of 0.1 m2 /g). Thermodynamic data was taken from the
                         Cemdata07.2 [26,31–36] and EQ3/6 databases. More details about clinker composition,
                         solid solutions of hydrates, and phase reactions are given in [14].
                              The set accelerator added to the ESDRED concrete leads to a formate content of more
                         than 0.2 M in the early porewater, slightly decreasing with time [29]. In the initial condition
                         of the model, 0.2 M formate, charge-balanced by Ca, was added to the pure water to
                         account for this substantial anionic charge.

                         2.2. Dual Porosity Modelling of Opalinus Clay
                              Opalinus Clay was modeled in the exact same manner as described in Jenni, Gimmi,
                         Alt-Epping, Mäder and Cloet [14], that contains further explanations and figures. Rock
                         composition (Table 3) and porewater chemistry data were taken from Berner, et al. [38],
                         based on measured and modelled data [39–41]. Thermodynamic data was taken from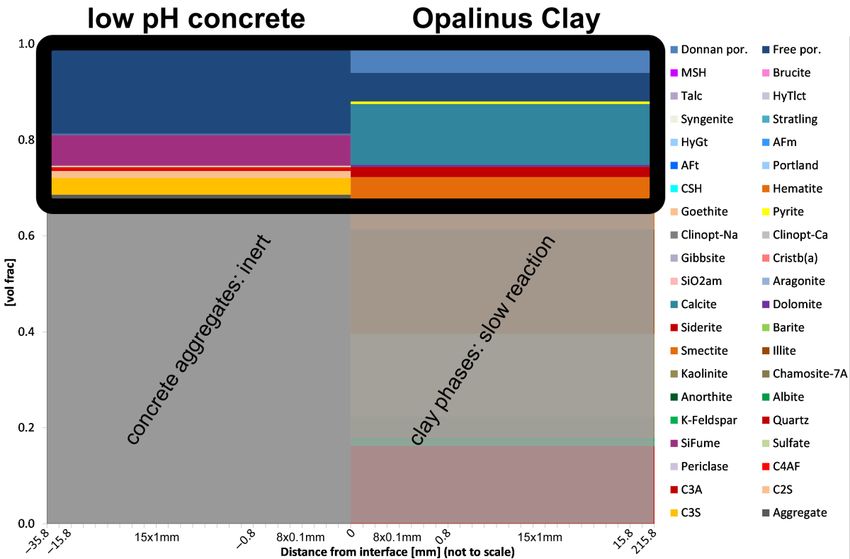
Minerals 2021, 11, 664                                                                                                       4 of 17

                                  EQ3/6, except for chlorite (7 Å chamosite), K-feldspar, and albite, which were treated
                                  as inert. Too many reactive minerals in the simulation violate the phase rule, and no
                                  equilibrium initial condition can be achieved. Pyrophyllite represented the TOT layer of
                                  smectite, considered as inert due to the small extent of reaction to be expected within the
                                  time-scale of the model. Reaction rates for all reactive minerals were taken from Palandri
                                  and Kharaka [30].

      Table 2. Stoichiometric clinker composition calculated from measured cement bulk chemical composition after Taylor [37],
      measured silica fume composition, implemented dissolution rates, and surface areas.

                                               Alite               Belite       Aluminate           Ferrite
                                                                                                                     Si Fume
                                               C3 S                 C2 S           C3 A             C4 AF
           CaO [formula units]                 2.911             1.975             2.793             4.202            0.024
           SiO2 [formula units]                0.956             0.914              0.17              0.293           0.981
          Al2 O3 [formula units]               0.027             0.041              0.85             1.066            0.001
          Fe2 O3 [formula units]                0.01              0.01             0.088             0.665              0
          Na2 O [formula units]                0.002             0.002             0.036             0.005              0
          MgO [formula units]                  0.054             0.015                0                 0             0.003
           K2 O [formula units]                0.002             0.014             0.016              0.007           0.003
     log rate constant1 [mol/m2 /s]          −5.06374          −5.34159          −4.06095          −4.69578         −9.24229
     log rate constant2 [mol/m2 /s]          −7.27421          −8.48021          −8.21623             −8.2          −11.39708
     surface area for 1 and 2 [m2 /g]       0.00319732        0.00301906        0.00329394         0.0026751            21

                                  Table 3. Mineral composition of OPA in wt% of dry rock.

                                                                                                       [wt%]
                                                        illite                                          23.9
                                                     kaolinite                                          17.7
                                                      smectite                                          12.2
                                                       calcite                                          13.7
                                                     dolomite                                           0.5
                                                       quartz                                           17.1
                                                      siderite                                           3.3
                                                       pyrite                                            1.0
                                                    kalifeldspar                                         1.3
                                                       albite                                            1.0
                                                      chlorite                                           8.3

                                        In OPA, 6 vol% of 12 vol% total pores contains porewater with cations balancing the
                                  negative charge of the clay layers. This porosity consists of the water in the clay interlayer
                                  plus the water on clay outer particle surfaces (often called diffuse double layer). Because
                                  both of these porewater domains are similarly influenced by the negative charge of the
                                  clay layers, the sum of the domains was implemented in the model, and is called Donnan
                                  porewater (and Donnan porosity). Its homogeneous chemical composition was calculated
                                  by assuming Donnan equilibrium with the remaining fraction of the porewater, which
                                  is here referred to as freely accessible porewater, free porewater in short (contained in the
                                  free porosity). Donnan equilibrium assumes a homogeneous composition of the Donnan
                                  porewater (averaging a Poisson-Boltzmann distribution), and equal activity coefficients in
                                  both porosity domains [14]. The code inhibited mineral precipitation in the Donnan poros-
                                  ity, and all minerals kinetically equilibrated with the free porewater. Thermodynamically,
                                  mineral phases at saturation had equal chemical potentials in both domains, despite the
                                  depletion of anions (compensated by an electrostatic potential term). The restricted space
                                  in the interlayer was assumed to inhibit nucleation. Chagneau, et al. [42] give experimental
                                  evidence for mineral precipitation in the free porosity only in compacted clay. This implies
                                  that the Donnan porosity was not clogged and always provides a pathway for mainly
                                  neutral species and cations that diffuse while maintaining charge balance (by considering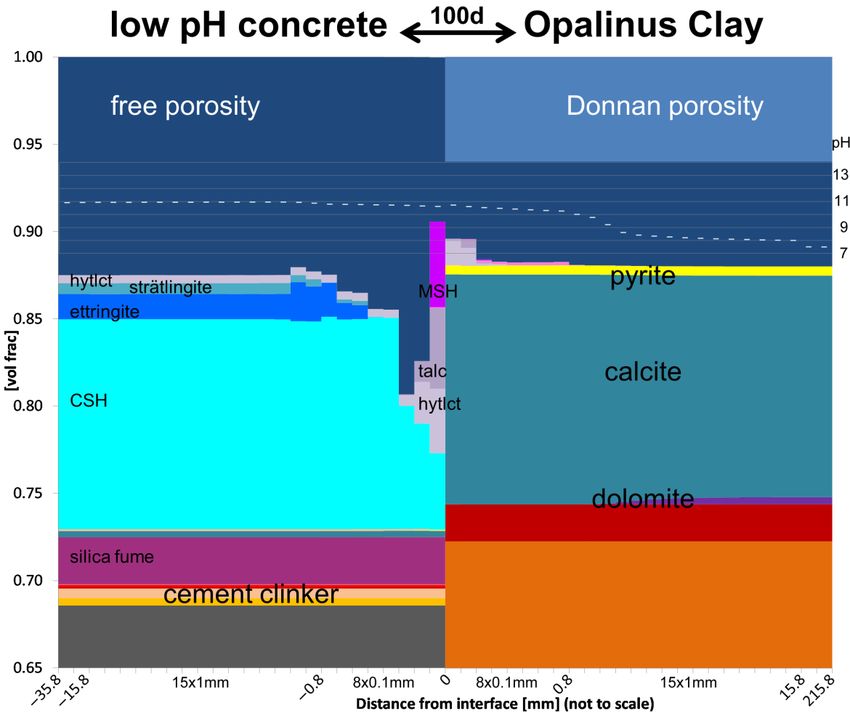
Minerals 2021, 11, 664                                                                                           5 of 17

                         streaming potentials in multi-component transport). The model approach presented here
                         can handle this type of transport [14].
                              In a Donnan porosity concept, Donnan equilibrium between the Donnan porewater
                         and the free porewater replaces conventional cation exchange. An electrostatic term de-
                         pendent on ionic strength and the mean potential governs the Donnan equilibrium. In
                         CrunchflowMC or PhreeqC [23,43–47], this is implemented by an explicit partitioning func-
                         tion that distributes aqueous species between Donnan and free porewater. In the present
                         FLOTRAN approach, the ion partitioning resulted from rapid diffusion and electrochemical
                         migration between the free and Donnan porewater. The cation exchange capacity (CEC)
                         was represented by immobile anions in the Donnan porewater. Technical implementation
                         details are given in [14]. The geometric factor (G = constrictivity/tortuosity) in the free
                         porosity was set to 0.023, and to 0.006 in the Donnan porosity (derived from diffusion
                         experiments in OPA [14]).
                              The Donnan porosity was not linked to a specific clay mineral in the current approach,
                         and the total ion charge in the Donnan porewater balanced the bulk CEC of OPA. Dissolu-
                         tion or precipitation of clay minerals did not decrease or increase the CEC or the Donnan
                         porosity as they should. This simplification is acceptable, because the clay minerals are vir-
                         tually stable on the time-scale of the model presented here (rate constant
Minerals 2021, 11, 664 6 of 17
hydroxide depends on local pH and Mg, Ca, Al, and Si concentrations. Regardless of its
nature, the Mg (Si-) hydroxides precipitated within the Ca-depleted zone of the cement,
and could partly compensate the additional pore space available due to C–S–H dissolution.
Availability of Mg from OPA, the Mg content in the cement, and the capability of the
OPA to lower the pH in the cement determined the extent to which the porosity6 of 17in the
cement at the interface could be clogged. The model prediction clearly shows that Mg (Si-)
hydroxides have the highest potential to clog the porosity in the cement at the interface.
Figure
Figure 1. Phase
1. Phase volume volume
fractionsfractions of initial
of initial condition condition
of the of theinterface.
concrete—OPA concrete—OPA interface.
The legend shows Theconsidered
all phases legend
shows all phases considered in the model (por.: porosity; HyTlct: hydrotalcite; Stratling:
in the model (por.: porosity; HyTlct: hydrotalcite; Stratling: strätlingite; HyGt: hydrogarnet; AFm: monosulphate; AFt:strätlingite;
HyGt: hydrogarnet;
ettringite; AFm: Clinopt:
Portland: portlandite; monosulphate; AFt:Crist
clinoptilolyte; ettringite; Portland: portlandite;
(a): alpha-cristobalite; Clinopt:silica;
SiO2am: amorphous clinoptilo-
SiFume:
lyte; Crist (a): alpha-cristobalite; SiO2am: amorphous silica; SiFume: silica fume; Sulfate:
silica fume; Sulfate: sum of gypsum, hemihydrate, anhydrite; C4AF: ferrite; C3A: aluminate; C2S: belite; C3S: alite). Only sum of
gypsum,
reactive phaseshemihydrate, anhydrite;
ondergoing visible volume C4AF:
changesferrite; C3A:
are shown aluminate;
in subsequent C2S:(top
figures belite; C3S:
30 vol%, alite).
black Only
frame). Thereac-
entire
tive phases
domain ondergoing
was discretised visible
into 16 × 100 volume changes
µm-cells close to theare shown
interface, 30in
× subsequent figures
1 mm-cells further (top
away, and30 vol%,
two largeblack
cells at
the outer concrete
frame). and OPA
The entire boundaries.
domain was discretised into 16 × 100 μm-cells close to the interface, 30 × 1 mm-
cells further away, and two large cells at the outer concrete and OPA boundaries.
Calcite formed in the cement with ongoing in-diffusion of inorganic carbon species
from OPA. Transport was fast enough to carbonate the entire cement domain, but only
Comparably fast dissolution
resulted in calcite of clinkers
contents belowand silica
1 vol% due fume led toreservoir
to the limited the precipitation of
in the OPA porewater.
mainly C–S–H and ettringite (Figure 2). reduced
Therefore, carbonation The high Si content
porosity and lower
and transport pH in theaccording
insignificantly porewa-to this
model prediction.
ter compared to OPC suppressed portlandite formation and favoured low Ca/Si C–S–H,
From the very beginning of interaction, the high-pH front entered the OPA, where it
which is the main difference compared with Portland cements [49]. During the dissolution
was buffered by dissolution of clay minerals. Only negligible volumes of dissolving clay
of the clinker phases, Carequired
were and OH species diffused
to efficiently directly
buffer pH, but into the
the limiting OPA
factor due
was the to reaction
slow the con-kinetics
centration gradient. relative
At the tosame
the OHtime, someTwo
diffusion. OPA porewater
scenarios species diffused
were calculated into reaction
using the slow the con-rates in
Palandri
crete. At the interface, and Kharaka
the pore solution [30],inand the increased
ESDRED was rates (four lower
slightly orders of
inmagnitude)
pH and dis- proposed
solved Ca, which led to the instability of C–S–H and ettringite. In turn, Mg diffusingofinslower
by Marty, et al. [53]. Figure 3 shows a more advanced high-pH front in case
reaction rates, whereas the faster clay reactivity hindered the pH front more efficiently
from OPA porewater ledentering
from to precipitation
the OPA. of Mg-phases.
Over time, the model predicted the precipitation of hydrotalcite in the unaffected
ESDRED due to a slow dissolution of MgO associated with clinker, as predicted in [29].
However, hydrotalcite was not observed experimentally as a hydration product of ES-
DRED (same reference). In the present approach, hydrotalcite might have been more sta-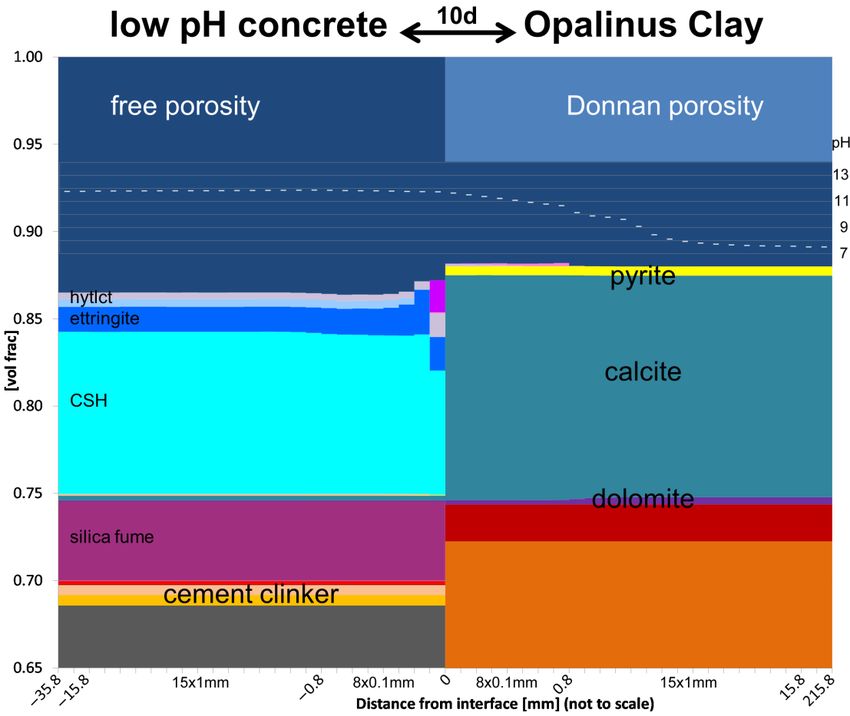
the interface could be clogged. The model prediction clearly shows that Mg (Si-) hydrox-
                         ides have the highest potential to clog the porosity in the cement at the interface.
                              Calcite formed in the cement with ongoing in-diffusion of inorganic carbon species
                         from OPA. Transport was fast enough to carbonate the entire cement domain, but only
Minerals 2021, 11, 664
                         resulted in calcite contents below 1 vol% due to the limited reservoir in the OPA porewa-7 of 17
                         ter. Therefore, carbonation reduced porosity and transport insignificantly according to
                         this model prediction.

                              Figure 2. Cont.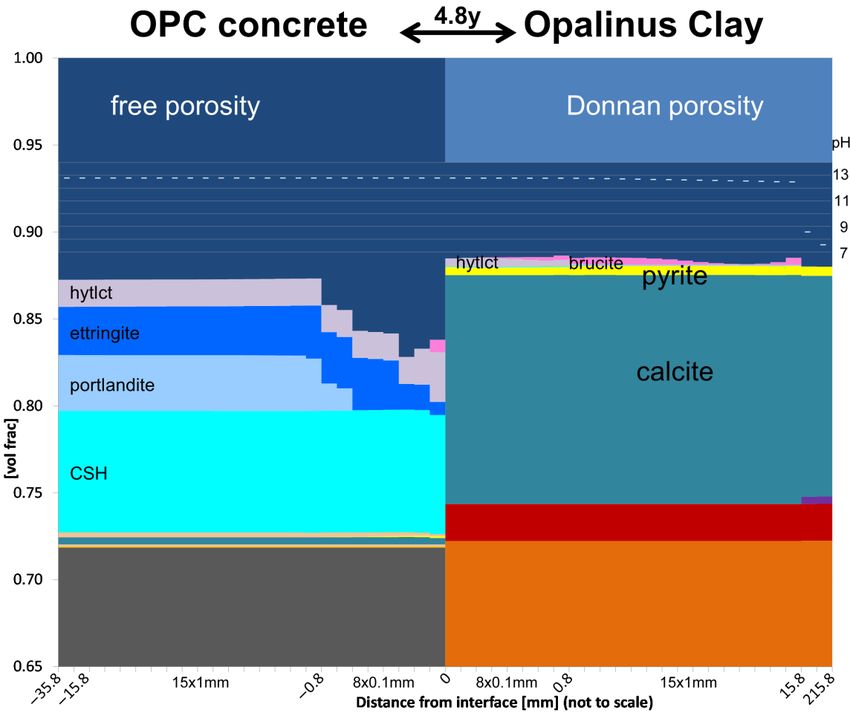
Minerals
Minerals           66411, 664
                2021,
         2021, 11,                                8 of 178 of 17

                                Figure 2. Cont.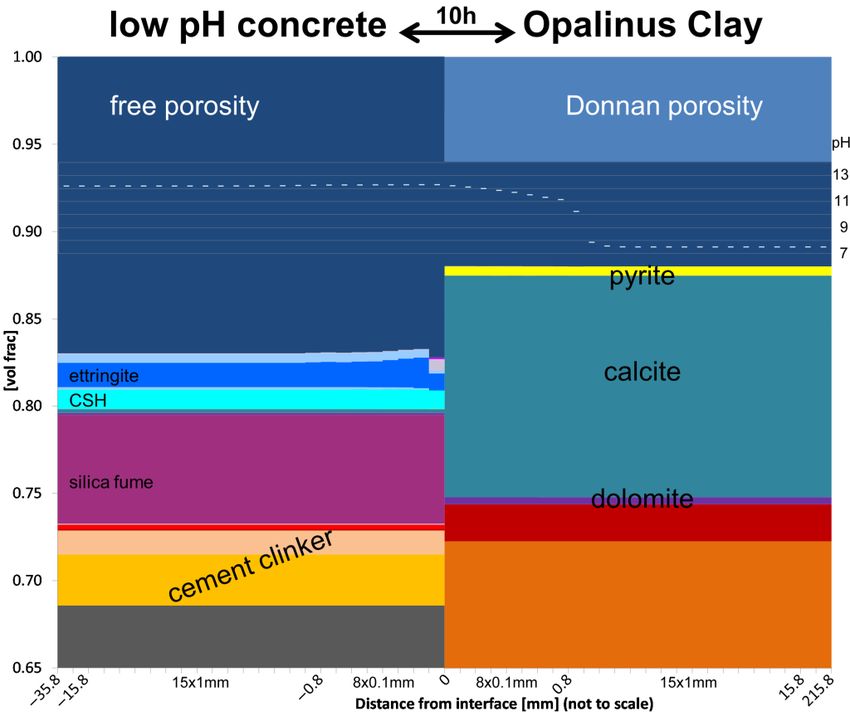
Minerals 2021, 11, 664                                                                                                              9 of 17
Minerals 2021, 11, 664                                                                                                            9 of 17

                              FigureFigure
                                       2. Predicted  volume
                                              2. Predicted   evolution
                                                           volume       of theofreactive
                                                                    evolution            phases
                                                                                  the reactive    (legend
                                                                                               phases     and explanation
                                                                                                       (legend               of horizontal
                                                                                                                 and explanation   of horizontal
                              axis inaxis
                                      Figure   1 and captions). The pH of the free porewater   is indicated in the dark
                                           in Figure 1 and captions). The pH of the free porewater is indicated in the  blue freedark
                                                                                                                                  porosity
                                                                                                                                       blue free
                              area. porosity area.

                                   From the very beginning of interaction, the high-pH front entered the OPA, where it
                              was buffered by dissolution of clay minerals. Only negligible volumes of dissolving clay
                              were required to efficiently buffer pH, but the limiting factor was the slow reaction kinet-
                              ics relative to the OH diffusion. Two scenarios were calculated using the slow reaction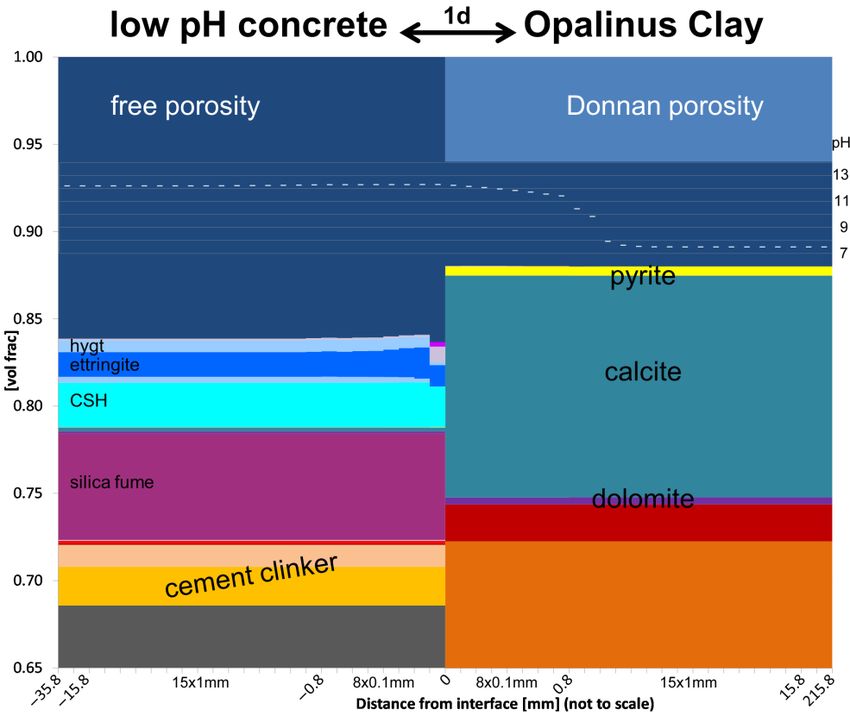
Minerals 2021, 11, 664 10 of 17
Minerals 2021, 11, 664 10 of 17
rates in Palandri and Kharaka [30], and the increased rates (four orders of magnitude)
Minerals 2021, 11, 664 rates in Palandri
proposed andetKharaka
by Marty, [30], and
al. [53]. Figure the increased
3 shows rates (fourhigh-pH
a more advanced orders of magnitude)
front in10case
of 17of
proposed by Marty, et al. [53]. Figure 3 shows a more advanced high-pH front in
slower reaction rates, whereas the faster clay reactivity hindered the pH front more effi- case of
slower reaction rates, whereas
ciently from entering the OPA. the faster clay reactivity hindered the pH front more effi-
ciently from entering the OPA.
Figure 3. pH profiles across the OPA free porewater after 10 h of interaction with ESDRED, mod-
Figure
Figure 3.3.pHpH profiles
profilesacross thethe
across OPA freefree
OPA porewater
porewaterafterafter
10 h10of hinteraction with with
of interaction ESDRED, modelled
ESDRED, mod-
elled with slow and increased reaction rates of illite and kaolinite. Interface at 0 mm, ESDRED on
with
elledslow
with and increased
slow and reaction
increased rates of
reaction illite
rates and
of kaolinite.
illite and Interface
kaolinite. at 0 mm,
Interface ESDRED
at 0 mm, on the left,
ESDRED on
the left, OPA on the right.
OPA on the
the left, OPA right.
on the right.
Following a strong concentration gradient, Mg migrated into the cement. The de-
Following
Following aastrong
strong concentration
concentration gradient, Mg migrated into intothe
thecement. The de-
creasing Mg in the OPA free porewater gradient,
is buffered Mgbymigrated
the large Mg cement.
content in the The
Donnande-
creasing
creasing Mg
Mg in
in the
the OPA
OPA free porewater
free porewater is buffered
is buffered byby the
thelarge
large MgMg content
content ininthe Donnan
the Donnan
porosity(equivalent
porosity
(equivalenttotothe theclay
clayexchangeable
exchangeablecations).
cations). The
The high
high mobility
mobilityof
of the
ofthe
cations
thecations
cationsin
in
porosity
the (equivalent
Donnan porosity toled
thetoclay
a exchangeable
depletion of Mg cations).
up to Themm
15 high mobility
into the OPA within 2.7 y,
inthe
theDonnan
Donnanporosity
porosityled ledtotoaadepletion
depletionof ofMg
Mg up up to
to 1515 mm
mm into
into the
the OPA
OPA within
within 2.7
2.7 y,y,
compensatedmainly
compensated mainly byCa Ca (Figure4), 4),originating
originatingfrom from thethe instability
instability of mainly C–S–H at
compensated
the interface mainlyby by Ca(Figure
(decalcification (Figure
of the 4), originating
cement). The from the
predicted instability
dissolution
ofmainly
ofof
mainlyC–S–H
the
C–S–Hat
minor dolo-
atthe
theinterface
interface (decalcification
(decalcification of of
thethe cement).
cement). TheThe predicted
predicted dissolution of minor
the minor
mite
dolomite content in the
content in OPA
the OPA contributed
contributed to to
a smaller
a smaller extent
extenttodissolution
the
to theMg
Mg
of the
supply.
supply. TheThe
dolo-
freed
freed Ca
mite
and content
carbonatein the
speciesOPA werecontributed
bound into a
newlysmaller
formedextent to
calcite,the
but Mg
weresupply.
also The freed
released to Ca
the
Caandand carbonate
carbonate species
species were were bound
bound in in newly
newly formed
formed calcite,
calcite, butbut were
were also
also released
released to to
the
theOPA
OPA porewater.
porewater.
OPA porewater.
Figure 4. The cation concentration profile in the Donnan porewater (in charge equivalent fractions)
Figure
across4.4.
theThe
OPAcation
afterconcentration profile in the
2.7 y of interaction Donnan porewater (in charge equivalent fractions)
Figure The cation concentration profile with
in theESDRED.
Donnan In the current
porewater (in modelling approach,
charge equivalent the Don-
fractions)
across the OPA
nan porewater after 2.7 y of
concentrations interaction
replaced with ESDRED. In the current modelling approach, theion-ex-
Don-
across the OPA after 2.7 y of interaction withthe cation occupancies
ESDRED. In the currentofmodelling
clay models with explicit
approach, the Donnan
nan porewater concentrations
change. Explanation replaced
of horizontal axis the cation
in Figure occupancies
1 captions. of clay models with explicit ion-ex-
porewater concentrations
change. Explanation replaced the
of horizontal cation
axis occupancies
in Figure of clay models with explicit ion-exchange.
1 captions.
Explanation of horizontal axis in Figure 1 captions.
Mg-hydroxides also formed in the OPA at the interface within a layer of increased
Mg-hydroxides
pH.Mg-hydroxides
Between 100 dalsoandalso2.7
formed
y, the in the OPA atbecame
the interface within a layerbut
of increased
formed in free porosity
the OPA completely
at the interface clogged,
within a layer the model
of increased pH.
pH.
was Between
set up in100
a d
way and
that2.7 y, the
transport free porosity
between thebecame
free completely
porewater in clogged,
the cement but
andthe model
the Don-
Between 100 d and 2.7 y, the free porosity became completely clogged, but the model was
was
nan set up in a way
porewater in that
the OPAtransport
could between
continue the free porewater
(Section 2.2). in the anion
However, cement and theacross
mobility Don-
set up in a way that transport between the free porewater in the cement and the Donnan
nan porewater in the OPA could continue (Section 2.2). However, anion mobility across
porewater in the OPA could continue (Section 2.2). However, anion mobility across the
interface was extremely low due to the low anion concentration in the Donnan porosity.
In turn, neutral species (e.g., water tracer) and cations still migrated considerably across
the interface, as proposed in Jenni, Gimmi, Alt-Epping, Mäder and Cloet [14], and by aMinerals 2021, 11, 664 11 of 17
Minerals 2021, 11, 664 11 of 17
the interface was extremely low due to the low anion concentration in the Donnan poros-
ity. In turn, neutral species (e.g., water tracer) and cations still migrated considerably
across the interface, as proposed in Jenni, Gimmi, Alt-Epping, Mäder and Cloet [14], and
bydiffusion
a diffusion experiment
experiment with with a clogged
a fully fully clogged illite[42].
illite core coreA[42]. A porosity
single single porosity model
model approach
approach cannot predict this ongoing interaction across an interface clogged
cannot predict this ongoing interaction across an interface clogged on the clay side on the clayof
side of an interface.
an interface.
3.2.Comparison
3.2. ComparisonofofLow-pH
Low-pHand
and Portland
Portland Cement
Cement Interactions
Interactions with
with Opalinus
Opalinus Clay
Clay
Themodelling
The modellingofofthe theESDRED
ESDRED low-pH
low-pH cement
cement interaction
interaction with
with Opalinus
Opalinus Clay
Clay pre-
pre-
dictedananearly
dicted earlyclogging
cloggingofofthethefree
freeporosity
porosityononthe
theclay-side,
clay-side, which
which led
led toto a substantial
a substantial
decreaseofof
decrease thethe interaction
interaction rates:
rates: phase
phase distributions
distributions afterafter
4.8 y4.8 y of interaction
of interaction resemble
resemble the
they 2.7
2.7 oldyinterface,
old interface,
and theandpenetration
the penetration
of theofpH
thefront
pH front virtually
virtually stopped
stopped (Figure
(Figure 5). In5).
In contrast,
contrast, the porosity
the porosity at theatOPC-OPA
the OPC-OPA interface
interface waspredicted
was only only predicted to minimally
to minimally clog
clog after
after 4.8 y [14]. In both predictions, OPA initial conditions and transport
4.8y [14]. In both predictions, OPA initial conditions and transport models are equal. The models are equal.
The difference
main main difference is the presence
is the presence of rapidly
of rapidly dissolving
dissolving silicaand
silica fume fumetheand the formate
formate as addi-as
additional
tional anionanion
charge charge
carriercarrier
in theinESDRED,
the ESDRED, leading
leading to ato a lower
lower pHpH andandan an increased
increased Si Si
contentininthe
content theporewater
porewatercompared
comparedtotoOPC.OPC.
Figure 5. Cont.Minerals 2021, 11, 664 12 of 17
Minerals 2021, 11, 664 12 of 17
Figure
Figure 5.5. Predicted volume
volume evolution
evolutionofofthe
thereactive phases
reactive phasesafter 4.84.8
after y ofyinteraction of ESDRED
of interaction of ESDRED(top),
(top), and (bottom,
and OPC OPC (bottom, modified
modified [14]) [14]
fromfrom with) with
OPA.OPA. The phase
The phase legendlegend and explanation
and explanation of hori-
of horizontal
zontal
axis is axis
shownis shown in Figure
in Figure 1 and captions,
1 and captions, the pH the pHfree
of the of the free porewater
porewater is indicated
is indicated in the
in the dark dark
blue free
blue free area.
porosity porosity area.
3.3. Comparison
3.3. ComparisonofofModel ModelPredictions
Predictionswith
withMeasurements
Measurements
Quantitativeagreement
Quantitative agreementof ofthe
themodel
modelpredictions
predictionswith withmeasurements
measurementsisisnot notperfect
perfect
but shares
but shares essential communalities. It must be kept in mind that significant local variability
mind that significant local variabil-
exists
ity across
exists across samples
samples ofof
equivalent
equivalentinterfaces
interfacesin interms
terms of of amount of of neoformations
neoformationsand and
extent of
extent of interaction
interactionzones.zones.The
The qualitative
qualitativeagreement
agreement of measurements
of measurements on bothon ESDRED—
both ES-
OPA and OPC—OPA
DRED—OPA and OPC—OPAinterfaces with predicted
interfaces interaction
with predicted is striking.
interaction Both simulations
is striking. Both sim-
predictedpredicted
ulations decalcification and depletion
decalcification in sulphurininsulphur
and depletion the cement at the
in the interface
cement (portlandite,
at the interface
(portlandite, C–S–H, and ettringite dissolution) in agreement with chemical mapsand
C–S–H, and ettringite dissolution) in agreement with chemical maps (Figure 6 [14]).
(Figure
Whereas a substantial Mg enrichment was measured in ESDRED
6 and [14]). Whereas a substantial Mg enrichment was measured in ESDRED and in adja- and in adjacent OPA
only close to the interface, OPC—OPA interfaces showed no or
cent OPA only close to the interface, OPC—OPA interfaces showed no or very limited Mg very limited Mg increase
at the interface,
increase but a small
at the interface, but adetached enrichment
small detached enrichmentat approximately
at approximately 7 mm7 distance
mm distancefrom
the interface
from in thein
the interface OPA
the (Figure 7). These
OPA (Figure cement-specific
7). These features
cement-specific were predicted
features by both
were predicted
simulations:
by the Mg-mineral
both simulations: hydrotalcite
the Mg-mineral occured
hydrotalcite in both
occured inESDRED
both ESDREDand OPA right right
and OPA at the
interface, but in OPC—OPA, brucite (very high in Mg) occurred
at the interface, but in OPC—OPA, brucite (very high in Mg) occurred distant from the distant from the interface
(further details
interface (further given in [14]).
details givenBoth models
in [14]). Bothalso suggested
models that the Mg
also suggested thatenrichments in the
the Mg enrich-
OPA traced the high-pH fronts, which reached different positions
ments in the OPA traced the high-pH fronts, which reached different positions in the two in the two interfaces
(Figure 5).(Figure
interfaces The exact identity
5). The exactofidentity
the Mg-phase is under investigation
of the Mg-phase [1,12]. [1,12].
is under investigationMinerals 2021, 11, 664 13 of 17
Minerals 2021, 11, 664 13 of 17
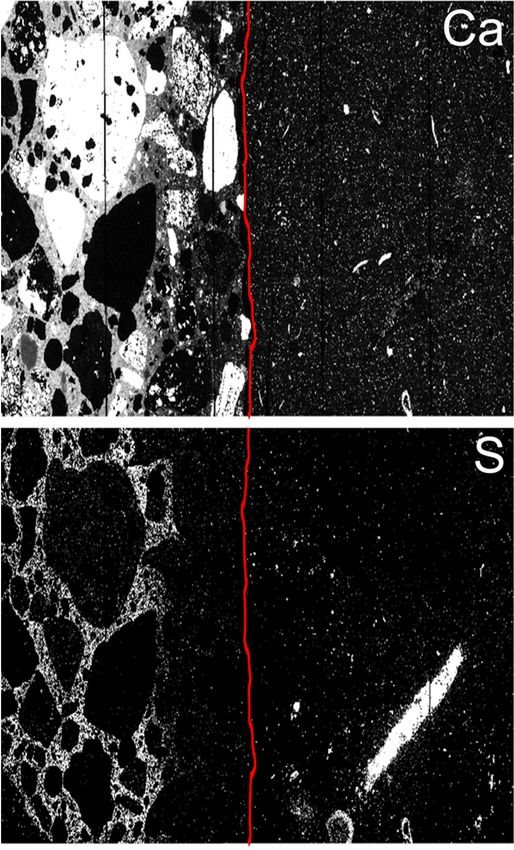
Figure 6. SEM EDX element maps of 4.8 y ESDRED-OPA interfaces, concrete on the left, OPA on
Figure 6. SEM EDX element maps of 4.8 y ESDRED-OPA interfaces, concrete on the left, OPA on
the right of the interface marked in red. Bright areas represent high concentrations of the element
the right of the interface marked in red. Bright areas represent high concentrations of the element
indicated. On the concrete side, only the cement matrix between the aggregates is relevant. OPA
indicated. On the(high
contains pyrite concrete side,
S areas) only
and the cement
calcite (high Camatrix
spots).between the aggregates is relevant. OPA
contains pyrite (high S areas) and calcite (high Ca spots).Minerals 2021, 11, 664 14 of 17
Minerals 2021, 11, 664 14 of 17
Figure 7. Comparison of SEM EDX Mg maps of interfaces (4.8 y), concrete on the left, OPA on the right of the interface
Figure 7. Comparison of SEM EDX Mg maps of interfaces (4.8 y), concrete on the left, OPA on the right of the interface
marked in red. Bright areas represent high Mg concentrations. On the concrete side, only the cement matrix between the
marked in red.
aggregates Bright areas represent high Mg concentrations. On the concrete side, only the cement matrix between the
is relevant.
aggregates is relevant.
4. Conclusions
4. Conclusions
Several uncertainties of this modelling approach limit a quantitative prediction of the
Several uncertainties of this modelling approach limit a quantitative prediction of
evolution at the cement—clay interface, especially for extended interaction times to hun-
the evolution at the cement—clay interface, especially for extended interaction times to
dreds or thousands of years. Transport parameters, especially geometric factors in the free
hundreds or thousands of years. Transport parameters, especially geometric factors in the
and Donnan porosities, are not well known and large errors may arise from a simple esti-
free and Donnan porosities, are not well known and large errors may arise from a simple
mation from OPA diffusion experiments. Clay dissolution rates given in literature differ
estimation from OPA diffusion experiments. Clay dissolution rates given in literature
significantly, but strongly influence the interaction model outcome: the relationship be-
differ significantly, but strongly influence the interaction model outcome: the relationship
tween transport, e.g., migration of the pH-front, and rates of mineral dissolution, e.g.,
between transport, e.g., migration of the pH-front, and rates of mineral dissolution, e.g.,
buffering pH, determine the extent of cement—clay interaction. An additional crucial un-
buffering pH, determine the extent of cement—clay interaction. An additional crucial
certainty is the degree to which the free porosity can be clogged. Further, assuming a min-
uncertainty is the degree to which the free porosity can be clogged. Further, assuming a
imal
minimalremaining
remaining freefree
porosity,
porosity,as asstrongly
strongly suspected
suspectedininthe theconcrete,
concrete,leads leadstoto considerable
considerable
interaction within thousands of years. In contrast, full
interaction within thousands of years. In contrast, full clogging of the total clogging of the total porosity
porosityin the
in
concrete at the interface (implemented in the model by allowing
the concrete at the interface (implemented in the model by allowing precipitations up to precipitations up to zero
porosity)
zero porosity)would completely
would completelystop stop
cement-clay interaction.
cement-clay SuchSuch
interaction. conceptual questions
conceptual can-
questions
not be answered by modelling studies, but require long-term
cannot be answered by modelling studies, but require long-term transport experiments, transport experiments,
whose
whose outcome
outcome can then be
can then be used
used to to conceptualise
conceptualise the the models.
models.
It is striking that the predicted extent
It is striking that the predicted extent of alteration in of alteration in terms
terms of of overall
overall mass
mass transfer
transfer
in case of the ESDRED (“low-pH cement”) was in fact larger
in case of the ESDRED (“low-pH cement”) was in fact larger than that in the OPC case than that in the OPC case
after
after aa given
given time,
time, e.g.,
e.g., 4.7
4.7 yy (Figure
(Figure 5). 5). This
This was predicted despite
was predicted despite that that the
the mobility
mobility of of
solutes across the
solutes across theinterface
interfacebecamebecamerestricted
restricteddue due toto clogging
clogging of offreefree porosity
porosity in case
in case of
of the
the low-alkali
low-alkali cement.
cement. OnlyOnly the penetration
the penetration of theofhigh-pH
the high-pH front front
into the intoclaystone
the claystone
was morewas
more extensive in the OPC case, but it was associated with smaller
extensive in the OPC case, but it was associated with smaller mineral mass transfers. In the mineral mass transfers.
In the ESDRED,
ESDRED, the decrease
the decrease of Ca-containing
of Ca-containing hydrates hydrates at the interface
at the interface was higherwasthanhigher than
in OPC.
in OPC.
More More dissolved
dissolved Ca may have Ca may have diffused
diffused from ESDREDfrom ESDRED
into the OPA into theandOPA and exchanged
exchanged with Mg,
with
which Mg, which precipitated
precipitated within thewithinnarrow thehigh-pH
narrow high-pH
zone. Thezone. The clogging
clogging of OPA’sof OPA’s
free free
porosity
porosity
could notcould stop not
this stop
cation this cation exchange,
exchange, because itbecause it could continue
could continue via the porosity.
via the Donnan Donnan
porosity.
In contrast, In OH − wasOH
contrast, - was mainly present in the free porosity and its diffusion was
mainly present in the free porosity and its diffusion was therefore
therefore
affected by free porosity clogging. Inclogging.
affected by free porosity the OPA in In contact
the OPA within OPC,
contact thewith OPC, the Mg
Mg neoformations
neoformations
distributed over distributed
a far widerover a far wider
high-pH zone andhigh-pH
cloggedzone andaclogged
only only a small
small porosity poros-
fraction.
ity fraction.
A supposedly higher inherent reactivity of OPC compared to low-alkali cementitious
products due to its contrasting
A supposedly higher inherent initial pH has motivated
reactivity of OPC comparedimplementers to reduce,
to low-alkali substitute
cementitious
or omit OPC
products dueintosome repository designs
its contrasting initial pH for has
radioactive
motivated waste. If our modeltoindeed
implementers reduce, captured
substi-
the key
tute reactive
or omit OPC processes,
in some arepository
more extensivedesigns alteration at OPC-claystone
for radioactive waste. If our interfaces
modelmay not
indeed
be expected, and thus this a priori assumption is incorrect
captured the key reactive processes, a more extensive alteration at OPC-claystone inter- and should not be a decisive
issue.may
faces A similar
not beconclusion
expected, was and reached
thus this[2] simplyassumption
a priori by comparing the extents
is incorrect andofshould
alteration
not
based
be on highly-resolved
a decisive issue. A similar element
conclusionmapswas andreached
other methods
[2] simply (similar to Figures
by comparing the6 extents
and 7),
and
of this despite
alteration based a significantly larger water/cement
on highly-resolved element maps ratio
andofother
0.8 inmethods
OPC compared(similartoto0.5 in
Fig-
ures 6 and 7), and this despite a significantly larger water/cement ratio of 0.8 in OPCMinerals 2021, 11, 664 15 of 17
the ESDRED cement. Based on the extensive characterisation and modelling of interfaces
from the Mont Terri CI experiment reacted for up to 10 years, the high-pH front coming
from OPC enters deeper into the OPA compared with the ESDRED high-pH front. In
turn, the volumes of dissolved cement and neoformations are larger at the ESDRED-OPA
interface. Simplified numerical simulations of Portland cement—clay interaction run
for longer times [17,38,54] predicted clogging after considerably longer interactions than
10 years. This suggests that both high-pH and low-pH cements will clog eventually. The
expected difference in clogging time might be crucial if the buffer resaturation requires
water transport across a clay-cement interface.
Author Contributions: Conceptualization, A.J. and U.M.; methodology, A.J.; software, A.J.; vali-
dation, A.J. and U.M.; formal analysis, A.J. and U.M.; investigation, A.J. and U.M.; resources, A.J.
and U.M.; data curation, A.J.; writing—original draft preparation, A.J.; writing—review and edit-
ing, A.J. and U.M.; visualization, A.J.; supervision, U.M.; project administration, A.J. and U.M.;
funding acquisition, A.J. and U.M. All authors have read and agreed to the published version of
the manuscript.
Funding: This research was partially funded by the Mont Terri Consortium.
Data Availability Statement: The data presented in this study are available on request from the
corresponding author. The data are not publicly available due to technical reasons.
Acknowledgments: Peter Alt-Epping and Thomas Gimmi are acknowledged for their modifications
of FLOTRAN. The Mont Terri Consortium via the CI Experiment group (ANDRA, CRIEPI, FANC,
IRSN, Nagra, NWMO, Obayashi, RWM, SCK-CEN) provided funding for sampling campaigns and
sample characterisation, as well as partial funding for this modeling study. The paper was improved
by the internal review of Ellina Bernard.
Conflicts of Interest: The authors declare no conflict of interest.
References
1. Bernard, E.; Jenni, A.; Fisch, M.; Grolimund, D.; Mäder, U. Micro-X-ray diffraction and chemical mapping of aged interfaces
between cement pastes and Opalinus Clay. Appl. Geochem. 2020, 115, 104538. [CrossRef]
2. Mäder, U.; Jenni, A.; Lerouge, C.; Gaboreau, S.; Miyoshi, S.; Kimura, Y.; Cloet, V.; Fukaya, M.; Claret, F.; Otake, T.; et al. 5-year
chemico-physical evolution of concrete–claystone interfaces, Mont Terri rock laboratory (Switzerland). Swiss J. Geosci. 2017, 1–21.
[CrossRef]
3. Idiart, A.; Laviña, M.; Kosakowski, G.; Cochepin, B.; Meeussen, J.C.L.; Samper, J.; Mon, A.; Montoya, V.; Munier, I.; Poonoosamy, J.;
et al. Reactive transport modelling of a low-pH concrete/clay interface. Appl. Geochem. 2020, 115, 104562. [CrossRef]
4. Lerouge, C.; Gaboreau, S.; Grangeon, S.; Claret, F.; Warmont, F.; Jenni, A.; Cloet, V.; Mäder, U. In situ interactions between
Opalinus Clay and Low Alkali Concrete. Phys. Chem. Earth Parts A/B/C 2017, 99, 3–21. [CrossRef]
5. Fisch, M.; Jenni, A.; Mäder, U.; Grolimund, D.; Cloet, V. CI Experiment: Micro-XRD Studies on 3.2-Year-Old Interfaces between Opalinus
Clay and OPC and ESDRED Mortar (3rd Sampling Campaign 2015); TN 2016-73; Mont Terri Project: St. Ursanne, Switzerland, 2017.
6. Jenni, A.; Mäder, U.; Lerouge, C.; Gaboreau, S.; Schwyn, B. In situ interaction between different concretes and Opalinus Clay.
Phys. Chem. Earth Parts A/B/C 2014, 70–71, 71–83. [CrossRef]
7. Dauzères, A.; Le Bescop, P.; Sardini, P.; Coumes, C.C.D. Physico-chemical investigation of clayey/cement-based materials
interaction in the context of geological waste disposal: Experimental approach and results. Cem. Concr. Res. 2010, 40, 1327–1340.
[CrossRef]
8. Read, D.; Glasser, F.P.; Ayora, C.; Guardiola, M.T.; Sneyers, A. Mineralogical and microstructural changes accompanying the
interaction of Boom Clay with ordinary Portland cement. Adv. Cem. Res. 2001, 13, 175–183. [CrossRef]
9. Tinseau, E.; Bartier, D.; Hassouta, L.; Devol-Brown, I.; Stammose, D. Mineralogical characterization of the Tournemire argillite
after in situ interaction with concretes. Waste Manag. 2006, 26, 789–800. [CrossRef] [PubMed]
10. Gaboreau, S.; Prêt, D.; Tinseau, E.; Claret, F.; Pellegrini, D.; Stammose, D. 15 years of in situ cement-argillite interaction from
Tournemire URL: Characterisation of the multi-scale spatial heterogeneities of pore space evolution. Appl. Geochem. 2011, 26,
2159–2171. [CrossRef]
11. Dauzères, A.; Achiedo, G.; Nied, D.; Bernard, E.; Alahrache, S.; Lothenbach, B. Magnesium perturbation in low-pH concretes
placed in clayey environment—solid characterizations and modeling. Cem. Concr. Res. 2016, 79, 137–150. [CrossRef]
12. Vespa, M.; Borca, C.; Huthwelker, T.; Lothenbach, B.; Dähn, R.; Wieland, E. Structural characterisation of magnesium (sodium)
aluminium silicate hydrate (M-(N)-A-S-H) phases by X-ray absorption near-edge spectroscopy. Appl. Geochem. 2020, 123, 104750.
[CrossRef]Minerals 2021, 11, 664 16 of 17
13. Vespa, M.; Lothenbach, B.; Dähn, R.; Huthwelker, T.; Wieland, E. Characterisation of magnesium silicate hydrate phases (M–S–H):
A combined approach using synchrotron-based absorption-spectroscopy and ab initio calculations. Cem. Concr. Res. 2018, 109,
175–183. [CrossRef]
14. Jenni, A.; Gimmi, T.; Alt-Epping, P.; Mäder, U.; Cloet, V. Interaction of ordinary Portland cement and Opalinus Clay: Dual
porosity modelling compared to experimental data. Phys. Chem. Earth Parts A/B/C 2017, 99, 22–37. [CrossRef]
15. Marty, N.C.M.; Tournassat, C.; Burnol, A.; Giffaut, E.; Gaucher, E.C. Influence of reaction kinetics and mesh refinement on the
numerical modelling of concrete/clay interactions. J. Hydrol. 2009, 364, 58–72. [CrossRef]
16. De Windt, L.; Marsal, F.; Tinseau, E.; Pellegrini, D. Reactive transport modeling of geochemical interactions at a concrete/argillite
interface, Tournemire site (France). Phys. Chem. Earth 2008, 33, S295–S305. [CrossRef]
17. Kosakowski, G.; Berner, U. The evolution of clay rock/cement interfaces in a cementitious repository for low- and intermediate
level radioactive waste. Phys. Chem. Earth 2013, 64, 65–86. [CrossRef]
18. Jenni, A.; Mäder, U. Reactive transport modelling of cement-clay interaction accounting for electrostatic effects in the clay. In
Proceedings of the Mechanisms and Modelling of Waste/Cement Interactions, Karlsruhe, Germany, 25 March 2019.
19. Jenni, A.; Gimmi, T.; Alt-Epping, P.; Mäder, U. CI Experiment: Interaction of Ordinary Portland Cement and Opalinus Clay: Dual
Porosity Modelling Compared to Experimental Data; TN 2015-99; Mont Terri Project: St. Ursanne, Switzerland, 2016.
20. Lichtner, P.C. FLOTRAN User’s Manual Version 2.0: LA-CC 02-036; Los Alamos National Laboratory: Los Alamos, NM, USA, 2007.
21. Beauhheim, R.L. Hydraulic Conductivity and Head Distributions in the Host Rock Formations of the Proposed Siting Regions; Nagra
Arbeitsbericht NAB: Wettingen, Switzerland, 2013.
22. Kosakowski, G. Time-Dependent Flow and Transport Calculations for Project Opalinus Clay; Nagra Arbeitsbericht NAB: Wettingen,
Switzerland, 2004.
23. Alt-Epping, P.; Tournassat, C.; Rasouli, P.; Steefel, C.I.; Mayer, K.U.; Jenni, A.; Mäder, U.; Sengor, S.S.; Fernández, R. Benchmark
reactive transport simulations of a column experiment in compacted bentonite with multispecies diffusion and explicit treatment
of electrostatic effects. Comput. Geosci. 2015, 1–16. [CrossRef]
24. Jenni, A.; Mäder, U.; Wieland, E.; Lerouge, C.; Gaboreau, S. Concrete-clay interaction: Give-and-take without a loser? In
Proceedings of the 6th Meeting on Clays in Natural and Engineered Barrier for Radioactive Waste Confinement, Brussels,
Belgium, 25 March 2015.
25. Parrot, L.J.; Killoh, D.C. Prediction of Cement Hydration; British Ceramic Society: Stoke-on-Trent, UK, 1984; pp. 41–53.
26. Lothenbach, B.; Winnefeld, F. Thermodynamic modelling of the hydration of Portland cement. Cem. Concr. Res. 2006, 36, 209–226.
[CrossRef]
27. Lasaga, A.C. Transition state theory. Rev. Mineral. Geochem. 1981, 8, 135–168.
28. Lasaga, A.C. Chemical kinetics of water-rock interactions. J. Geophys. Res. 1984, 89, 4009–4025. [CrossRef]
29. Lothenbach, B.; Rentsch, D.; Wieland, E. Hydration of a silica fume blended low-alkali shotcrete cement. Phys. Chem. Earth Parts
A/B/C 2014, 70–71, 3–16. [CrossRef]
30. Palandri, J.L.; Kharaka, Y.K. A Compilation of Rate Parameters of Water-Mineral Interaction Kinetics for Application to Geochemical
Modeling; U.S. Geological Survey: Washington, WA, USA, 2004.
31. Babushkin, V.I.; Matveyev, G.M.; Mchedlov-Petrossyan, O.P. Thermodynamics of Silicates; Springer: Berlin, Germany, 1985.
32. Hummel, W.; Berner, U.; Curti, E.; Pearson, F.J.; Thoenen, T. Nagra/PSI chemical thermodynamic data base 01/01. Radiochim.
Acta 2002, 90, 805–813. [CrossRef]
33. Matschei, T.; Lothenbach, B.; Glasser, F.P. Thermodynamic properties of Portland cement hydrates in the system CaO-Al2 O3 -SiO2 -
CaS O4 -CaCO3 -H2 O. Cem. Concr. Res. 2007, 37, 1379–1410. [CrossRef]
34. Moeschner, G.; Lothenbach, B.; Rose, J.; Ulrich, A.; Figi, R.; Kretzschmar, R. Solubility of Fe-ettringite (Ca6 [Fe(OH)6 ]2 (SO4 )3
26H2 O). Geochim. Cosmochim. Acta 2008, 72, 1–18. [CrossRef]
35. Moeschner, G.; Lothenbach, B.; Winnefeld, F.; Ulrich, A.; Figi, R.; Kretzschmar, R. Solid solution between Al-ettringite and
Fe-ettringite (Ca6 [Al1-x Fex (OH)6 ]2 (SO4 )3 26H2 O). Cem. Concr. Res. 2009, 39, 482–489. [CrossRef]
36. Schmidt, T.; Lothenbach, B.; Romer, M.; Scrivener, K.; Rentsch, D.; Figi, R. A thermodynamic and experimental study of the
conditions of thaumasite formation. Cem. Concr. Res. 2008, 38, 337–349. [CrossRef]
37. Taylor, H.F.W. Cement Chemistry, 2nd ed.; Thomas Telford Publishing: London, UK, 1997.
38. Berner, U.; Kulik, D.A.; Kosakowski, G. Geochemical impact of a low-pH cement liner on the near field of a repository for spent
fuel and high-level radioactive waste. Phys. Chem. Earth 2013, 64, 46–56. [CrossRef]
39. Mäder, U. Reference Pore Water for the Opalinus Clay and “Brown Dogger” for the Provisional Safety-Analysis in the Framework of the
Sectorial Plan–Interim Results (SGT-ZE); NAB 09-14; Nagra: Wettingen, Switzerland, 2009.
40. Mazurek, M. Aufbau und Auswertung der Gesteinsparameter-Datenbank für Opalinuston, den ’Braunen Dogger’, Effinger Schichten und
Mergel-Formationen des Helvetikums; NAB 11-020; Nagra: Wettingen, Switzerland, 2011.
41. Pearson, F.J.; Tournassat, C.; Gaucher, E.C. Biogeochemical processes in a clay formation in situ experiment: Part E - Equilibrium
controls on chemistry of pore water from the Opalinus Clay, Mont Terri Underground Research Laboratory, Switzerland. Appl.
Geochem. 2011, 26, 990–1008. [CrossRef]
42. Chagneau, A.; Tournassat, C.; Steefel, C.I.; Bourg, I.C.; Gaboreau, S.; Esteve, I.; Kupcik, T.; Claret, F.; Schaefer, T. Complete
Restriction of 36 Cl− Diffusion by Celestite Precipitation in Densely Compacted Illite. Environ. Sci. Technol. Lett. 2015, 2, 139–143.
[CrossRef]Minerals 2021, 11, 664 17 of 17
43. Appelo, C.A.J.; Wersin, P. Multicomponent diffusion modeling in clay systems with application to the diffusion of tritium, iodide,
and sodium in Opalinus Clay. Environ. Sci. Technol. 2007, 41, 5002–5007. [CrossRef]
44. Steefel, C.I. CrunchFlow: Software for Modeling Multicomponent Reactive Flow and Transport. 2009. Available online:
https://bitbucket.org/crunchflow/crunchtope-dev/wiki/Home (accessed on 23 February 2021).
45. Tournassat, C.; Appelo, C.A.J. Modelling approaches for anion-exclusion in compacted Na-bentonite. Geochim. Cosmochim. Acta
2011, 75, 3698–3710. [CrossRef]
46. Tournassat, C.; Steefel, C.I. Ionic Transport in Nano-Porous Clays with Consideration of Electrostatic Effects. Rev. Mineral.
Geochem. 2015, 80, 287–329. [CrossRef]
47. Tournassat, C.; Steefel, C.I. Reactive Transport Modeling of Coupled Processes in Nanoporous Media. Rev. Mineral. Geochem.
2019, 85, 75–109. [CrossRef]
48. Gimmi, T.; Alt-Epping, P. Simulating Donnan equilibria based on the Nernst-Planck equation. Geochim. Cosmochim. Acta 2018,
232, 1–13. [CrossRef]
49. Lothenbach, B. Hydration of Blended Cements. In Cement-Based Materials for Nuclear Waste Storage; Bart, F., Cau-di-Coumes, C.,
Frizon, F., Lorente, S., Eds.; Springer: New York, NY, USA, 2013; pp. 33–41. [CrossRef]
50. Myers, R.J.; L’Hôpital, E.; Provis, J.L.; Lothenbach, B. Effect of temperature and aluminium on calcium (alumino)silicate hydrate
chemistry under equilibrium conditions. Cem. Concr. Res. 2015, 68, 83–93. [CrossRef]
51. Bernard, E.; Lothenbach, B.; Cau-Dit-Coumes, C.; Pochard, I.; Rentsch, D. Aluminum incorporation into magnesium silicate
hydrate (M–S–H). Cem. Concr. Res. 2020, 128, 105931. [CrossRef]
52. Roosz, C.; Grangeon, S.; Blanc, P.; Montouillout, V.; Lothenbach, B.; Henocq, P.; Giffaut, E.; Vieillard, P.; Gaboreau, S. Crystal
structure of magnesium silicate hydrates (M–S–H): The relation with 2:1 Mg–Si phyllosilicates. Cem. Concr. Res. 2015, 73, 228–237.
[CrossRef]
53. Marty, N.C.M.; Claret, F.; Lassin, A.; Tremosa, J.; Blanc, P.; Madé, B.; Giffaut, E.; Cochepin, B.; Tournassat, C. A database of
dissolution and precipitation rates for clay-rocks minerals. Appl. Geochem. 2015, 55, 108–118. [CrossRef]
54. Marty, N.M.; Bildstein, O.; Blanc, P.; Claret, F.; Cochepin, B.; Gaucher, E.; Jacques, D.; Lartigue, J.-E.; Liu, S.; Mayer, K.U.; et al.
Benchmarks for multicomponent reactive transport across a cement/clay interface. Comput. Geosci. 2015, 19, 1–19. [CrossRef]You can also read


