Structural Color from Solid-State Polymerization-Induced Phase Separation
←
→
Page content transcription
If your browser does not render page correctly, please read the page content below
Structural Color from Solid-State Polymerization-Induced Phase Separation

                                                              Alba Sicher1,2 , Rabea Ganz1 , Andreas Menzel3 , Daniel Messmer4 , Guido Panzarasa1 , Maria
                                                             Feofilova1 , Richard O. Prum5 , Vinodkumar Saranathan6 , René M. Rossi2∗ , Eric R. Dufresne1∗

                                                         1
                                                          Laboratory for Soft and Living Materials, Department of Materials, ETH Zürich, 8093 Zürich, Switzerland.
                                                                                 2
                                                                                   Laboratory for Biomimetic Membranes and Textiles, Empa,
                                                                Swiss Federal Laboratories for Materials Science and Technology, 9014 St. Gallen, Switzerland.
                                                                        3
                                                                          Paul Scherrer Institut, Forschungsstrasse 111, 5232 Villigen PSI, Switzerland.
                                                            4
                                                              Laboratory of Polymeric Materials, Department of Materials, ETH Zürich, 8093 Zürich, Switzerland.
                                                     5
                                                       Department of Ecology and Evolutionary Biology and the Peabody Museum, Yale University, New Haven, CT 06520.
                                                                  6
                                                                    Division of Science, Yale-NUS College, 10 College Avenue West, 138609, Singapore. and
                                                                                                                   ∗
arXiv:2101.11345v2 [cond-mat.soft] 28 Jan 2021

                                                                                                     (Dated: January 29, 2021)

                                                                  Structural colors are produced by wavelength-dependent scattering of light from nanostructures.
                                                               While living organisms often exploit phase separation to directly assemble structurally colored ma-
                                                               terials from macromolecules, synthetic structural colors are typically produced in a two-step process
                                                               involving the sequential synthesis and assembly of building blocks. Phase separation is attractive for
                                                               its simplicity, but applications are limited due to a lack of robust methods for its control. A central
                                                               challenge is to arrest phase separation at the desired length scale. Here, we show that solid-state
                                                               polymerization-induced phase separation can produce stable structures at optical length scales. In
                                                               this process, a polymeric solid is swollen and softened with a second monomer. During its polymer-
                                                               ization, the two polymers become immiscible and phase separate. As free monomer is depleted, the
                                                               host matrix resolidifies and arrests coarsening. The resulting PS-PMMA composites have a blue
                                                               or white appearance. We compare these biomimetic nanostructures to those in structurally-colored
                                                               feather barbs, and demonstrate the flexibility of this approach by producing structural color in
                                                               filaments and large sheets.
                                                               Keywords: phase-separation, polymerization, structural color, biophotonic, biomimetic

                                                    In conventional dyes and pigments, color is encoded                are much smaller than the characteristic scale of the
                                                 in the electronic structure of molecules. In structurally             final structure. In structurally-colored bird feather
                                                 colored materials, color emerges from the interference                barbs, phase separation is triggered by the supra-
                                                 of light scattered from sub-micron variations in the re-              molecular polymerization of cytoplasmic β-keratin into
                                                 fractive index [1–5]. Since a wide spectrum of structural             filaments [27, 28]. Phase separation is ultimately
                                                 colors can be made by different nanostructures with the               arrested by intermolecular cross-linking by disulfide
                                                 same chemical composition [6–8], structural color has                 bonds, leaving stable nanostructures composed of air
                                                 the potential for more sustainable color production.                  and cross-linked protein. These structures come in two
                                                    Colloidal processing and block-copolymer assembly                  characteristic morphologies: dense packings of monodis-
                                                 have emerged as leading methods to produce synthetic                  perse air bubbles or bi-continuous networks of channels
                                                 structurally colored materials [9–26]. In all these cases,            [6]. These composites have pronounced short-range or-
                                                 the characteristic length scale of the final structure is             der, and reflect a narrow band of wavelengths [4, 29–31].
                                                 determined by the size of its building block. The fabri-                 Recently, scientists have begun to exploit phase
                                                 cation process involves two distinct steps: the synthesis             separation to spontaneously form photonic structures.
                                                 of building blocks and their subsequent assembly. Syn-                Strongly white networks have been obtained from
                                                 thesis and assembly typically have contradictory phys-                quenching polymer-solvent mixtures [32], and thin
                                                 ical and chemical parameters, necessitating additional                structurally-colored films have been produced in an im-
                                                 processing and purification steps between them. For ex-               miscible polymer blend through a 2D phase-separation
                                                 ample, synthesis requires a low volume fraction of par-               process triggered by the evaporation of a co-solvent [33].
                                                 ticles, while assembly requires a high one.                           Structural colors have also been observed in gels of a sin-
                                                    In contrast, living systems construct photonic struc-              gle polymer, formed by polymerization-induced phase
                                                 tures directly from macromolecules, whose dimensions                  separation [34].
                                                                                                                          Here, we produce structural colors by polymerization-
                                                                                                                       induced phase separation (PIPS) in the solid state.
                                                                                                                       Starting with a solid block of uncrosslinked polystrene
                                                 ∗   Email: rene.rossi@empa.ch, eric.dufresne@mat.ethz.ch              (PS) swollen with methyl methacrylate monomer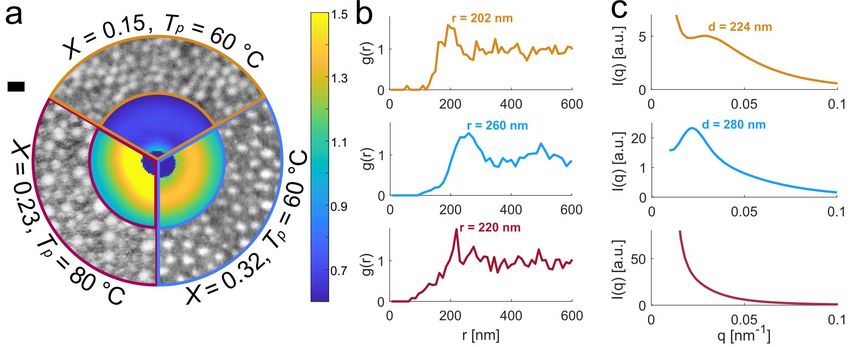
2
(MMA), we initiate free-radical polymerization and
subsequent phase separation. As monomer is depleted
from the system, the matrix re-solidifies, arresting the
coarsening process. This biologically-inspired process
produces inclusions with a modest degree of short-range
order. The resulting materials have structural blue to
white appearances. We demonstrate the potential scal-
ability and versatility of solid-state PIPS by making
large structurally colored films and filaments.
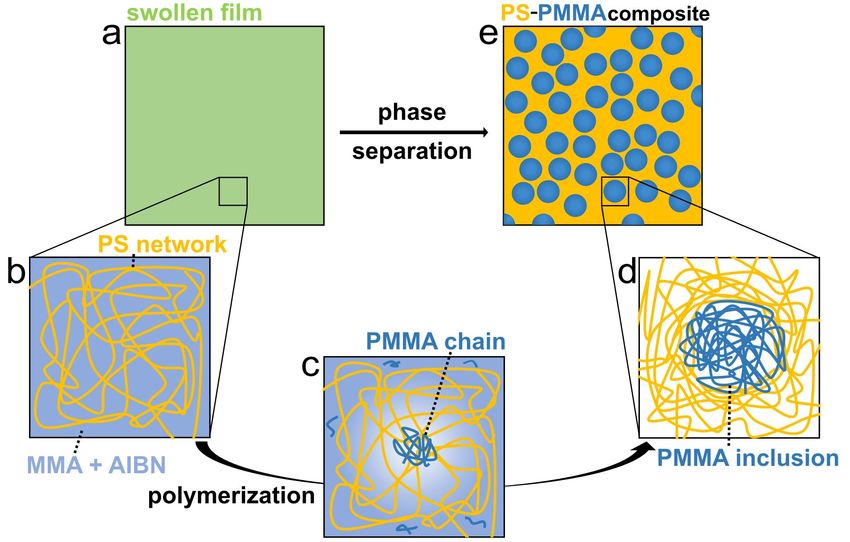
Figure 1. Solid-state polymerization-induced phase separa- Figure 2. Solid-state polymerization-induced phase separa-
tion. Schematic describing the process underlying arrested tion produces structural blue and white. a) Photographs of
phase separation in a bulk PS-PMMA composite. a,b) Mi- initially transparent PS (X = 0) and three samples with
croscopic and macromolecular views of the initial state. PS increasing PMMA fraction (X = 0.14, 0.21, 0.38) after
is swollen with a mixture of monomer (MMA) and thermal polymerization-induced phase separation at 70 ◦ C. b) In-
initiator (blue). PS chains are represented in yellow. In (a), tensities as a function of wavelength, I(λ), from reflectivity
blue and yellow are mixed (green). c) Polymerization starts measurements of blue, light blue and white samples. Insets:
and the solubility of the growing poly(methyl methacrylate) photographs of the corresponding samples on a black back-
(PMMA) chains drops. PMMA chains are marked in dark ground. The PMMA fraction of each sample is reported.
blue. PMMA nclusions start to nucleate and grow, depleting Dashed line: I ∝ λ−4 , a Rayleigh scattering fit to long wave-
monomer in the surrounding region. d,e) Macromolecular lengths of sample 1.
and microscopic views of the final structure. As PMMA in-
clusions grow and MMA is depleted, the PS network around
the nuclei shrinks and stiffens. This arrests the phase sepa- and the matrix stiffens. Solidification of the matrix sup-
ration at optical length scales.
presses coarsening, and produces stable far-from equi-
librium micro-phase-separated structures (Figure 1d,e).
Our process is schematized in Figure 1. First, These micro-phase separated composites appear ei-
we swell transparent polystyrene (PS) with methyl ther blue or white depending on the synthesis parame-
methacrylate (MMA) and a thermal initiator (2,2’- ters used. Generally, as the fraction of PMMA increases
Azobis(2-methylpropionitrile) (AIBN)) (Figure 1a,b). in the sample, its appearance evolves from transparent,
To fix the quantity of monomer and initiator, PS films to blue, to white (Figure 2a). We quantify the mo-
equilibrate overnight in a solution of a ethanol, MMA lar fraction of PMMA in the samples with 1 H nuclear
and AIBN. While uncrosslinked PS completely dissolves magnetic resonance (NMR) spectroscopy, and we define
in a solution of MMA and AIBN, ethanol is a bad sol- it as X = cPMMA /(cPMMA + cPS ), where cPMMA and
vent for PS. The final concentration of MMA in the cPS are the concentrations of polymerized MMA and
PS is tuned from 1 to 40 %wt changing the concen- styrene, respectively. The final mole fraction of poly-
tration of MMA in ethanol from 12 to 41 %wt. Then, merized monomer, X, depends on the concentration of
we initiate polymerization by placing the samples, still MMA used, as well as the polymerization temperature,
in their bath of swelling fluid, into an oven at a target and ranges from ≈ 0.1 to ≈ 0.4 in these experiments
polymerization temperature, Tp , from 60 to 80 ◦ C. As (Table I).
poly(methyl methacrylate) (PMMA) chains grow, their To quantify the appearance of the samples, we mea-
solubility is reduced, favoring phase separation (Figure sure the diffuse reflectivity of 1 mm thick samples using
1c). As polymerization proceeds, monomer is depleted an angle-resolved spectrophotometer. We measure the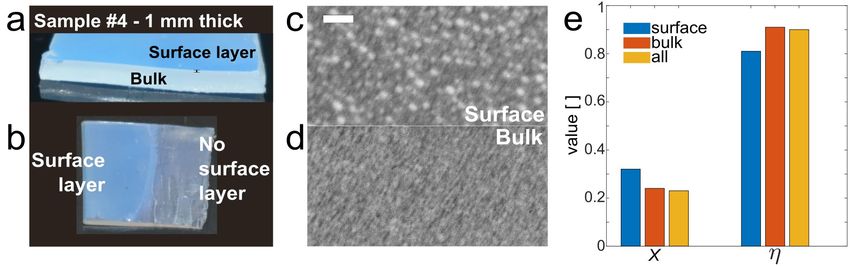
3

                       Sample name       X      η %v   MMA Tp [◦ C] tp    [min]     Figure
                       Blue             0.14   0.85    30    70            90             2a
                       Light Blue       0.21   0.91    35    70            90             2a
                       White            0.38   0.96    45    70            90             2a
                       #1               0.15   0.67    40    60            90       2b, 4a-c
                       #2               0.32   0.82    45    60            90   2b, 4a-c, 5b
                       #3               0.23   0.97    40    80            90       2b, 4a-c
                       #4               0.20   0.89    40    60            90     3a-e, 6a,c
                       Black PS           /      /     30    60            90             6b
                       Fiber              /      /     35    60            90             6d

Table I. List of all the samples, their compositions and their synthesis parameters: X = molar fraction of PMMA in
the sample, η = monomer conversion, %v MMA = percentage of methyl methacrylate in solution, Tp = polymerization
temperature, tp = polymerization time, PS = polystyrene.

spectra as close as possible to the backscattering direc-   a polymer. In Figure 3e, we see that the monomer con-
tion, at an angle θ = 15° between the direction of illu-    version is lower in the surface than in the bulk. We hy-
mination and detection. In Figure 2b, we compare the        pothesize that the structural difference between surface
normalized intensities as a function of wavelength, I(λ),   and bulk arises during polymerization. As monomer is
for samples with different molar fractions of PMMA.         depleted in the sample, it can be replenished by the
In all cases, the diffuse reflectivity of the samples de-   surrounding reservoir of monomer. The competition
creases monotonically with wavelength across the vis-       of monomer diffusion and polymerization kinetics de-
ible spectrum. This qualitatively resembles Rayleigh        fines a boundary layer where monomer is steadily re-
scattering. Indeed, the longest wavelengths at the low-     plenished during polymerization. This simple picture
est polymer fractions, X ≤ 0.20, are reasonably well-fit    qualitatively captures the complementary increase of X
by the expected λ−4 scaling, as shown by the dashed         and decrease of η in the surface layer.
line in Figure 2b. However, all samples show an excess         To determine how the morphology of the surface layer
of reflectivity beyond this Rayleigh background. The        affects the optical properties of the material, we ap-
reflectivity increases as the blue colors fade into white   plied both scanning transmission electron microscopy
at higher PMMA-fractions. For samples polymerized at        (STEM) and small angle X-ray scattering (SAXS).
higher temperatures (Sample 3, X = 0.23), white color       STEM shows how the size, spacing and polydispersity
appears at lower PMMA-fractions, as shown in Figure         of inclusions depend on the synthesis parameters. In
2 and in Figure S1. Figure S2 shows that the color is       the outer ring of Figure 4a, we compare STEM images
angle-independent.                                          of three samples with different PMMA fractions and
   Color originates from scattering within the first ≈      processing temperatures. To quantify the differences in
150 µm from the surface of the samples. We can see          these images, we locate the centroid of each particle,
this macroscopically by looking at the cross-section of     and calculate the pair-correlation function, g(r), shown
a sample (Figure 3a), or by removing the surface layer      in Figure 4b. All samples show anti-correlation at short
from the rest of the sample by mechanical abrasion (Fig-    spatial scales, presumably due to competition between
ure 3b). Electron microscopy reveals that the structure     the PMMA nuclei for free polymer. Additionally, the 60
near the surface is distinct from the structure in the      ◦
                                                              C samples show a distinct peak in g(r) at separations
bulk. Figure 3c and d show scanning transmission elec-      of 202 nm and 260 nm, with modest peak correlation
tron micrographs (STEMs) with the same field of view        values of 1.50 and 1.54 respectively. The other sam-
4 × 2 µm2 acquired 25 and 270 µm from the surface of        ple, processed at 80 ◦ C, shows a hint of a short-ranged
the same X = 0.20 sample. Near the surface, we find         positive correlation near the same location, but suffers
a solid dispersion of PMMA spheres, about hundred           from limited statistics. Note that these g(r)’s are ob-
nanometers in diameter. In the bulk, we do not observe      tained from 2D sections of a 3D materials, and provide
any phase-separated domains at this length-scale.           a limited view of the translational order in the samples.
   We quantify the compositional difference between            Scattering methods precisely quantify 3D structural
the surface and bulk using NMR. As shown in Fig-            correlations and provide better statistics by averag-
ure 3e, there is an increase in the mole fraction of        ing over a much larger sample volume. The inner
PMMA, X, at the surface relative to the bulk of the         ring of Figure 4a shows a sector of these three sam-
sample. We also define the monomer conversion as            ples’ isotropic SAXS patterns, aligned at q = 0. The
η = cPMMA /(cMMA + cPMMA ), where cMMA and cPMMA            full scattering patterns can be found in Figure S3.
are the molar concentrations of free MMA and MMA in         Azimuthally-averaged scattering profiles are shown in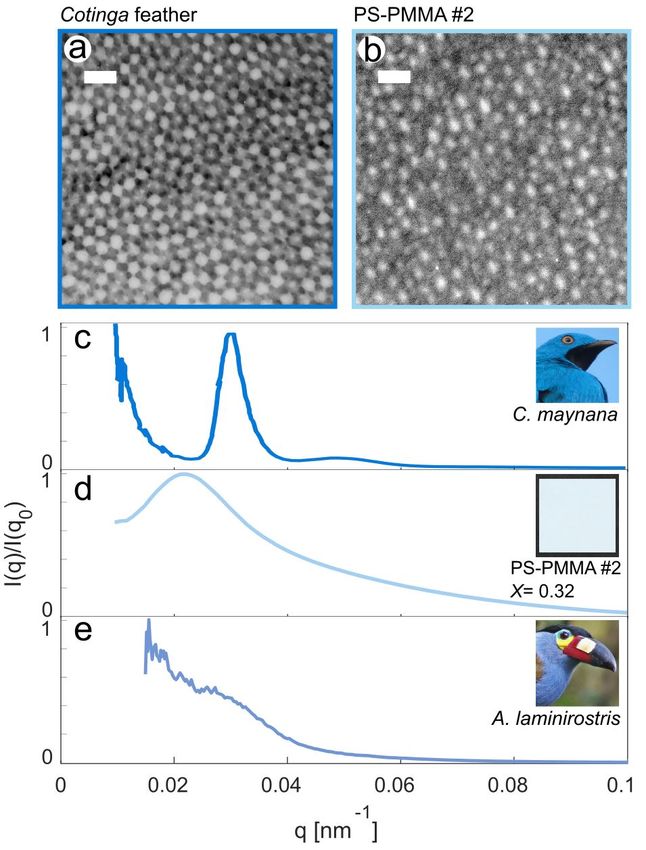
4

Figure 3. Color originates in a surface layer. a) Photograph of a blue sample (Sample 4, X = 0.20) in cross-section. b)
Photograph of the same sample with the surface layer removed on the right side. c,d) STEM bright-field images of the
sample near the surface and in the bulk. Scale bar: 500 nm. e) PMMA fraction and monomer conversion of the sample
measured by NMR at the surface, bulk and overall.

Figure 4. Structural characterization of phase-separated samples. a) Comparison of three samples with different PMMA
fractions, X, and polymerization temperatures, Tp , as indicated. Outer ring: bright-field STEM images taken in the
structured surface layer. Inner ring: sections of SAXS patterns. The dark blue feature in the center is the beamstop. On
the right: color bar for the SAXS patterns. The scale bar on the left corresponds to 300 nm for the STEM images and
0.009 nm−1 for the SAXS patterns. b) Pair correlation functions, g(r), calculated from particle locations extracted from
the STEM images in (a). c) Azimuthal averages calculated from the 2D SAXS patterns in (a).

Figure 4c. While the 60 ◦ C samples show modest              face (Figure 4b). This suggests that even though the
peaks at q = 0.028 nm−1 (Sample 1, X = 0.15) and             X-ray beam travels across the entire sample, the scat-
q = 0.022 nm−1 (Sample 2, X = 0.32), the higher tem-         tering is dominated by the same near-surface structures.
perature sample shows no significant features across the
                                                                Together SAXS and STEM show weak structural cor-
probed region of the spectrum. The peak is stronger for
                                                             relations in the samples polymerized at 60 ◦ C, dom-
Sample 2 (X = 0.32), whose reflectivity showed a larger
                                                             inated by the spacing between the PMMA particles.
deviation from Rayleigh scattering compared to Sample
                                                             Structures formed at higher temperatures consistently
1 (X = 0.15) (Figure 2). The peak in the SAXS spectra
                                                             show higher polydispersity (Figure S4) and no struc-
of the 60 ◦ C samples correspond to length scales (d) of
                                                             tural correlations. This reflects a broadened molecu-
224 and 281 nm, similar to the location of the peaks in
                                                             lar weight distribution by free-radical polymerization
g(r) calculated from TEM images near the sample sur-
                                                             at higher temperatures, [35–37].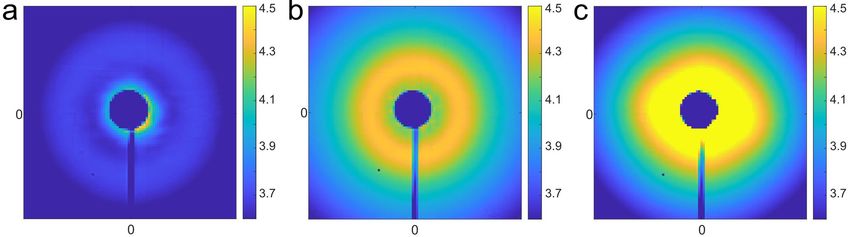
5

                                                                more ordered than others [6]. For example, the SAXS
                                                                scattering spectrum from the nanostructures underlying
                                                                the blue-gray feather barbs of Andigena laminirostris
                                                                shows only a subtle sholder on a broad background, as
                                                                shown in Figure 5f.
                                                                   Previous work on structure-property relationships in
                                                                the color of bird feathers [4] has shown that a sharp
                                                                peak in the SAXS specturum at qmax leads to a nar-
                                                                row band in the back-scattering reflection spectrum,
                                                                centered on λmax , with λmax = 4πne /qmax where ne
                                                                is the effective refractive index of the composite. For
                                                                bird feathers, ne is about 1.265 [6]. Thus, the sharp
                                                                structural correlations of C. maynana produce a vivid
                                                                color at λmax ∼ 520 nm. The effective index of the
                                                                PS-PMMA samples can be estimated from the fraction
                                                                of PMMA as well as the refractive indices of the two
                                                                phases, nPS = 1.57 and nPMMA = 1.48. Using the
                                                                Maxwell-Garnett approximation [12, 38], we find effec-
                                                                tive indices ranging from 1.53 to 1.56. Applying this
                                                                analysis, we might expect structural correlations in PS-
                                                                PMMA Sample 2 to produce some excess scattering over
                                                                a broad-range of wavelengths in the near infra-red from
                                                                about 830 to 930 nm. However, this is overwhelmed by
                                                                a broad Rayleigh-like background, as shown in Figure
                                                                2.
                                                                   Our PS-PMMA samples are translucent. Therefore,
                                                                their color is more evident on a dark background than
Figure 5. Biological and bio-inspired photonic structures. a)   on a light background, as shown clearly in Figure 6a.
TEM image of the photonic structure in the feather barbs of     We can mitigate this effect by incorporating a low con-
Cotinga maynana. b) STEM image of the photonic structure        centration of broadband absorber into the composite
in Sample 2. The images in (a) and (b) have the same field      [12]. Figure 6b shows a sample where the same phase
of view. For both the scale bar is 500 nm. c) Azimuthally-
                                                                separation process was executed in a commercial black
averaged SAXS spectra, I(q), from the feathers of Cotinga
maynana. Inset: C. maynana (image in the public domain).        polystrene sample. With this built-in absorption, the
d) I(q) from Sample 2. Inset: photo of Sample 2 on a            dependence of the appearance on the background dis-
black background. e) I(q) from the feathers of Andigena         appears.
laminirostris. Inset: A. laminirostris (image in the public        Structural colors based on thin films or coatings with
domain).                                                        specific thickness can be challenging to apply to curved
                                                                surfaces and large areas. Our approach to polymeriza-
                                                                tion induced phase-separation is easy to apply to a wide
   We compare our PS-PMMA structures formed by                  variety of sample geometries. As a proof of concept, we
polymerization-induced phase separation to some of the          show that our process can create larger structurally col-
natural photonic structures which inspired them in Fig-         ored sheets (Figure 6c) and fibers (Figure 6d).
ure 5. Electron micrographs of the color-producing                 In conclusion, we show that it is possible to produce a
air-keratin structures in the vibrant blue-green feather        structurally colored material based on solid-state phase
barbs of Cotinga maynana are shown alongside a PS-              separation driven by free-radical polymerization. While
PMMA sample (Sample 2, X = 0.32) in Figure 5a,b.                the resulting structures are stable and have the appro-
Both materials show approximately spherical inclu-              priate length scale, they are too disordered to reflect
sions. The inclusions in the feathers, however, are more        a narrow range of wavelengths. The palette of struc-
uniform and more closely packed. Together, this leads           tural colors is currently limited to blue and white, nev-
to much stronger structural correlations, as demon-             ertheless this approach offers many potential benefits.
strated by a sharp peak in their SAXS spectrum, shown           First, in contrast to most self-assembly strategies, phase
in Figure 5c. For comparison, the scattering spectrum           separation processes can generate well-defined super-
of the PS-PMMA sample is shown in Figure 5d. It fea-            molecular structures in a single step. Second, solid-
tures a much broader peak at smaller q. While our the           state polymerization-induced phase separation is inher-
order of our biomimetic samples falls short of the most         ently self-limiting. As monomer is consumed, the ma-
vibrant structurally colored feather barbs, they are            trix hardens and arrests coarsening. Third, photonic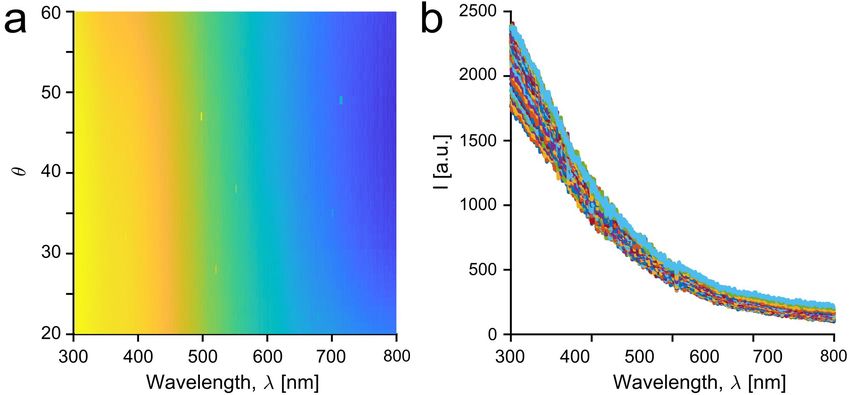
6

Figure 6. Color in samples of different size and geometry. a) A blue phase-separated sample formed from transparent
PS (Sample 4, X = 0.20) across a white and a black background. Left vertical side of the sample: 1.5 cm. b) A blue
phase-separated sample formed from black PS across a white and a black background. The color exhibits no background
dependence. Left vertical side of the sample: 1 cm. c) A blue phase-separated sample about ∼ 20 cm2 . c) A blue
phase-separated fiber. Diameter: 1 mm.

nanostructures can be easily incorporated into a wide       with a layer of general purpose polystyrene (GPPS).
variety of sample geometries. Finally, this physical ap-    Product code: 5701. Phase separation happened in the
proach to arrest phase separation should extend to a        GPPS layer.
wide range of chemistries. We expect that this process      Fabrication of the structurally colored composites.
can be extended to any pair of immiscible polymers,         Methyl methacrylate 99% from Sigma-Aldrich (CAS:
where one monomer is a good solvent for the second          80-62-6) containing monomethyl ether hydroquinone
polymer.                                                    as inhibitor was purified through filtration in a chro-
   In order to achieve a broader range of more saturated    matographic column containing an inhibitor remover
colors, as found in bird feathers, we need to achieve       from Sigma-Aldrich (Product code: 311332). The
stronger structural correlations. Free radical polymer-     monomer was mixed with ethanol 96% (Sigma-Aldrich,
ization provides little control of the polymerization ki-   CAS:64-17-5) and a thermal free radical initiator, 2,2’-
netics. In solution, it is well known to create a very      Azobis(2-methylpropionitrile) >98% (Sigma-Aldrich,
broad distribution of chain lengths. By contrast, living    CAS:78-67-1).      The ratio between monomer and
radical polymerization methods (such at atom transfer       initiator was fixed to 0.25 g AIBN in 10 ml MMA.
radical polymerization (ATRP) or reversible addition        The volume concentration of MMA in ethanol varied
fragmentation chain transfer (RAFT)) provide tight          between 35% and 50%. Transparent polystyrene films
control of the polymerization process and yield narrow      or fibers were then soaked into the solutions and left
molecular weight distributions [39, 40]. By adapting        to equilibrate for at least 24 h in a container with a
these chemistries to the solid state, we expect that we     sealed cap. The container was then put in the oven
can gain sufficient control of the nucleation and growth    (VWR, Venti-Line) at the desired Tp for 90 min. After
process to produce structures with more sharply defined     the phase separation occurred, the containers were
length-scales, and tunable, saturated colors.               removed from the oven and the samples extracted
                                                            from the solution, dried with towel and left on a glass
                                                            substrate at room temperature over night.
           EXPERIMENTAL SECTION                             Reflectivity measurements. The samples were mounted
                                                            on a stage and illuminated using an optical fiber
   Preparation of the transparent PS samples.               with collimated white light from a DH-2000-BAL
Polystyrene pellets, average Mw ∼ 280, 000 Da               Deuterium-Halogen Lightsource from Ocean Optics.
(CAS: 9003-53-6) were purchased from Sigma-Aldrich.         The incident light was normal to the sample surface.
They were dried in vacuum at 60 °C overnight in a           The size of the illuminated spot could be tuned using
Binder Vacuum drying oven, and either hot-pressed           an aperture placed between the collimating lense at
into films of thickness 1 mm using a Fontune Holland        the surface of the optical fiber and the sample, and
table press, or extruded into fibers with a Dr. Collin      it was set to ∼ 3 mm in diameter. A detector was
GMBH extruder. Pressing parameters: 205 °C for 5            positioned at 15° from the direction of illumination.
min, 40 kN. Extrusion parameters: 200 °C, 3 rpm. The        The detector consisted of an aperture, a collecting lens
films or fibers were then cut into pieces and annealed in   and a second optical fiber connected to a QE-Pro High
vacuum at 103 °C in the Binder oven to release stresses.    Performance Spectrometer from Ocean Optics. At the
The black polystyrene (1 mm thick) used in Figure 6b        start of the measurement, a reference spectrum of the
was used as purchased from Kitronik Ltd. The material       incident light was collected with no sample in place. A
consists of high impact polystyrene (HIPS) covered          spectrum with the light source turned off (dark noise)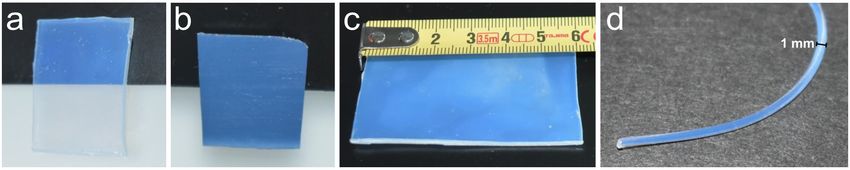
7

was also acquired. The reflectivity was calculated as     well as Maja Margrit Günthert and Joakim Reuteler
the ratio between the reflected intensity minus dark      (ScopeM, ETH Zurich) for their help with sample
noise and the reference spectrum minus dark noise.        preparation for STEM, Thomas Schweizer and Chris-
The plot of intensity as a function of wavelength was     tian Furrer for their help with fiber extrusion, Nicolas
smoothed with a moving average filter.                    Bain, Robert Style and Dominic Gerber for their help
NMR analysis. Sample material was dissolved in            with programming, and Kirill Feldman for his inspira-
chloroform-d >99.8% from Apollo Scientific (CAS:          tional skepticism and support with materials processing
865-49-6). 1 H-NMR measurements were performed            in the Laboratory of Soft Materials (Department of
using a Bruker UltraShield 300 MHz magnet, and            Materials, ETH Zurich). The authors acknowledge
analyzed using the software MestReNova. For the           the Paul Scherrer Institut, Villigen, Switzerland for
compositional analysis at different locations in the      provision of synchrotron radiation beamtime at the
same sample, the surface layer was removed from the       cSAXS beamline of the SLS. SAXS data on bird
sample using a razor blade, and the remaining material    feathers were collected with the help of Alec Sandy
along the sample thickness was considered to be the       and Suresh Narayanan at beam line 8-ID-I of the
bulk.                                                     Advanced Photon Source at Argonne National Labs,
STEM imaging. Thin sections of 60 nm were obtained        and supported by the US Department of Energy, Office
from the samples with a diamond knife (Diatome Ltd.,      of Science, Office of Basic Energy Sciences, under
Switzerland) on a Leica UC6 ultramicrotome (Leica         Contract No. DE-AC02-06CH11357.
Microsystems, Heerbrugg, Switzerland), and placed on
Formvar and carbon coated TEM grids (Quantifoil,
Großlöbichau, Germany). The sections were then
coated with 5 nm of carbon using a Carbon Evaporator                SUPPORTING INFORMATION
Safematic CCU-010. STEM analysis was performed
using a ThermoFisher (FEI) Magellan 400 electron
microscope. Electron micrographs of bird feathers were
acquired according to [27].
SAXS experiments. SAXS experiments on polymers
were performed at the cSAXS (X12SA) beamline at the
Swiss Light Source (SLS, Paul Scherrer Institut). Beam
energy: 13.6 keV, i.e. wavelength λ = 0.91 Å. The
intensities were recorded with a Pilatus 2M detector
(Paul Scherrer Institut). Sample-detector distance:
7.1 m. The wave number (q) range was 0.01˘1 nm−1 .
The beam diameter was approximately 300 µm. The
q range was calibrated using silver behenate. The
samples were taped to a metallic grid, so that the area
probed by x-rays was free standing. The measurements
occurred at several positions on the samples using 1
s exposure. SAXS experiments on bird feathers in
transmission geometry were collected at beamline 8-ID
at the Advanced Photon Source as described in [6].

             ACKNOWLEDGEMENTS

                                                          Figure S1. Sample color as a function of PMMA fraction
  Each author contributed to this work as follows:        (X) and monomer conversion (η). The colored area indi-
E.R.D. and R.M.R. initiated the project. A.S., E.R.D.,    cates the explored compositional space. Each ’x’ indicates
G.P., M.F., V.S. designed polymer experiments. A.S.,      the composition of a sample. Regions corresponding to dif-
A.M., D.M. and R.G. performed polymer experiments.        ferent colors are labelled.
A.S., E.R.D., A.M. and D.M. analyzed polymer data.
V.S. and R.P. designed, performed and analyzed all the
bird feather experiments. A.S. and E.R.D. wrote the
manuscript with input from all authors.
  We thank Hui Cao for helpful conversations, as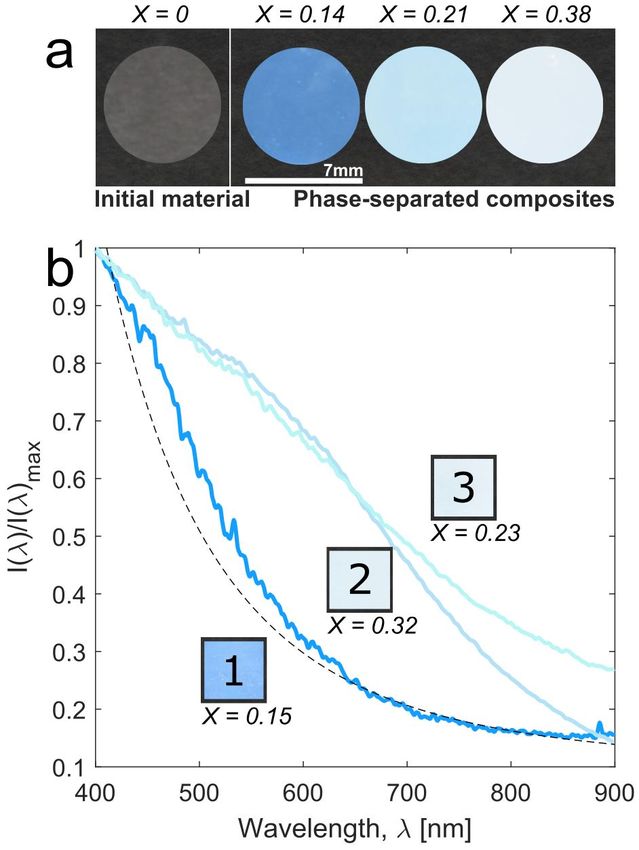
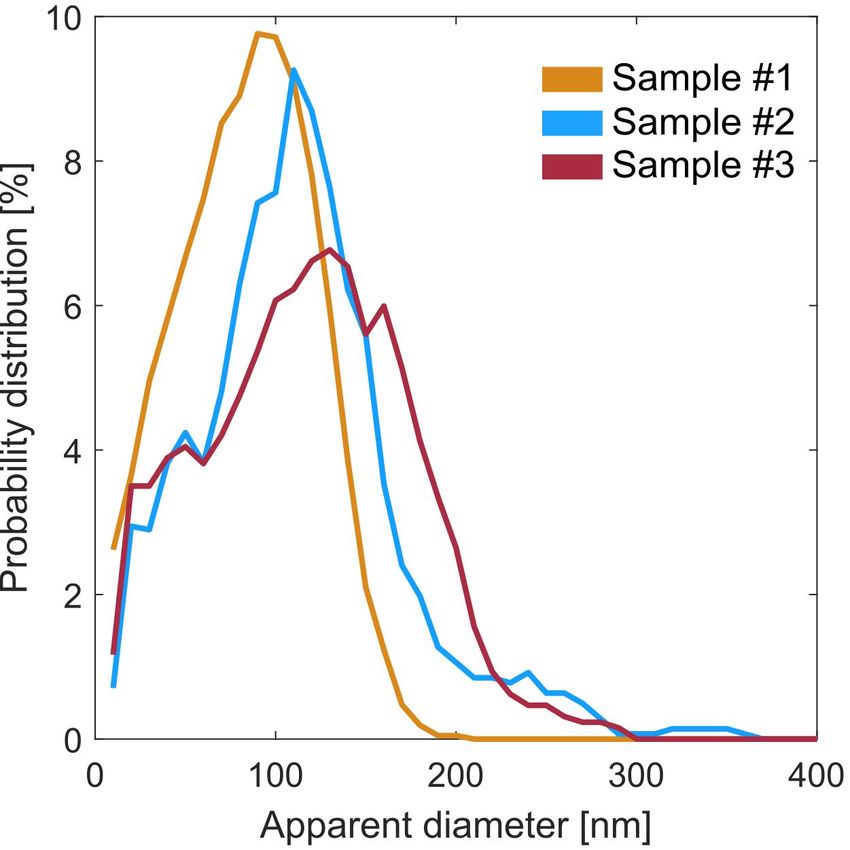
8

Figure S2. Angle-independent color. The color of the PS-PMMA composites is angle-independent. a) Logarithm of
the intensity as a function of wavelength and detection angle, θ. As θ increases, the intensity of the spectra at specific
wavelengths decreases slightly. On the right: color bar. b) The same spectra as a function of wavelength. The measured
intensity is reported on the vertical axis. Each line corresponds to a different detection angle θ.

Figure S3. SAXS patterns. Complete small-angle X-ray scattering patterns for samples a) #1, b) #2, and c) #3. The dark
feature in the middle is the beamstop. Each axis ranges from -0.05 to +0.05. On the right of each image: color bar.

Figure S4. Size distribution of PMMA inclusion. Probability distributions of the diameters of PMMA inclusions calculated
from the STEM images in Figure 4a for samples #1, #2 and #3. "Apparent" because the images section a 3D material
along a 2D plane, and this affects the perceived size distribution of the spherical inclusions.
9

 [1] A. R. Parker, Journal of Optics A: Pure and Applied              Fetters, J. D. Joannopoulos, Y. Fink, et al., Advanced
     Optics 2, R15 (2000).                                            Materials 13, 421 (2001).
 [2] A. R. Parker and N. Martini, Optics & Laser Technol-      [21]   S. Valkama, H. Kosonen, J. Ruokolainen, T. Haatainen,
     ogy 38, 315 (2006).                                              M. Torkkeli, R. Serimaa, G. ten Brinke, and O. Ikkala,
 [3] L. Rayleigh, The London, Edinburgh, and Dublin Philo-            Nature materials 3, 872 (2004).
     sophical Magazine and Journal of Science 37, 98 (1919).   [22]   B. M. Boyle, T. A. French, R. M. Pearson, B. G. Mc-
 [4] H. Noh, S. F. Liew, V. Saranathan, S. G. Mochrie, R. O.          Carthy, and G. M. Miyake, ACS nano 11, 3052 (2017).
     Prum, E. R. Dufresne, and H. Cao, Advanced Materials      [23]   M. Appold, E. Grune, H. Frey, and M. Gallei, ACS
     22, 2871 (2010).                                                 applied materials & interfaces 10, 18202 (2018).
 [5] S. F. Liew, J. Forster, H. Noh, C. F. Schreck,            [24]   M. Vatankhah-Varnosfaderani, A. N. Keith, Y. Cong,
     V. Saranathan, X. Lu, L. Yang, R. O. Prum, C. S.                 H. Liang, M. Rosenthal, M. Sztucki, C. Clair,
     O’Hern, E. R. Dufresne, et al., Optics express 19, 8208          S. Magonov, D. A. Ivanov, A. V. Dobrynin, et al., Sci-
     (2011).                                                          ence 359, 1509 (2018).
 [6] V. Saranathan, J. D. Forster, H. Noh, S.-F. Liew, S. G.   [25]   C.-S. Wu, P.-Y. Tsai, T.-Y. Wang, E.-L. Lin, Y.-C.
     Mochrie, H. Cao, E. R. Dufresne, and R. O. Prum,                 Huang, and Y.-W. Chiang, Analytical chemistry 90,
     Journal of The Royal Society Interface 9, 2563 (2012).           4847 (2018).
 [7] J. Zi, X. Yu, Y. Li, X. Hu, C. Xu, X. Wang, X. Liu, and   [26]   B. B. Patel, D. J. Walsh, D. H. Kim, J. Kwok, B. Lee,
     R. Fu, Proceedings of the National Academy of Sciences           D. Guironnet, and Y. Diao, Science Advances 6,
     100, 12576 (2003).                                               eaaz7202 (2020).
 [8] J. Teyssier, S. V. Saenko, D. Van Der Marel, and M. C.    [27]   R. O. Prum, E. R. Dufresne, T. Quinn, and K. Waters,
     Milinkovitch, Nature communications 6, 6368 (2015).              Journal of the Royal Society Interface 6, S253 (2009).
 [9] K. Nagayama, Colloids and Surfaces A: Physicochemi-       [28]   E. R. Dufresne, H. Noh, V. Saranathan, S. G. Mochrie,
     cal and Engineering Aspects 109, 363 (1996).                     H. Cao, and R. O. Prum, Soft Matter 5, 1792 (2009).
[10] P. Jiang, J. Bertone, K. S. Hwang, and V. Colvin,         [29]   R. O. Prum and R. H. Torres, in Excursions in Har-
     Chemistry of Materials 11, 2132 (1999).                          monic Analysis, Volume 2 (Springer, 2013) pp. 401–
[11] K. Matsubara, M. Watanabe, and Y. Takeoka, Ange-                 421.
     wandte Chemie International Edition 46, 1688 (2007).      [30]   R. O. Prum, S. Andersson, and R. H. Torres, The Auk
[12] J. D. Forster, H. Noh, S. F. Liew, V. Saranathan,                120, 163 (2003).
     C. F. Schreck, L. Yang, J.-G. Park, R. O. Prum, S. G.     [31]   R. O. Prum and R. Torres, Journal of Experimental
     Mochrie, C. S. O’Hern, et al., Advanced Materials 22,            Biology 206, 2409 (2003).
     2939 (2010).                                              [32]   J. Syurik, G. Jacucci, O. D. Onelli, H. Hölscher,
[13] C. E. Finlayson, C. Goddard, E. Papachristodoulou,               and S. Vignolini, Advanced Functional Materials 28,
     D. R. Snoswell, A. Kontogeorgos, P. Spahn, G. P. Hell-           1706901 (2018).
     mann, O. Hess, and J. J. Baumberg, Optics express         [33]   A. Nallapaneni, M. D. Shawkey, and A. Karim, Macro-
     19, 3144 (2011).                                                 molecular rapid communications 38, 1600803 (2017).
[14] D. Ge, L. Yang, G. Wu, and S. Yang, Journal of Ma-        [34]   N. Kumano, T. Seki, M. Ishii, H. Nakamura, and
     terials Chemistry C 2, 4395 (2014).                              Y. Takeoka, Angewandte Chemie International Edition
[15] Q. Xiang and Y. Luo, Polymer 106, 285 (2016).                    50, 4012 (2011).
[16] G. H. Lee, T. M. Choi, B. Kim, S. H. Han, J. M. Lee,      [35]   M. E. Sacks, S.-I. Lee, and J. A. Biesenberger, Chem-
     and S.-H. Kim, ACS nano 11, 11350 (2017).                        ical Engineering Science 28, 241 (1973).
[17] F. Fu, Z. Chen, Z. Zhao, H. Wang, L. Shang, Z. Gu,        [36]   J. Campbell, F. Teymour, and M. Morbidelli, Macro-
     and Y. Zhao, Proceedings of the National Academy of              molecules 36, 5491 (2003).
     Sciences 114, 5900 (2017).                                [37]   D. J. Walsh, D. A. Schinski, R. A. Schneider, and
[18] P. Han, X. He, Y. Zhang, H. Zhou, M. Liu, N. Wu,                 D. Guironnet, Nature communications 11, 1 (2020).
     J. Jiang, Y. Wei, X. Yao, J. Zhou, et al., Advanced       [38]   J. M. Garnett, Philosophical Transactions of the Royal
     Optical Materials 7, 1801749 (2019).                             Society of London. Series A, Containing Papers of a
[19] G. Shang, M. Eich, and A. Petrov, APL Photonics 5,               Mathematical or Physical Character 203, 385 (1904).
     060901 (2020).                                            [39]   J.-S. Wang and K. Matyjaszewski, Journal of the Amer-
[20] A. C. Edrington, A. M. Urbas, P. DeRege, C. X. Chen,             ican Chemical Society 117, 5614 (1995).
     T. M. Swager, N. Hadjichristidis, M. Xenidou, L. J.       [40]   K. Matyjaszewski, Advanced Materials 30, 1706441
                                                                      (2018).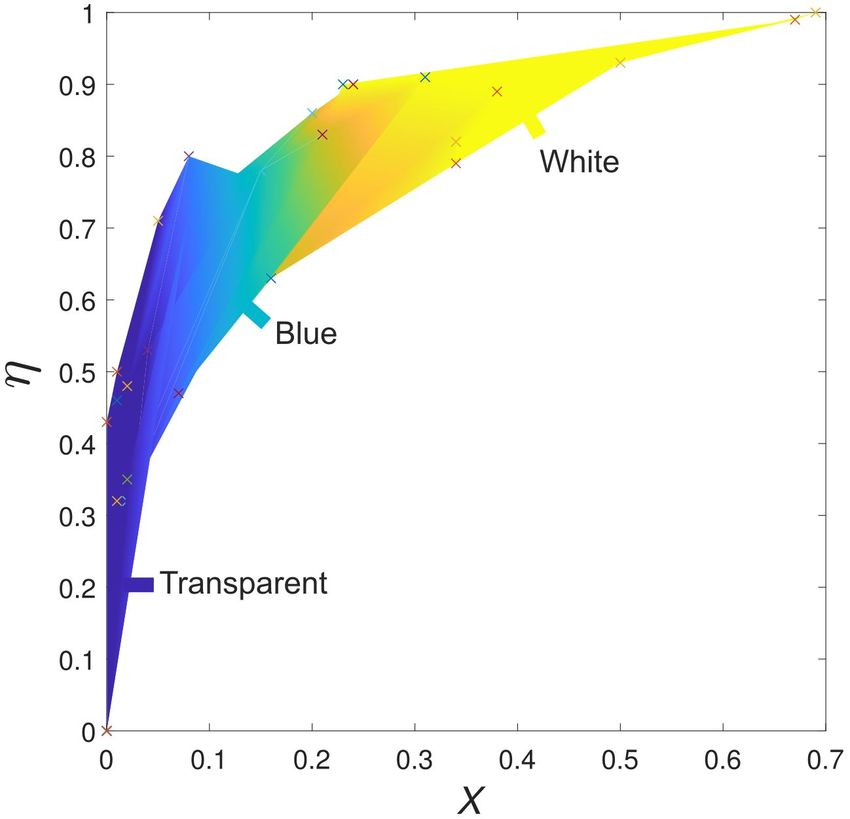
You can also read