Economic Networks with Incentives: The Mobile Money Case in Ecuador - University of Hawaii
←
→
Page content transcription
If your browser does not render page correctly, please read the page content below
Economic Networks with Incentives: The Mobile Money Case in Ecuador
       Ivan Rivadeneyra                            Daniel D. Suthers                        Ruben Juarez
      Dept. of Economics             Dept. of Information and Computer Sciences         Dept. of Economics
 University of Hawai’i at Manoa            University of Hawai’i at Manoa          University of Hawai’i at Manoa
     irivaden@hawaii.edu                          suthers@hawaii.edu                    rubenj@hawaii.edu

                      Abstract                              Ecuadorian economy, leading to the research question:
                                                            why didn’t the Ecuadorian MM project work?
This document analyzes the recent development of a               This article analyzes the development of different
Mobile Money (MM) project in Ecuador. Our work is a         economic networks from the MM project in Ecuador.
new perspective to MM literature. Using temporal            The main contribution is temporal analysis of real MM
analysis of network representations of MM                   transaction data to explain what happens when
transactions, we show how agents behave over time and       governments create alternative systems to increase
how they react when they are facing Government              liquidity in a small dollarized economy. Specifically, we
intervention. The Government in its eagerness to            describe how agents react over time when the
increase adoption gave tax incentives to non-cash users     Ecuadorian government intervenes with a new
that ended distorting the economic relations and had a      technological innovation, a MM monopoly, and how
modest effect in the diffusion of the new technology.       users respond to incentives interventions. We compare
                                                            these results with data from the Ecuadorian economy to
                                                            see whether the government fulfilled its objective. This
                                                            work also promotes the use of network analysis to
1. Introduction                                             understand the usage of new technologies in developing
                                                            countries.
     Mobile Money (MM) is an electronic tool that has            We begin with a brief literature review. Section 3
been gaining space in different economies of the world,     explains the data and identifies agents and incentives.
especially in developing countries for almost two           The methods section explains the steps that were taken
decades. It started in the middle of 2000s in the           to build the MM networks, and the metrics that we use.
Philippines and Tanzania, having its most prominent         Results are presented in section 5 followed by
case in Kenya with universal coverage, see Suri & Jack      discussion in section 6, with conclusions in section 7.
[27]. MM is an electronic account that allows users to
deposit, transfer and withdraw funds through their
mobile phones. MM has taken advantage of the fact that
                                                            2. Literature Review
with time more people are interconnected through their
cell phones. MM is not linked to a bank account, and the         The different characteristics of economies, the role
exchange rate of the virtual currency (e-money) and the     of the implementer, and various cases of use make it
local cash is one to one. Depending on the amounts and      difficult to generalize an explanation of the success of
transaction types, some transaction costs may appear.       MM deployments. For a comparison of five successful
     In Ecuador, the MM project was introduced in 2014      MM deployments to five less successful ones, see Lal &
by the Central Bank of Ecuador (CBE) as an alternative      Sachdev [17]. In our discussion section, we present the
to increase the means of payment in a dollarized            most relevant factors that explain successful cases and
economy with a shortage of liquid assets and to achieve     why they are different from the Ecuadorian case.
financial inclusion for almost 60% of the population that        A big part of our work tries to characterize the MM
currently does not have access to financial services. It    adoption process in Ecuador. In that sense, our work is
was the first attempt in the world of a mobile phone-       related to literature on the economic behavior of agents
based money that is managed, provided and monitored         when they start to use MM. The case of Kenya with M-
by the central government. (In Ecuador, the formulation     PESA has been well documented. Jack & Suri [13, 14],
of the monetary, credit, exchange and financial policy is   in these and later papers, document the patterns of
an exclusive faculty of the Central Government.) While      adoption of M-PESA over 2008-2014.
the project was in force, the central government tried to        The major advantages of MM as a technological
encourage the adoption of MM through tax incentives.        innovation are that people do not have to carry cash and
By the end of the project in December 2017 the initiative   that cash can be distributed and managed across vast
only accounted for 0.002% of the total liquidity of the     distances. Jack & Suri [14], demonstrate that one of the
most important uses of mobile money has been P2P account through macro-agents or using an ATM,
remittances. Also, Suri [26] showed that having a transfer money to other users or to users’ banking
widespread macro-agent network (the end distributors accounts (P2P), make purchases of goods and services
of the service) whose cash and e-money inventories are (B2C), and pay for services in Government institutions
well managed is crucial to the success of the product. (G2B). MM account users could withdraw cash money
Once adoption starts, a successful implementation will from their account through a macro-agent or using an
show strong network effects. The primary work ATM. All phone to phone economic relations were
documenting network effects in the adoption of MM is using SMS technology: the project operates on regular
Fafchamps et al. [7]. They used a database of mobile phones rather than smartphones.
phone usage to study network externalities as a way to The CBE guarantees that macro-agents had enough
continue to reinforce adoption for Rwanda. stock of e-money. The CBE could also have direct
Many of these works have reached their relationships with final users. Charges for usage comes
conclusions based on household surveys, but with the in the form of a tariff that depends on types and amounts
exception of [7], none of them have been documented of transactions [15]. Transactions do not consume air-
using real behavioral data for MM. The present work time balance or SMS messages from the cell phone
begins to fill this gap in two ways: by using actual account. The costs of operating the system with telecom
transaction data, which has advantages over survey data companies in Ecuador were assumed by the CBE.
in veracity and level of detail; and by using network This kind of e-money is different from
analysis, which enables us to observe the functioning of cryptographic currencies like Bitcoin. While
the whole economic system beyond aggregates of cryptographic currency is a digital signal that runs on a
individual behavior. Additionally, our work studies how decentralized electronic network, MM is controlled by
a centralized innovation technology did not reach the the Ecuadorian government and has a one to one relation
diffusion that was expected. The sharing of valuable with the US cash dollar. E-money is exchanged freely
information is at the heart of many important economic for physical money or vice versa.
processes in the diffusion of new technology: see [3, 4, Based on a dataset obtained from the Central Bank
6, 8, 9, 25]. We document structural features that make of Ecuador covering the entire MM implementation
it more difficult for information to spread throughout the from January 2015 to December 2017 (December 2014
network. was excluded due to lack of activity), this study
examines different kinds of economic networks and
3. The Ecuador Mobile Money Network computes multiple time-indexed metrics on them to
understand how users behave before and after the
The “Electronic Money Project”, as it was known government incentives. The methods behind this work
in Ecuador, was born with Regulation No. 055-2014 of are presented in section 4. Using official publications of
the Central Bank of Ecuador (CBE) for electronic Ecuador, we identified when the government put into
money [2], where it is specified that e-money can only effect tax incentives that sought to increase the use of
be issued by the CBE, thus creating the monopoly of MM but affected different economic relations between
MM in Ecuador. This is interesting if we consider the agents. Our objective is to measure over time how these
fact that Ecuador lost its ability to print money when in incentives affect these relations as represented by three
year 2000, after a severe economic crisis, it dollarized kinds of networks. A Transaction Network captures the
its economy. The project was introduced at the end of primary economic transactions of interest (purchasing
2014 as an attempt of giving liquidity to a dollarized items or services of value). The Exchange Cash-in and
economy and to provide people a simpler, faster, and the Exchange Cash-Out Networks represent users’
cheaper service to make financial transactions. The behavior of exchanging e-money for cash money and
system was open for natural persons (users) and legal vice versa. Finally, the Incentive Network records how
persons (companies): they just had to open a MM users are collecting the incentives.
account with their own IDs using their mobile phones.
The macro-agents were legal entities that could be 3.1. Data and Agent Types
private, public or mixed companies that had at least five
customer service points in their commercial chain. The data base was provided to us by the CBE as
Macro-agents can also be public institutions, financial multiple Excel files covering different temporal spans
institutions and organizations of the popular and from December 2014 to December 2017. It includes all
solidarity financial sector (sector that embraces social the cases of use that users, companies, macro-agents and
organizations such as cooperatives, mutual associations, the Central Bank made in the MM platform, from the
NGOs, etc.). Agent types are defined in the Regulation activation of an account, balance verification, cash
[2]. The service allows users to deposit money into their deposits to accounts, ATM withdraws, transfers,payments, etc., and all the bank reconciliation accounts and economics relations. This attempt to
accounting movements that must be done so that in the encourage the diffusion of e-money came in the form of
end each transaction is balanced. In the data every agent 2% refund of value-added tax (VAT) paid for
has an ID assigned by the CBE. Because of banking transactions that used e-money, and refund or
secrecy, the only agent characteristic provided is the compensation of 1% of VAT paid in the mobile money
description of account type. Table 1 has agent types account for transactions that used debit or credit cards
found in the data set and a brief explanation of each. [22]. The OLEPF not only granted tax refunds to those
who used electronic money in their transactions but also
Table 1. Agent Types to those who carry out transactions with credit or debit
Agent Types Explanation cards. The VAT paid at that time in Ecuador was 12%.
CO EP Public Company This law highlights the liquidity problem of the
CO PJ, CO PR, Private Company Ecuadorian economy and leaves financial inclusion as a
CO SPG secondary objective in the implementation of the MM
MA BANK Macro-agent Financial Institution project, since by giving the benefit to those who use
(MA - IFI INTEGRACION and credit or debit cards to make payments, the incentive is
MA - IFI WEB/EMPRESAS) excluding unbanked people.
MA CO Macro-agent Commerce Institution On May 20 of 2016, the Ecuadorian government
(MA CO -IFI INTEGRACION and
approved the Organic Law of Solidarity for the
MA CO - IFI WEB/EMPRESAS)
Reconstruction and Reactivation of the Affected Zones
MA CO EP Macro-agent Public Company
Persona Natural Natural person with tax ID by the Earthquake of April 16 of 2016 (OLSRRAZE).
(RUC) This law sought funds to rebuild and reactivate the areas
Persona natural Natural person who, due to the affected by the earthquake. The law increased the VAT
Obligada a llevar activities he/she performs, is from 12% to 14% for one year but kept the refund of 2%
contabilidad obliged to keep accounting records of VAT paid for transactions that used e-money [23].
Persona Natural User This measure reinforced the public interest to activate
(usuario) MM accounts now that they have to pay a higher VAT.
Remesedoras Money remittances companies With the establishment of a new government, the
Operator Central Bank of Ecuador Law of Economic Reactivation (LER) at the end of
SAP Public utility company (SAP, SAP December 2017 shut down the MM project, establishing
Tarifa Privada, and SAP Tarifa
that the Central Bank no longer was the exclusive
Publica)
administrator of the MM system and passing the project
to the private financial system [24]. The act gave agents
The Excel files were imported into a MySQL
until March 2018 to get zero balance on their MM
database for data consolidation and cleaning. Some
accounts. To do so, users can consume products in stores
manipulations were performed for purposes of our
that accept this type of payment, make withdrawals at
analysis. The data distinguishes how macro-agents are
ATMs, or transfer the balance to a regular bank or credit
connected to the CBE. Since our interest is to look for
union account.
relations between users and macro-agents, we merged
The interest generated by these decrees and the
macro-agents of the same type. Hence, MA BANK is
search for information about electronic money in
the union of financial macro-agents (MA) that were
Ecuador are positively related. The Google trend for
directly integrated with the electronic platform of the
searches in Ecuador that were made with the phrase
Central Bank (MA - IFI INTEGRACION) and financial
“dinero electronico” or electronic money provides
macro-agents that were connected through a web page
evidence of the effect of these laws on the general
that the Central Bank had set for them (MA - IFI
interest in this topic over time. Figure 1 (obtained from
WEB/EMPRESAS). The same criteria were used for
trends.google.com) shows that after the OLEPF in May
macro-agent companies: MA CO is MA CO -IFI
2016, the search for information about electronic money
INTEGRACION and MA CO - IFI WEB/EMPRESAS.
was at its highest peak.
Likewise, SAP represents all utility companies in our
network.
Figure 1: Google Trend for “Dinero Electronico” in
Ecuador
3.2. Government Incentives
The enactment of the Organic Law for Equilibrium
in Public Finances (OLEPF) in April 29 of 2016 marks
a before and after in the number of MM activated4. Methods data was exported from our SQL database into CSV files
representing agents and transactions along with
Network representations of the data have the attributes of both. These were read into R as data frames
advantage that structural metrics can be computed, that were then converted to igraph representations for
showing not only what typical agents are doing in further manipulation. We defined three networks in this
isolation but also how they are connected to each other. process. The Transaction Network, constructed from
Temporal analysis of the MM data shows how this payments or charges in exchange for goods or services,
behavior changes over time. The analysis involved specifically transactions of types “Pagos”, “Pago de
defining graphs on which the analysis would be servicios”, “Cobros”, “Cobro con IVA”, “Recargas”,
conducted, defining methods for selecting time slices, represents the kinds of exchanges MM is intended to
computing network metrics on monthly time slices, support. The Exchanges Cash-in Network consists of
plotting and examining metric trends over time and in cash-in relations that users have with the system: “Carga
relation to significant events, and interpreting trends in de dinero” and “Carga de dinero- cajero automatico”.
terms of the economic behavior of users. The Exchanges Cash-out Network is similar, with cash-
out relations “Descarga de dinero” and “Retiro de dinero
- cajero automatico”. The comparison of these two may
4.1. Graph Representations of Economic
give an indication of when users intend to move their
Networks primary economic activity to one or the other medium.
The Incentives Network consists solely of incentive
To define the nodes and links of our graph payments users receive for using electronic forms of
representations, we must be clear about how a payment: “Acreditacion masiva”. This can be used to
transaction is accounted for. Suppose that a macro-agent gauge the extent to which users are motivated by
wants to buy $1000 in e-money to have inventory to sell incentives to participate.
to users. This means that the macro-agent will give Each of these networks is represented as two kinds
$1000 in cash to the Central Bank, and in return the of graphs. In the multi-graph representation, there is a
macro-agent is going to get $1000 in e-money: the distinct edge (directed link) for each transaction that
macro-agent only changed the composition of its own takes place. This means that there may be many parallel
assets. For the Central Bank, cash liabilities increase in edges between any two given nodes. Each edge is
$1000 and e-money liabilities decreased by $1000, and annotated with the dollar amount of transaction
this transaction is balanced. If a user wants to withdraw (“weight” in igraph), date of transaction, and a
$100 from its own MM account through a macro-agent, description of the transaction type. The multi-graph
the same exchange logic applies: this is an increase in enables metrics that are on a per-transaction basis (e.g.,
the user’s assets by $100 in cash and a decrease of $100 average value in dollars per transaction, or number of
in e-money; for the macro-agent it is a decrease of $100 transactions a typical agent engages in). Then the multi-
in cash and an increase of $100 in e-money assets: every graph is transformed into a simple-graph representation,
actor’s assets in this transaction are balanced. These where all the edges between each pair of nodes are
actors are going to be our vertices or “nodes”, and each collapsed into one, summing the transaction values. The
edge or “link” between two vertices in the network simple-graph enables metrics that are on a per-agent
represents an accounting transaction of the virtual basis (e.g., average dollar value exchanged per agent),
currency. The amount of e-money transacted will be and is also used to compute various network-level
“weights” on the edges. (structural) metrics.
The previous accounting explanation was
considered without including any transaction cost, but
many of the transactions involve the payment of a fee 4.2. Temporal Analysis
for using the MM platform. The data in the Excel files
provided by the CBE included entries for transactions Transaction dates on the edges were used to
that pay the tariff to the Central Bank. If these fee construct time spans, which are graphs of the same type
transactions are included as links the network, the as discussed above but limited to transactions (edges)
network becomes dense with uninteresting relations. within a given time period [16]. We chose calendar
Since fee transactions are not our focus, we excluded months as the temporal unit of analysis, because a
them and selected other specific types of transactions of month is convenient to interpret, long enough to
interest for analysis. accumulate sufficient economic activity to construct
Graph representations and subsequent analysis and graphs large enough for the metric algorithms to apply,
plotting were constructed in the igraph package of the R and short enough to characterize how activity changed
programming and analysis environment. Transaction over time. In contrast, a period of one week might
produce graphs that are too variable due to events suchas holidays and too small for analyses intended for Figure 2: Transaction Network, April 2017
larger graphs; while a period of several months would
fail to localize the response to significant events. The
monthly analyses constructed a new graph for each
month. For example, if the month were 2017-04, all
edges with dates less than 2017-04-01 or larger than
2017-04-31 by lexicographic ordering were deleted (the
use of “31” handles all month lengths). We then deleted
nodes that had no incident edges in each given monthly
graph (“isolates”). The resulting graph most accurately
represents what actually happened in a given month, as
it has only nodes for active users and edges for
transactions that occurred, but plots over time must be
interpreted keeping in mind that the number of nodes
each month is changing.
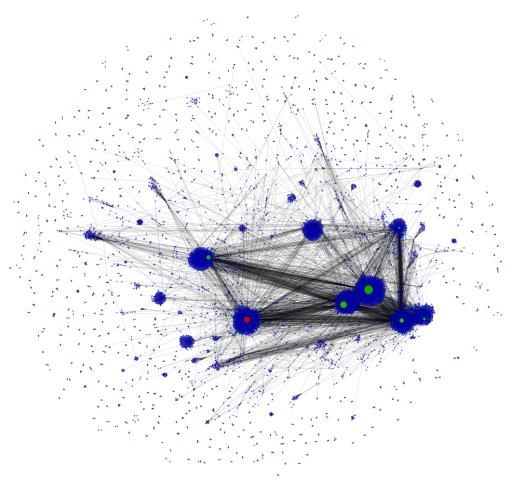
A visualization in Gephi of the transactions simple-
graph for a typical month in the incentives period (April
2017, 14907 active agents) is shown in Figure 2. Layout degree to low degree. Negative values are common
is by OpenOrd followed briefly by ForceAtlas 2 with No in social and economic networks where high degree
Overlap filter. Node size represents degree, and color nodes connect to low degree nodes.
represents agent type: blue for personal users, green for TypeAssort: Undirected nominal assortativity on agent
companies, red for macro agents, and black for the types: assortativity_nominal(multi, types,
central bank. We will refer to this figure below. directed=FALSE). Mathematically equivalent to the
above, except that the correlation is on categorical
(nominal) data. Positive assortativity indicates that
4.3. Metrics (for example) banks connect to banks, natural
persons to natural persons, etc. Negative
The following metrics were computed on each time assortativity indicates that banks connect to natural
span using the graph representation indicated (multi- persons, etc.
graph or simple graph). The expressions are the igraph Modularity: A measure of community structure based
code used to compute the metrics. See [21] for on the Louvain method of partitioning:
mathematical details. modularity(cluster_louvain(as.undirected(simp))).
Given a partition of the network, modularity
ActorCount: Number of actors in the time span: (Newman’s Q) indicates the extent to which edges
vcount(simp). connect within partitions greater than expected at
TransCount: Number of transactions in the time span: random [21]. The Louvain method is a heuristic
ecount(multi). approximation of the best possible partitioning
MeanTrans: Mean number of transactions per actor: under this metric. A high value on modularity
mean(degree(multi)). indicates that there is more “community structure”:
MeanPartners: Mean number of partners per person: nodes are connected in cohesive sub clusters.
mean(degree(simp)). CommCount: Count of Louvain communities:
MeanTransValue: Mean transaction value in dollars: length(cluster_louvain(as.undirected(simp))). This
mean(E(multi)$weight). indicates the number of clusters of distinct economic
MeanTotalValue: Mean value in dollars exchanged (in activity.
either direction) per person: mean(strength(simp)).
MeanLocalCC: Mean local clustering coefficient:
transitivity(simp, type="localaverage"). A measure 5. Results of Temporal Analysis
of what proportion of a node’s neighbors are
connected to each other, this indicates the extent to The plot for each metric shows the metric value on
which agents are clustered in mutually transactive the y axis, organized by months on the x axis. The x axis
groups, from the point of view of the typical agent. is labeled numerically for brevity; e.g., 2015-01 is
DegreeAssort: Undirected degree assortativity: month 1, 2015-02 is month 2, etc. Major economic
assortativity_degree(multi, directed=FALSE). This events are marked with vertical lines at the month in
metric ranges from 1 to -1, and is related to the which they occurred: the OLEPF in 2016-04 (month
Pearson correlation. Positive values mean that high 16), the OLSRRAZE in 2016-05 (month 17), and the
degree nodes connect to high degree nodes and low OLSRRAZE expires in 2017-05 (month 29).5.1 Transaction Network then, with the incentives, there is a new increasing trend
that stabilizes transactions per actor around 5.
The transaction networks included agents of types:
“BCE”, “CO EP”, “CO PJ”, “CO PR”, “CO SPG”, Figure 4: Partners and Transactions per Actor
“SAP”, “MA BANK”, “MA CO”, “MA CO EP”,
“Persona Natural (RUC)”, “Persona Natural Obligada a
llevar contabilidad” and “Persona Natural(usuario)”
(see Table 1 and associated discussion).
Figure 3 shows that every month more actors
(circles) are part of the real economics transaction
network once the OLEPF and OLSRRAZE are
effective. This graph has a peak of 22106 actors in
month 32 (August 2017), after the new government is in Also Figure 4 (circles) shows the mean number of
place and the discontinuation of the MM project is partners with which an actor is doing transactions. The
known. More actors started to make economic number of partners is small, on average around 2.4 after
transactions to use what they have left on their MM the laws. Agents do transactions with few other agents.
account, e.g. spending in stores. The number of actors After the laws, the mean transaction value is $11.3
who made real transactions is modest given that the in months 20-36 (diamonds, Figure 5). With 5.2 mean
Economically Active Population in Ecuador is transactions per actor per month after the laws and $11.3
approximately 8 million [11] and the ratio of people as the mean transaction value after the laws, the mean
with mobile phones is approximately 6 per 10 [12]. value exchanged per those actors who are active in any
Before the laws, few transactions were made given month is around $58.6 over time after incentives,
(diamonds, Figure 3), and there is an increase in the as seen in Figure 5 (circles). If we compare this value
number of real transactions after the laws. The network with cost of the basic consumption bundle in Ecuador
goes from almost no transactions to over 40000 that is around $700 in 2017, we can say that actors who
transactions per month in the last 10 months, peaking at are using this innovation did not even cover 10% of the
60572 transactions in month 32. When the balance of cost of the consumer basket, not achieving the
users’ MM accounts fall below the minimum that can be Government objective that e-money will be diffused
withdrawn from an ATM, users may be finding other more and more on a daily basis for Ecuadorian
ways to use the money such as small purchases in stores. consumption transactions. Figure 3 shows that in this
Actors that were removed as inactive from networks in network the number of actors and transactions
prior months become active as they conduct these small increased, but Figure 5 shows that economic activity in
transactions, leading to the peak visualized. Apparently, the network never grew enough to occupy a big
the objective of the laws is met; however, it will be proportion of the total transactions of the economy.
important to compare this result with the number of
Figure 5: Mean Transaction Values
transactions that users (on average) are doing per month
and the amount of these transactions.
Figure 3: Actor and Total Transaction Counts
Turning to the clustering coefficient, Figure 6 tells
us that the mean local clustering coefficient is moderate
and decreasing in time. (Although the clustering
The mean number of transactions per actor coefficient is expected to be very small in random
(diamonds, Figure 4) was increasing before the laws, graphs, most social networks have values orders of
reaching about 5.2 transactions per actor. This may be magnitude higher: see Table 8.1 and section 12.8 of
because more companies were entering in the network, [21].) If users are connected only with macro-agents and
so there were more places where people can use their are less focused on each other, as seen in the dense
MM. After the first year of life of the project, the mean collections around hubs in Figure 2, then few triangles
number of transactions per actor starts to decrease, and will form between users.Figure 6: Mean Local Clustering Coefficient 5.2 Exchanges Networks
These networks record actors putting money into
and taking money out from the MM system, explicitly
going to a macro-agent or through an ATM. We
constructed an Exchange Network for Cash-in and an
Exchange network for cash-out. The nodes participating
in In-Exchanges are of types "BCE", "BCE Cuentas
Transitorias", "CO PR", "CO SPG", "MA BANK",
Degree assortativity (diamonds in Figure 7) shows "MA CO", "Persona Natural (RUC)", "Persona
that early on there was no clear preference of attachment Natural(usuario)", "Remesadoras", and "SAP". Those
by degree, but then assortativity becomes negative as in Out-Exchanges are "BCE", "CO SPG", "MA
low degree nodes (typically representing individual BANK", "MA CO", "Persona Natural (RUC)", and
users) prefer to attach to high degree nodes such as "Persona Natural(usuario)".
companies, macro-agents and banks. This trend Figure 9 shows that the number of actors cashing in
stabilizes after enactment of the laws. Individual actors (circles) goes up slightly after the incentives are in place
connect primarily to hubs rather than to each other, but remains moderate, indicating low commitment to
reinforcing the conclusion from the clustering the MM system, and starts to go down before the
coefficient that networks of “small” actors are not a expiration of the OLSRRAZE. By that time users know
significant structural feature. In the same figure, the that the MM project will no longer will in place. Figure
slightly negative value in the nominal assortativity on 9 (diamonds) shows that there is rapid increase in actors
agent type (circles) tells us that agents connect to other cashing out after the incentives, and reaches its highest
agents of various types, with a nonrandom tendency for value in just 10 months, well above the first 20 months
natural persons to be connected to companies, macro- of the life of the project. Then, exchanges start to
agents and banks. decrease when OLSRRAZE expires. Probably at this
time many agents already have zero balance in their MM
Figure 7: Assortativity by Agent Type and Degree accounts. The spike at the end of the project likely
represents the remaining group of users who want to
cash-out before the project termination.
Figure 9: In and Out Exchanges Actor Count
Figure 8: Community Count by Louvain Method
The average number of agents that appear in each
network is consistently different: there are 2657 users
who cash-in every month in months 20-36 after the
incentives law, a modest number compared to an
The modularity of the partition by the Louvain average of 13070 during these months (peaking at
method stabilizes after the incentives laws around 0.81, 24682) who cash-out. This indicates a primary interest
which tells us that there is strong community structure, in withdrawal of funds.
also visible in Figure 2. After the incentives there are The cost to join the system is very low: one only
852 monthly communities on average (Figure 8). Most needs to send a text message. However, if we use the
of these “communities” are pairs or small clusters of Jack & Suri [13, 14] criteria and consider that in this
personal users, although most actors are involved in kind of project, initial adopters are educated people with
communities centered on large agents (Figure 2). These a high level of income, for the Ecuadorian case adopters
results show that the structure of the transaction network could be banked people who already have other means
did not promote information diffusion between users. of payment such as credit or debit cards and are entering
The benefits of the network went mostly between into this network to get the benefits of the incentives and
macro-agents and users. accumulate dollars in their MM accounts.Figure 10: In and Out Exchanges Counts most of these people are getting the Government
transfer because of the law, they expect to accumulate
e-money in their MM accounts until they have
approximately $50 value to convert into cash money and
they are doing this cash-out two to three times a month.
Comparing this amount to the mean transaction value of
$11 that we found in the Transaction Network, it is clear
that the incentives distort the economic relations: new
users were there to collect the incentive.
For the total number of cash-in transactions per
month, we can see in Figure 10 (circles) that the number 5.3 Incentives Network
stabilizes around 5700 transactions per month after the
peak. The spike in Figure 10 represents the massive This last network captures transactions in which the
reaction that agents have after the announcement of tax Government gave agents money back because of their
incentives. However, for the cash-out transactions, a usage of non-cash payments (e.g., MM, debit card or
positive trend is always present during OLSRRAZE’s credit card). Nodes in this network are macro-agents,
life, reaching more than 27000 transactions (diamonds, companies, users and the Government by its public
Figure 10) and closely mirroring actor counts (Figure 9). companies, Central Bank and some transitory accounts
After the spike of activity in the 19th month, for the that are used for this propose: “MA BANK”, “MA CO”,
2657 agents that are cashing in on average, the mean “CO PR”, “CO SPG”, “SAP”, “Remesadoras”,
number of transactions is around 4.3; and for the 13070 “Persona Natural (RUC)”, “Persona Natural(usuario)”,
that are cashing out their accounts, the mean number of “CO EP”, “BCE”, “BCE Cuentas Transitorias”. We
transactions is about 2.4 (plots omitted due to space analyze this network after 2016-04 because there were
limitations). To see how much money actors are cashing no “Acreditacion masiva” transactions before OLEPF.
in every month, see Figures 11-12. From the 2657 Figure 13 shows that the system is transferring
people conducting in-exchanges, the mean value after money to more users over time. This reaches 164441
the incentive laws is around $64 (circles, Figure 11). accounts, 62% of the 265240 agents in the entire
Since they are making 4.3 transactions per month, the network. This graph is consistent with what already
total value exchanged per actor (circles, Figure 12) is shown: many people are in the network just to cash out.
around $276 and is growing over time.
Figure 13: Incentives Actor Count
Figure 11: Mean Value per Exchange Transaction
Figure 14: Incentives Mean Transaction Value
Figure 12: Mean Value Exchanged per Actor
For more and more users, the Government
increasingly is giving e-money back, until the law
In Figures 11-12, we can see that the 13070 active expires in month 29. Figure 14 shows the mean value of
agents are taking out $52 on average after the incentive incentives transactions that agents are getting for using
laws (diamonds month 20 onwards, Figure 11) in 2.4 non-cash payments. The value is increasing over time,
transactions per month, so the total value exchanged per and we can understand this as the 2% or 1% rebate that
actor every month is $128 (diamonds, Figure 12), a most of these users are getting because of the incentives.
value that make sense for the Ecuadorian economy. If6. Discussion and easy to-use design. Therefore, the fact that in Kenya
the project was managed by a private company that saw
The results suggest that there may be a problem the possibilities of this technological tool made them
with the use of incentives by the Ecuadorian find the right penetration strategy, something that from
government: the incentives distort the network with inception is very different from what happened in
users who decided to adopt the network not to make real Ecuador. Also, we can see here that credibility plays an
economic transactions but rather to benefit from the important role. Mas & Radcliffe [20] highlight how
incentives. Therefore, many MM accounts were important network effects and trust are in scaling up a
activated but these accounts were not used to carry out retail payment system. White [28] considers that the
any transactions. According to the Central Bank web problem in the Ecuadorian case is that people do not
page there were 402,515 MM accounts at December trust in the government and in particular in the Central
2017. From that only 41,966 accounts (10.43%) were Bank, given the history of default on sovereign bonds
used to acquire goods and services and to make and its participation in the 1999 economic crisis.
payments to the government, as seen in the Transaction
Network analysis. There are 76,105 accounts (18.91%) 7. Conclusions
that deposited and withdrew money without making any
transaction. These could be users that are benefiting Mobile Money in Ecuador was introduced by the
from the OLEPF and OLSRRAZE laws, and from time Government as a tool to help an economy with a
to time they withdraw what the Government refunds for shortage of liquid assets. The measures taken by the
payments made by credit cards or debit cards. These Government to encourage its use had a modest result
refunds are part of the Incentives Network. Finally, and instead distorted the economic relations, especially
284,444 accounts (70.67%) have been activated but in the way that users had an opportunity to collect
have not been used in any operation. These could be transfers from the Government. The Transaction
accounts that were created from the beginning of the Network tells us that the total amount of dollars a user
Project and did not find the space to use them or transacts per month is around $58.6, approximately
accounts that were created to benefit from the incentives $11.3 per transaction. The structure of the network
but had not withdrawn funds. shows us that most relationships were only between
We can think of many reasons why this project had macro-agents and users, not good for peer to peer
such low penetration in the Ecuadorian society. The information diffusion. The Exchange Networks for
literature of MM has taken the M-PESA case in Kenya Cash-in show that on average 2657 people cash-in
as the benchmark. Cammer et al. [5] compare Kenya to money into this network in an amount of $273 per
Tanzania, focusing on the mobile network operators and month and the Exchange network for Cash-out shows
the design of their business model and hence proposition that on average 13070 users withdrew money from this
to potential users, something that did not happen in our network for an amount of $140 per month after the laws.
case since the implementation was centralized from the In the end, the Ecuadorian Government gave incentive
CBE and the mobile operators were never part of the payments to more than 160000 accounts per month.
implementation. Balasubramanian & Drake [1] look at The present study offers a new approach for the
how the demand for MM in Kenya and Uganda is MM literature. Using network analysis to understand the
affected by macro-agent quality and competition. For adoption of a new technology in a developing country,
the case of Ecuador, we have seen that the incentives we can understand the behavior of agents during the life
measures were always directed to the final users. of the innovation, showing the structure of economic
Perhaps a better strategy for the Ecuadorian government relations by which agents are connected to each other.
would be to give the incentives to the macro-agents and Temporal analysis of the MM data shows how this
thus help the diffusion of the tool. behavior changes over time. Although data on agent
Other factors may explain the successful case of M- attributes is not available due to privacy concerns and
PESA. Mas & Morawczynski [18] attribute some of the data on prior offline economic activity is difficult to
success to strong branding, an easy-to-use product, and obtain, future work could attempt to explain which types
simple and transparent retail pricing. Heyer & Mas [10] of agents contributed (or not) in the diffusion of the
highlight the importance of volume, momentum, and networks, to give an alternatives to the failed strategy
coverage, as well as the regulatory environment, the used. Future work could also analyze patterns of agent
quality of the retail infrastructure, and the high telecom activity after first joining, to help to understand their
penetration, Mas & Ng’weno [18] highlight brand motives. Future work should also study other incentive
management, channel management, and pricing as the mechanisms that could be provided by a central
major contributing factors behind M-PESA’s massive government to maximize adoption of new MM
success, and Mas & Radcliffe [19] discuss the clever technologies.In a nutshell, these technologies have shown [15] Junta de Política y Regulación Monetaria y Financiera,
plausible results in many developing countries and have 2016. Resolución No. 252-2016-M
the potential to revolutionize the way people make [16] Kolaczyk, E. D., Csárdi, G., 2014. Statistical Analysis
monetary transactions, but their implementation must be of Network Data with R. New York: Springer.
consistent with the economic incentives and behaviors [17] Lal R., Sachdev I., 2015. Mobile money services—
of users and macro-agents participating in the network. design and development for financial inclusion. Work.
Pap., Harvard Bus. School, Harvard Univ., Cambridge,
MA
8. References
[18] Mas I., Morawczynski O. 2009. Designing mobile
[1] Balasubramanian K., Drake D., 2015. Service quality, money services: lessons from M-PESA. Innovations
inventory and competition: an empirical analysis of 4(2):77–91
mobile money agents in Africa. Work. Pap. 15–059, [19] Mas I., Radcliffe D. 2010. Mobile payments go viral:
Technol. Oper. Manag. Unit, Harvard Bus. School, M-PESA in Kenya. Work. Pap., Bill Melinda Gates
Harvard Univ., Cambridge, MA Found., Seattle, WA
[2] Banco Central del Ecuador, 2014. Regulación No. 055- [20] Mas I., Radcliffe D. 2011. Scaling mobile money. J.
2014 Paym. Strategy Syst. 5(3):298–315
[3] Bandiera O., Rasul I. 2006. Social Network and [21] Newman, M. E. J. (2010). Networks: An Introduction:
Technology Adoption in Northern Mozambique. Oxford University Press.
Economic Journal, Vol 116, (514): 869-902. [22] Registro Oficial del Ecuador, Abril-2016. Suplemento al
[4] Beaman L., Ben Yishay A., Magruder J., and Mobarak 744. Ley Orgánica para el Equilibrio de las Finanzas
A. M., 2015. Can Network Theory-based Targeting Públicas
Increase Technology Adoption? NBER Working Paper [23] Registro Oficial del Ecuador, Mayo-2016. Suplemento
No. 24912. al 759. Ley Orgánica de Solidaridad y de
[5] Camner G., Pulver C., Sjöblom E. 2009. What makes a Corresponsabilidad Ciudadana para la Reconstrucción y
successful mobile money implementation? Learnings Reactivación de las Zonas Afectadas por el Terremoto
from M-PESA in Kenya and Tanzania. Rep., Groupe del 16 de Abril del 2016.
Spec. Mob. Assoc., London. [24] Registro Oficial del Ecuador, Diciembre-2016. Segundo
[6] Carter M., Laajaj R., and Yang D., 2016. Subsidies, Suplemento al 150. Ley Orgánica para la Reactivación
Savings and Sustainable Technology Adoption: Field de la Economía, Fortalecimiento de la Dolarización y
Experimental Evidence from Mozambique. University Modernización de la Gestión Financiera.
of Michigan, mimeograph. [25] Ryan B., Gross N., 1943. The Diffusion of Hybrid Seed
[7] Fafchamps M., Soderbom M., Boogaart M., 2016. Corn in Two Iowa Communities. Rural Sociology. Vol
Adoption with social learning and network externalities. 8, (1): 15-24.
NBER Working Paper No. 22282 [26] Suri, T., 2017. Mobile Money. Annu. Rev. Econ. 9:497-
[8] Foster, A., Rosenzweig , M., 1995. Learning by Doing 520.
and Learning from Others: Human Capital and [27] Suri, T., Jack, W., 2016. The Long-run Poverty and
Technical Change in Agriculture. Journal of Political Gender Impacts of Mobile Money. Science. Vol. 354,
Economy. Vol 103, (6) 1176-1209. Issue 6317, 1288-1292
[9] Griliches Z., 1957. Hybrid Corn: An Exploration in the [28] White, L., 2018. The World’s First Central Bank
Economics of Technological Change. Econometrica. Electronic Money Has Come – And Gone: Ecuador,
Vol. 25, (4): 501-522. 2014-2018. https://www.alt-m.org/2018/03/29/the-
[10] Heyer A., Mas I., 2009. Seeking fertile grounds for worlds-first-central-bank-electronic-money-has-come-
mobile money. Unpublished manuscript, Financ. Sect. and-gone-ecuador-2014-2018/
Deep., Nairobi, Kenya
[11] Instituto Nacional de Estadísticas y Censos, Marzo-
2016. Encuesta Nacional de Empleo, Desempleo y
Subempleo.
[12] Instituto Nacional de Estadísticas y Censos, 2016.
Estudio Tecnologías de la Información y
Comunicaciones (TIC’s).
[13] Jack, W., Suri, T., 2011. Mobile Money: The
Economics of M-PESA. NBER Working Paper No.
16721.
[14] Jack, W., Suri, T., 2014. Risk sharing and transactions
costs: evidence from Kenya’s mobile money revolution.
American Economic Review. Vol. 104(1):183–223.You can also read