Qriously Programmatic Sampling Methodology - Brandwatch
←
→
Page content transcription
If your browser does not render page correctly, please read the page content below
Qriously Programmatic Sampling Methodology Brandwatch | A New Kind of Intelligence
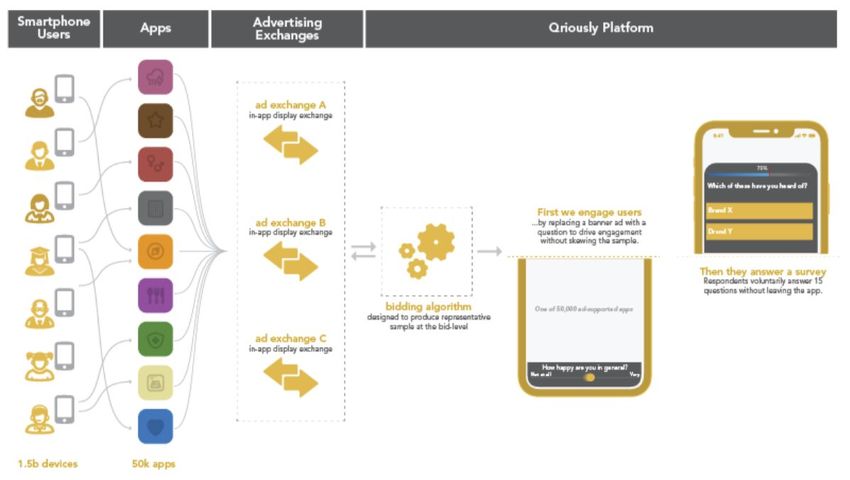
1. Programmatic Sampling: A User’s Journey. Programmatic sampling is a term coined by Qriously to describe the method of using the programmatic advertising space to carry out surveys. We have designed and built a platform which allows us to bid for the space, impress users with an initial question, and then ask those who choose to interact a full survey. None of our respondents are incentivized and are from the general mobile audience; we do not have our own panel. A user’s experience with Qriously begins when they open an app on their mobile device which includes space for real-time bidding (RTB) advertising. If connected to the mobile network, the device informs the bidding exchange that there is space to show a creative, or advert, in the app. The exchange notifies interested parties, such as Qriously, who decide whether or not to take part in the auction. In these auctions, the highest bidder wins, but pays the price of the second highest bid. All this takes place within a fraction of a second. Qriously has proprietary software to decide whether to bid on a user or not. On a device-by-device basis, it decides how much to bid using previous data as well as the current status of the survey. If the bid is successful, the user is impressed with the recruitment question, the in-house term, as it is more than an advertising creative. This is shown as part of the Qriously Platform in Figure 1.1. After they interact, the advert expands into a full screen survey on the user’s device. This is the final stage illustrated in Figure 1.1. Each individual project involves the collection of some number of complete survey interviews. This process usually takes a few days, but it will depend on the sample size and the market. Once the data collection phase is over, we process the responses and present an aggregate view of the data that is representative of some population via our Dashboard interface. An example of this is shown in Figure 1.2. Brandwatch | A New Kind of Intelligence

Figure 1.1: U ser journey: U
sers
pick up their devices and connect
to apps. When ad space is
available, the exchanges facilitate
the bidding process as part of a
second-price auction. Should
Qriously win the auction, the user
proceeds into the Qriously
Platform and is impressed with
the recruitment question, usually
in the form of a Leaderboard
(320x50) banner advert.
Figure 1.2: A
n example of the
Dashboard interface for a survey
measuring brand and product
awareness in Brazil. All the blue
dots on the map are full
interviews obtained during the
course of data collection.
Brandwatch | A New Kind of Intelligence
2. Qriously Surveys Qriously has developed a proprietary platform to create, serve and analyse survey answers. In this chapter we detail some of the features of the platform to date 2.1 Anonymisation and Respondent Privacy At Qriously, we believe in respecting the privacy of our respondents, and we ensure we process respondent data in a lawful, fair and transparent manner. When users interact with our surveys, their responses are recorded against an identifier which cannot be linked back to the advertising ID received from their mobile device, unless the end user has provided their consent for this to happen. The privacy notice they see is shown in Figure 2.1. We also provide functionality to allow users to manage their data privacy by showing them the information we may have stored about them, removing this information from our systems, and opting out of further surveys recruitment. An example of this is shown below in Figure 2.1. Figure 2.1: Above: The privacy notice a respondent sees during a survey containing information about how Qriously uses data. Brandwatch | A New Kind of Intelligence
2.2 Technical Capabilities
The standard set up for a Qriously survey is given in Table 2.1. Mock-ups of the standard recruitment
questions sizes are shown in Figure 2.2.
Table 2.1: A summary of the technical set-up typically used for a Qriously survey.
Property Typical Set-up
Block size 320x50, 320x480, 320x250, native
Device type iOS, Android
Ad exchange Mopub, Smaato, OpenX, Inneractive, OAuth, Ad-Colony
IAB category Dependent on survey subject
Figure 2.2: T
wo examples of recruitment
questions using buttons (left) or a slider (right).
2.3 Survey Features
A number of unique features are built into the Qriously Platform when it comes to survey design. They make
for a more flexible survey design which allows our clients to get the information they need from the
appropriate users. The features can be broadly divided into those related to the style and text of question the
user answers, and those related to the ordering and display of questions within the survey, which we call the
survey logic.
Question Features
These features deal with the text the users see and how they are expected to answer.
Brandwatch | A New Kind of Intelligence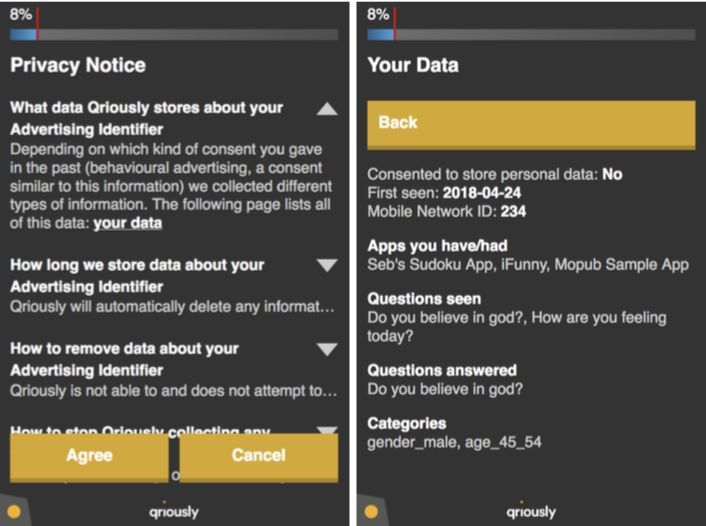
● Single and multi-select questions – a user can supply one answer and one answer only, or has the
option to select as many as they wish (see Figure 2.3).
● Answer order randomisation and pinning – the order of the answer options can be randomised or
flipped, and specific answers can be fixed in place. This is useful in multi-select questions where a
’None of the above’ option can be pinned at the end of the list, while the other options are
randomised (see Figure 2.3).
● Ability to add images – can be used to prompt campaign recall or product awareness.
● Question macros where the answer option in a previous question is included in the text of later one –
can be used to gain insight into why an answer is given. If the previous question asks "Who will you
vote for in this election?" followed by a list of political parties, the next question can insert the party
name into the question text e .g. "Why are you voting for the Party?" to understand the
user’s choice.
● Recoded questions – used in analysis rather than being part of the user experience, but it allows us
to add questions after the fact such as grouping users together based on their answers to a number
of questions, for example users who are not current users of a particular product and who have
stated they earn over a certain amount per year.
These question features are all designed to make the survey more flexible for our clients and easier to
analyze, with the exception of the answer order randomisation. This is specifically designed to minimise any
effects due to accidental clicks on the survey, or those who are speeding through to the end by clicking
rapidly in the same physical location for each question.
Survey Logic
These are features which can be set to determine how a user proceeds through the survey and which
questions they see:
● Display rules based on previous answers – show questions to users who have or have not given a
certain answer or set of answers. Logical or combinations of rules are permitted.
● Display rules based on location – same as above, but for the user’s location, e.g. in the UK, the
education system in Scotland is separate from the rest of the country so we can ask one que tion
about qualification to users there, and another to the rest of the UK.
● Disqualification – a user can be disqualified at any point during the survey based on their stated
answers. Users under 13 years of age are disqualified automatically.
● Question blocks with random selection and order – questions can be grouped together into blocks
and within that block, the order the users sees the questions can be randomised, or they can only be
shown a limited number of them. This is useful for "optional extras" at the end of a survey or when
having a full interview is less important
Brandwatch | A New Kind of Intelligence
● Capability to run the same survey simultaneously in multiple countries (a translation interface is
available for external translation services into local languages where necessary).
Figure 2.3: Top left: a single
answer question. Top right:
a single answer question
where the user must scroll
to see all the possible
options. Bottom left: a
multi-select question.
Bottom right: the same
question but with the ’dog’
and ’cat’ options
randomised in order, the
’other’ option pinned, and
the ’none’ option pinned and
exclusive.
Brandwatch | A New Kind of Intelligence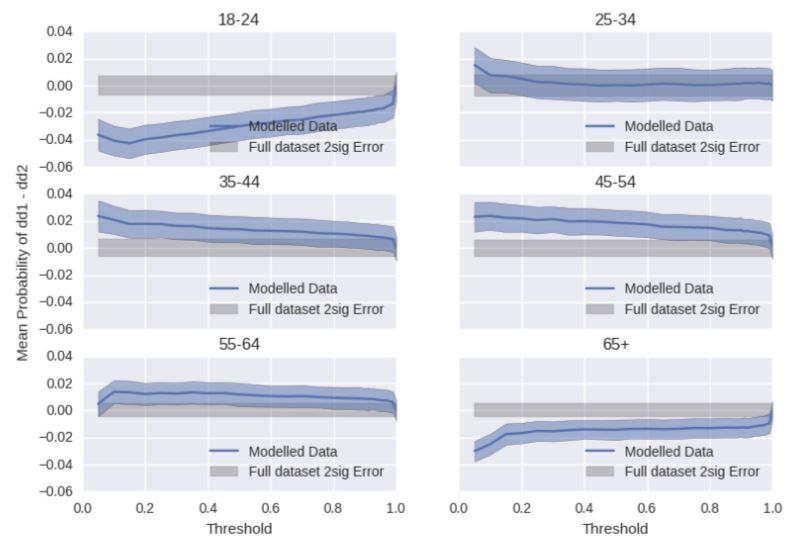
Figure 2.4: A
schematic illustration for some of the basic skip logic we can apply during
survey construction.
2.4 Targeting Features
Location Targeting
We have the capabilities to target or geo-fence surveys in very small areas (although this naturally impacts
the size of the sample we are able to generate). As well as the national levels, we can target regions and
sub-regions, and with the correct shapefiles (A standard geospatial map format that resolves a given
coordinate into a named locale) we have been able to target areas on a sub-city level. Our shapefiles are
usually custom-prepared and based on administrative areas such as electoral or council boundaries, but in
theory they can be anything. This is illustrated in Figure 2.5.
App Targeting
It is our belief that we obtain a better sample by getting answers from as wide a range of apps as possible,
however we block a small number of apps which we know contain almost exclusively traffic from under 13s,
or where we believe the app is broken and not displaying our surveys correctly. It is possible to restrict a
survey to a list of known safe apps, but this severely limits traffic and can introduce bias so we do not
recommend it.
Brandwatch | A New Kind of Intelligence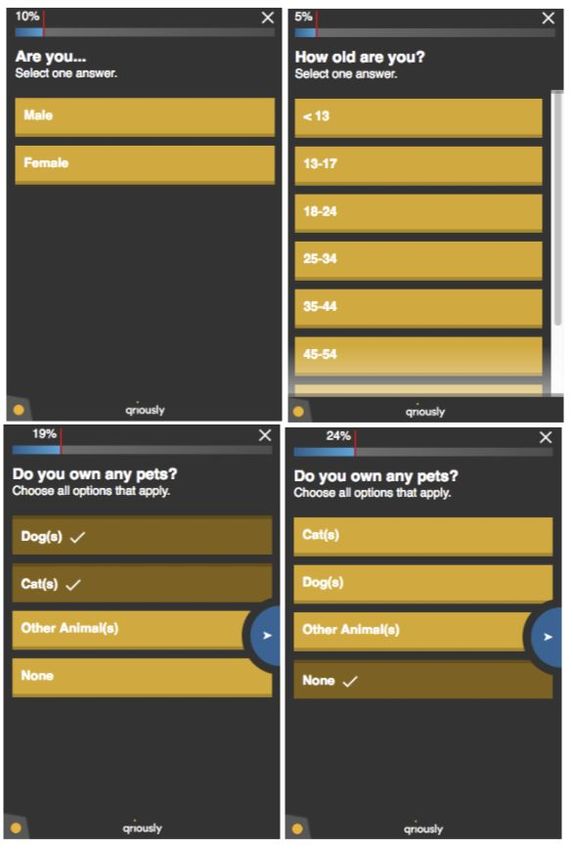
Figure 2.5: A custom shapefile for New York
City in yellow shows how the five boroughs
can be targeted on a small area level and
separately from the rest of the state and the
surrounding area of New Jersey. Background
map data via Open Street Map
Behavioural Targeting
It is also possible to target users based on their previous inclusion in a survey. For example, when running
pre and post-campaign surveys to measure an uplift, it can be helpful to target some of the same users
again. We can also target users from campaigns run on other platforms by including an API call to our
systems in those campaign creatives. When the media is displayed, our servers are notified by the call which
sends us the user’s device ID either in raw or a hashed form, which we store in a hashed probabilistic data
structure. After the campaign is finished, we use the information in the data structure to re-target exposed
devices and perform the survey. Once this is completed, we delete the initial data structure.
We do not re-survey users who have previously stated they are under 13 by default.
Modelled and Filtered Targeting
At Qriously, we have developed a way of modelling the responses of users to questions, in particular
demographic characteristics. A full discussion methodology behind this is beyond the scope of this
document, but an explanatory report is available on request (Qriously, 2018b).
To summarise, for any user we can generate several hundred features which we can use as the input to
models which return the probability that the user has that demographic profile e.g. the probability they are an
adult, the probability they are female. We use our survey answers as labelled data when generating these
models, but the system allows us to evaluate the models against any user we see in the bid-stream, whether
or not they have interacted with us before.
We can use either the individual feature values as a pre-filter to bidding, or use a full model, as a way of
excluding those users who are very probably not those people we are interested in. Most commonly we have
Brandwatch | A New Kind of Intelligence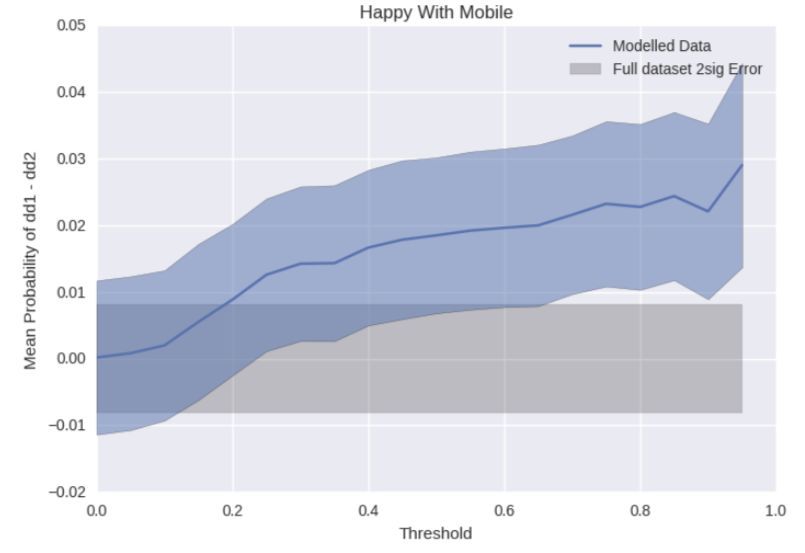
used a model which excludes users very likely to be under 18 years old, or have filtered out people we think are under 13 years old. The use of models and filters like this requires a full understanding of any possible biases you might introduce to the system. For example, in removing those under 18 years old, you may inadvertently lose some young adults who appear similar in behaviour. It is vital that user behaviour is characterised and the thresholds used during targeting are carefully applied to prevent biasing the sample. We discuss the different types of survey biases in more detail in Section 3, including our work on characterising these thresholds. Brandwatch | A New Kind of Intelligence
3. Survey Bias Any survey methodology could be susceptible to biases introduced either through the medium or media used to obtain the data, or through inadequate sampling. In this section we discuss possible sources of bias in our data and what we do to overcome them. 3.1 Response Bias Voluntary response bias occurs when a survey topic is particularly divisive, or provokes strong emotion in respondents. This can be seen, for example, in TV call-in polls, or online newspaper polls. These sorts of samples tend to over-represent individuals with strong opinions. We control this by making sure that all of our surveys are locked behind the recruitment question, so that the respondent has no idea what kind of survey they will receive. As they did not elect to enter a survey about the topic at hand, we are more likely to reach people with a wider range of opinions, as opposed to strong positive or negative views. In addition, our respondents are not incentivised in any way for survey completion, so there is no incentive for them to misrepresent their own status or beliefs in order to be included in the target group. This reduces satisficing and other undesirable respondent behaviours. There is a possibility that those who drop out of our surveys (who are excluded from the final sample) are somehow different from those who finish the entire survey. This is a problem in most methodologies and is not specific to Qriously. In our case, we do our best to control it by using relatively short surveys, with casual language,and easily-understood questions in order to increase respondent engagement and reduce drop-out. We try to keep all surveys fun and enjoyable for our respondents, so that even people who are not naturally interested in the topic at hand will continue to answer the survey. This reduces the bias associated with those who leave the survey prematurely. 3.2 Non-Response Bias Non-response bias occurs when some individuals are unwilling or unable to participate in the survey. We have a few ways of reducing this source of bias. Firstly, we have tested our non-response bias against a known sample of device IDs that we received from a panel provider. All of these IDs belonged to respondents with known demographic characteristics, including gender and age. We found that, when these panellists were exposed to our survey, non-response bias was minimal – approximately equal numbers of men and women answered, and our age distribution was broadly similar to the panels, although we did have a slight under representation of working adults (adults aged 35-55 in full-time employment). There are a number of other tactics we employ to reduce non-response bias: Brandwatch | A New Kind of Intelligence
● Using a non-biasing recruitment question: We tested over 100 different recruitment questions during
the early stages of our research, on a known sample of panel IDs. Some were found to be biasing
(for example, asking about gun control resulted in a much higher proportion of young people than we
would expect based on the sample). We found two questions that consistently reduced
non-response bias to minimal levels which are consistently used to reduce bias.
● Targeting a potential respondent multiple times: Once a respondent is randomly selected from the
pool of traffic, we target them multiple times with our banner question. This is the digital equivalent
of phoning a randomly dialled number multiple times before removing the target from the list of
phone numbers. Once we have selected a respondent, we ensure that we give them as many
chances to respond as possible, even if they are busy or distracted during our first banner display.
The average number of impressions before a user answers is 2.7. This is shown in Figure 3.1
Figure 3.1: A
histogram of the number of
impressions seen by all users (blue) and by
answerers (orange). The average number of
impressions before a user answers is 2.7, but
this is heavily skewed towards the left. The
distribution of impressions a user typically
sees is also skewed to the left. In this survey,
the total number of impressions a user could
see was 10.
3.3 Modelling and Pre-Filter Bias
As discussed above, we can use pre-filters or modelling to target users we think are more likely to be in the
groups we wish to survey. The outputs are probabilities i.e. a number between 0 and 1, and we select a
threshold value where we can reject those above or below. It is vital that this change in threshold does not
alter the results. We test for this using survey data and retrospectively applying the filter or model and seeing
if there is a change in the answer distribution as users are removed.
Figure 3.2 shows a test we performed with a prefilter to remove those < 13. In this case, we keep all users
whose feature values is below a threshold value and plot the difference between the data without a prefilter
and after (blue). The grey region represents the ±1σ margin of error on the measurement in the complete
sample. If we think of the threshold as sweeping from right to left on each of the plots, we start to remove
people from the sample, most notably 18 – 24 year olds. The blue shaded region is the margin of error on the
fraction of data from that age group in the remaining data. The prefilter would ideally not significantly affect
the age groups we are not looking to remove, so in this case, the limit of the threshold is 0.95. In reality, most
of the gain is made in the region between 0.99 – 1.0 so we very rarely set the prefilter any lower than this.
Brandwatch | A New Kind of IntelligenceThis is evident in Figure 3.3 which shows that there is a large initial drop in the total sample size, but this is
not reflected in the number of adults in the data sample.
Figure 3.2: Characterising the
effect of an age-based prefilter
on a sample of data. All the age
groups are shown as residual
plots i.e. the difference in the
relative percentage of that age
group when the pre filter is
applied. The grey box around
zero shows the ±1σ error from
the data sample, and the blue
shaded region is the ±1σ error
from the same sample, but after
the prefilter is applied.
It is also important to check the models against questions asked on a variety of topics. In Figure 3.4, we are
applying a model that accepts adults, so the threshold sweeps from left to right removing users who are less
likely to be adults. We see that the application of the model does not change the fraction of adults who are
happy with their mobile phone until very high thresholds. This is much higher than we see when checking the
age distributions (∼ 0.2) so implies that we could apply the adult model and expect no bias to be shown in
this answer.
Figure 3.3: Z
ooming into the highest
threshold values we see how the
numbers of adults changes relative to
the sample size as a whole.
Brandwatch | A New Kind of IntelligenceFigure 3.4: C
haracterising the effect of
an adult model on the fraction of
people who say they are happy with
their mobile phone.
3.4 Undercoverage Bias
Undercoverage bias occurs when some members of the population are not adequately represented in the
sample. There are several kinds of undercoverage bias that we could be subject to, as a smartphone river
sampling company. It’s true that these people will be excluded from our sample. However, this is becoming
less and less common; the latest estimates from comScore (2017) indicate that over 200 million people in
the U.S. own smartphones (81% of the > 13 year old population), and this is only likely to increase over time.
There are some respondents who we cannot reach, but the proportion of people in this category will decline
over time.
There is also an increasing sample of users who are reachable in mobile devices only. This trend is in almost
all markets. For example, in the USA between January and December 2017, the sample grew 4.6%, with
growth over the same period in some countries nearing 10%. Approximately 80% of all mobile time is spent
in-app, rather than on the web (comScore, 2018). On most topics, having a smartphone should not be a
major factor likely to influence the respondent’s opinion about the topic at hand (e.g. smartphone use is
unlikely to correlate with food preferences or social behaviour). The obvious exception is technology
because our respondents all have smartphones, they are likely to be more tech-savvy and are thus more
likely to be early adopters of new electronic consumables. We recommend caution when extrapolating
results from our tech-related surveys to the general population.
Even among smartphone owners, some people are more likely to have smartphones than others. For
example, younger people are much more likely to have a smartphone than older people. We correct for this
by applying raked weights to our sample after fieldwork, so that under-represented groups (such as older
Brandwatch | A New Kind of Intelligencepeople) are fairly represented in our final sample. We give lower weights to groups that are over-represented
in our sample, such as younger people and minorities (in the US).
Among smartphone owners, some people are more likely to be in our sample than others. As we sample
from a select group of around 50,000 apps, some people are more likely to be in our sample (people who
have many apps, for example, or people who use particular apps a lot). It’s true that different people have
different selection probabilities to be in our sample. However, we do our best to match our sampling to the
traffic of the app, so our sample should be broadly representative of the traffic that we receive from ad
exchanges. For example, if App X makes up 10% of the mobile ad network traffic, it should also make up
about 10% of our sample. We are also expanding our app list, so this problem will decline over time. It is
estimated that we can reach about 80% of all smartphone traffic in the U.S. at the moment, and this is
increasing each month.
3.5 Other Sources of Bias
Related to undercoverage, is also any possible bias introduced by the distribution of mobile and internet
coverage. For example, if rural homes were not able to access the internet or get cellular reception, this
would introduce a bias into our data. In order to test for this, we created an impressions density measure
compared it to population density. We found that the correlation coefficient in the UK was R2 = 0.72 implying
the two variables are highly correlated. The rest of the variance could not be explained by region of the
country or urbanisation.
Figure 3.5: In the Virginia
Gubernatorial race, users were
more likely to vote Democrat
during the evening hours. If we
had used data just in the
daytime, we would have
predicted a much closer race.
We have also investigated temporal biases introduced due to sampling at different times of the day or on
different days of the week. We do see a temporal bias in some cases and to ensure that it does not affect
our results, we recommend sampling over several days and including weekends and week days. An example
of this is shown in Figure 3.5 where we see different voting patterns in users in the daytime compared to the
evening.
Brandwatch | A New Kind of Intelligence4. Representative Sampling Nationally representative sampling is the goal of many research surveys. At Qriously, we do this through a mixture of methods developed through our experience and experimentation both in market research and political polling. It is to be expected that the mobile in-app audience is different from the general population e.g. it skews towards a younger demographic, so we make a number of corrections during the targeting process to balance better the sample. 4.1 App Sample As shown in Table 2.1, we use a mixture of ad sizes within our surveys. It has been our experience that the apps that show 320×480 ads have an older audience that tends to be male. We enforce that an enhanced percentage of our interviews must come from this size ads relative to the amount of traffic as a way of finding older people. We cannot use it as a way of completely balancing out the ages of our users, as this would bias towards a male audience. As mentioned in Section 2.4, we believe that sampling from as many apps as possible leads you to a more representative sample. However, some apps are more popular than others, and would dominate the survey sample, so we artificially cap the contribution of any one app to 5% of the total number of interviews in the survey. 4.2 Location Targeting As standard practice we use quotas to ensure that the full interview location distribution matches the population distribution at the first sub-national level (NUTS1 in the EU, BEA regions in the USA). This is usually sufficient for market insight pieces. When it comes to political polling, we can employ a number of extra techniques we have developed since 2016 to ensure an even more representative sample. Sampling by Population Density It is well known that there are different opinions in urban and rural populations when it comes to politics. To ensure that we sample from both types of area equally we use census estimates of the 18+ population at the smallest administrative level available and convert these into population density measurements. We then divide the country into quintiles based on having equal total population in each. When running the survey, we can use a quota to ensure that no quintile accounts for more than 20% of the survey’s full interviews. This helps prevent us over-sampling urban areas relative to rural ones. This is illustrated in Figure 4.1. Brandwatch | A New Kind of Intelligence
Figure 4.1: Population density quintiles in Italy
based on comume level data (Italian National
Institute of Statistics, 2011). Most of the larger
areas which draw the eye have a low total
population and so are in the lowest group. The
zoomed in box shows the centre of Rome, where
there are many smaller districts in the higher
groups. Any missing data would show as light blue.
Sampling by Census Cluster
As well as population counts, governments often make other census statistics available at sub-national level.
We collate this on as small an area as possible. Although the exact data we use varies from country to
country as it depends on availability, some variables we typically look to include are population age
distribution, unemployment levels, employment type, education levels, birth nationality and population
density.
The data is standardised (transformed to have a mean value of 0 and a standard deviation of 1) and we
apply a clustering algorithm to group similar areas together. The optimum number of clusters is estimated
using the elbow method, and each area is labelled. Where there is missing data, we use a nearest neighbours
algorithm to fill in any gaps.
As with the sampling based on population density, we calculate the fraction of the 18+ population in each
cluster, and set up the survey to sample full interviews in proportion.
The Future of Bidding
Qriously is actively developing a machine learning-driven bidder where it can respond to the status of a
survey and actively bid less on people who have already responded to the survey. In practice, this will mean
that it will be even easier to obtain balanced data samples. Any new system will be fully characterised and
tested for new biases before it is used as standard. We have put a lot of effort into improving our sampling
as we believe that having as large and as diverse sample as possible produces better results. We could
sample blindly and weight our data, but then we would not get the same breadth of users, hence a less
representative data set. We have seen the recent failure of more traditional polling methods, and some of
this has been attributed to samples which do not adequately reflect the diversity of the underlying population
(Sturgis et al., 2016). At Qriously our record of political polling is strong across multiple countries.
Brandwatch | A New Kind of Intelligence5. Analytical Methodology
A statistically rigorous analysis of survey data is just as important as the collection of the data itself. In this
section, we summarise the methods that we typically use to go from raw survey answers, to data that is
ready for reporting via our Dashboards interface.
5.1 Data Cleaning and Weighting
Typically, we apply the following steps at the end of data collection:
1. Remove users who were disqualified or dropped out part way through the interview
2. Remove any users with missing answers, typically caused by connection issues between the user
and Qriously (a few per survey)
3. Remove users with locations that are unresolved at the level we require for weighting
This set of data forms our sample for analysis. Although we have applied all our corrective measures to
sample as representatively as possible, the distribution of users never exactly matches the sample you wish
for, so we apply weighting to correct any remaining discrepancies. We use the Iterative Proportional Fitting
algorithm (IPF, also known as raking, see Bishop et al., 1975) to our data which generates as weight for each
user, that can then be used in the calculation of any KPIs. It works across each dimension in turn, adjusting
weights until the proportions of each answer match the desired ones.
Our default auxiliary variables for weighting are gender, age and the first sub-national level population, but
provided we have access to census-style reference data, we can also include weightings for variables such
as education, and income. In campaign effectiveness studies, we can also weight a controlled group to
match the demographic of the exposed, and isolate the effect of the creative only.
A diagnostic of how well the sample matches the reference data is the weighting efficiency, η, which we
estimate through the Kish formula (Kish, 1965)
Brandwatch | A New Kind of Intelligencewhere wi is the weight of respondent i. It is summed over all users in the sample. The value of η ranges between 0 and 1, 1 being a perfect match the reference data, and typically we achieve values of η ∼ 0.85 but it depends on the market, the number of auxiliary variables and the size of the sample data. With the weighting efficiency, we then calculate an effective sample size, Neff as where N is the number of respondents in the sample. This says that the weighted sample of size N contains the same information as an equivalent perfect sample (all wi = 1) of size Neff. The better you have sampled, the smaller the difference between N and Neff. 5.2 Uncertainties By its nature, a sample has an associated margin of error which needs to be quantified. We have chosen to use a Markov Chain Monte Carlo (MCMC) method to estimate these. We run thousands of simulations of the results of each survey to measure the likely distribution of possible results and from this we use the highest posterior density (HPD) region to estimate the smallest range of values where 95% of the probability lies. More information on this is available in Qriously (2018a). We use different models for single-answer and multi-select questions. Single answer responses (e.g. gender, age) are modelled as a Multinomial distribution with a Dirichlet prior. Each response of a multi-select question (e.g. select all that apply questions) is modelled as a true or false case which makes it a simplified version of the single-answer response (a multinomial distribution is a generalised case of a Binomial distribution. The Dirichelet distribution is the generalised Beta distribution). A consequence of our use of a more realistic prior and the HPD is that our error bars may not be perfectly symmetric, especially in smaller samples or when there is a low incident rate. More specifically, the Binomial distribution can be approximated by a Gaussian (symmetric) distribution under the condition Np 5, where N is your sample size and p is your probability of a true answer. This uncertainty and the associated distribution is displayed in the Dashboard interface. An example is shown in Figure 5.1. The full distributions are shown in the lower-half of the plot with the error bar corresponding to the 95% HPD. These examples have Np ≥ 5 so the error bars appear symmetric. Brandwatch | A New Kind of Intelligence
5.3 Significance Testing Our MCMC approach to simulating our uncertainties also makes significance testing easier to describe and interpret. To illustrate this, we will use the example of a campaign effectiveness study where we have a pre-campaign and post-campaign wave (A wave is the Qriously term for a period of data collection. A project can have multiple waves). In order to know whether the campaign has been successful, we compare the pre- and post-campaign KPIs and see if there has been a significant change or not. The MCMC simulations we use to calculate our error bars also allow us to calculate a probability distribution for the size of the difference, or delta, between the pre- and post-campaign waves. The distribution will be spread over some range of values and the fraction of the density above or below zero tells us how confident we can be in rejecting the null hypothesis - there is no change before and after the campaign. An example of this is shown in Figure 5.1. We recommend that you must be able to reject the null hypothesis with at least 95% confidence to deem a result significant. This means that 95% of the area under the probability distribution must be above or below zero. This is the limit that we use in-house and is commonly used in scientific analysis. We do not recommend changing this setting in the Dashboard. 6. Conclusions We have discussed the technical process of a user answering a survey, the ways that we can set-up a survey, and the methods behind our data collection and analysis, all of which we undertake while being respectful of our users’ privacy. We believe that a thorough and open discussion of our methodology can only make our technology easier to trust and believe in. In the end , we can only be judged on our successes and failures, and we include Ta- ble 6.1 below to show how we have fared in the most difficult of sampling tests – political polling. We leave this to the reader to make their own judgement. Qriously has developed unique sampling capabilities and has multiple advantages over the more traditional panel-based research companies. We believe that with our speed, reach and diverse source of participants, Qriously is the research solution for companies that demand unparalleled accuracy, immediately. Brandwatch | A New Kind of Intelligence
Data Country Outcome
23 June 2016 Brexit Referendum The only firm to predict
a Leave victory. Puts Qriously
and our method on the map.
08 Nov 2016 US Elections Correct calls on most of the
tough swing states, as well as
prediction of MI, OH and PA.
04 Dec 2016 Italian Referendum Nearly perfect call of 40.9% yes,
beating pollster consensus.
15 March 2017 Dutch Elections Correctly predicted rank- ing of
top 8 parties.
23 April 2017 French Elections No public comment. (client
privileged data)
09 May 2017 S.Korean Elections Predicted correct outcome, with
Moon Jae-In winning
08 June 2017 UK Snap Elections Predicted Labour surge and voter
share better than any other
pollster.
23 Sept 2017 NZ General Election Predicted Labour surge and
youth voter turnout.
24 Sept 2017 German Elections Predicted losses for CDU/CSU,
hung par- liament and high
support for AfD at 14%, beating
consensus.
07 Nov 2017 VA Gubernatorial Predicted Democrat win
04 Mar 2018 Italian Elections Predicted 5Star surge and
advantage of League over Forza
Italia.
Brandwatch | A New Kind of IntelligenceBibliography
Y. M. M. Bishop, S. E. Fienberg, and P. W. Holland. Discrete Multivariate Analysis: Theory and Practice. MIT
Press, 1975.
comScore. U
s smartphone penetration surpassed 80 percent in 2016, 2017. URL
https://www.comscore.com/Insights/Blog/ US- Smartphone- Penetration- Surpassed- 80- Percent- in- 2016.
comScore. Global digital future in focus 2018, 2018. URL https://
www.comscore.com/Insights/Presentations- and- Whitepapers/ 2018/Global- Digital- Future- in- Focus-
2018.
Italian National Institute of Statistics. Istat database, 2011. URL http://www.istat.it/en/censuses.
L. Kish. S
urvey Sampling. Wiley, 1965.
Qriously. Dashboard mcmc documentation. 2018a. URL https://dashboard.qriously.com/#/help/mcmc.
Qriously. M
odelling methodology. 2018b.
Patrick Sturgis, Nick Baker, Mario Callegaro, Stephen Fisher, Jane Green, Will Jennings, Jouni Kuha, Ben
Lauderdale, and Patten Smith. Report of the inquiry into the 2015 british general election opinion polls, 2016.
Brandwatch | A New Kind of IntelligenceYou can also read