Using Deep Convolutional Neural Networks to Detect Rendered Glitches in Video Games - EA.com
←
→
Page content transcription
If your browser does not render page correctly, please read the page content below
Using Deep Convolutional Neural Networks to
                                 Detect Rendered Glitches in Video Games
                           Carlos Garcı́a Ling                           Konrad Tollmar, Linus Gisslén
                           carlosgl@kth.se                                    {ktollmar,lgisslen}@ea.com
                    KTH Royal Institute of Technology                         SEED - Electronic Arts (EA)
                         Stockholm, Sweden                                        Stockholm, Sweden

                            Abstract                                 a video is produced within the game by a camera travers-
                                                                     ing the environment recording different assets in the game.
  In this paper, we present a method using Deep Convolu-
                                                                     A human tester can then view the video and check that ev-
  tional Neural Networks (DCNNs) to detect common glitches
  in video games. The problem setting consists of an image           erything looks like expected. Although valuable, this pro-
  (800x800 RGB) as input to be classified into one of five de-       cess can be extremely time consuming and costly due to the
  fined classes, normal image, or one of four different kinds of     scarcity of the glitches, and, because the lack of a systematic
  glitches (stretched, low resolution, missing and placeholder       procedure, many of them might be overlooked. Automated
  textures). Using a supervised approach, we train a Shuf-           testing on rendered images is crucial for an effective devel-
  fleNetV2 using generated data. This work focuses on detect-        opment process but at the same time also difficult to achieve
  ing texture graphical anomalies achieving arguably good per-       with traditional methods.
  formance with an accuracy of 86.8%, detecting 88% of the              Anomaly detection methods have proven useful when
  glitches with a false positive rate of 8.7%, and with the mod-     detecting rare instances (Chandola, Banerjee, and Kumar
  els being able to generalize and detect glitches even in unseen
                                                                     2009) in fields like finance (Ahmed, Mahmood, and Islam
  objects. We apply a confidence measure as well to tackle the
  issue with false positives as well as an effective way of aggre-   2016), fault detection, surveillance (Sultani, Chen, and Shah
  gating images to achieve better detection in production. The       2018), or medical research (Schlegl et al. 2017). With the in-
  main use of this work is the partial automatization of graphi-     creasing amounts of data, and computational resources more
  cal testing in the final stages of video game development.         complex methods allow to detect anomalous instances even
                                                                     in complex data (Chalapathy and Chawla 2019) like image
                                                                     (Schlegl et al. 2017) and video (Sultani, Chen, and Shah
           Introduction and Background                               2018), using unsupervised and semi-supervised approaches
Developing video games involves many steps, starting from            (An and Cho 2015; Zenati et al. 2018). When looking into
the concept, to the final release. Often there are hundreds          the problem formulated in video games, we have identified
of developers and artists involved when creating a modern            two crucial characteristics:
game. In this complex process plenty of bugs can be intro-
duced, and many of them having an negative effect on the             • Availability of data: Video game images are generated by
rendered images. We refer these graphical bugs as glitches in          a rendering engine, in contrast with natural images they
this paper. There are several stages where graphical glitches          do not have to be sampled and potentially a big data set
can occur: when updating the asset database (e.g. result-              can be generated.
ing in missing textures), updating the code base (e.g. re-           • Generation of negative samples: When an element mal-
sulting in textures being corrupted), updating (graphical)             functions in the video game and a glitch is generated,
drivers, cross-platform development, etc. The main method              there is often a reasonable way of tracing the source. This
to find these visual bug is by testing the game and its in-            allows the generation and reproduction of similar artifacts
put/output. Since graphics are one of the main components              synthetically.
of a video game, it is of high importance to assure the ab-
                                                                        These characteristics mean that in practice both positive
sence of glitches or malfunctions that otherwise may reduce
                                                                     and negative glitch examples can be generated at a large
the player’s experience.
                                                                     scale for training our model. Thus, allowing for a super-
   Graphical errors are hard to programmatically detect and
                                                                     vised approach, meaning that we will train our model using
occur in relative small proportion. Often, they are identified
                                                                     labeled samples which usually translates on a higher perfor-
by testing the game manually by a human and when de-
                                                                     mance compared to an unsupervised approach using unla-
tected, they are diagnosed and addressed. As they occur rel-
                                                                     beled data. However, with this approach we will primarily be
ative seldom it is a time consuming and mundane task. One
                                                                     able to detect the same type of glitches as the ones used for
example of graphics testing is the so called smoke test. Here
                                                                     training, meaning that other graphical glitches will remain
Copyright c 2020, Association for the Advancement of Artificial      undetected by the model. We argue that this is not necessar-
Intelligence (www.aaai.org). All rights reserved.                    ily a big problem as we can solve this by having an iterative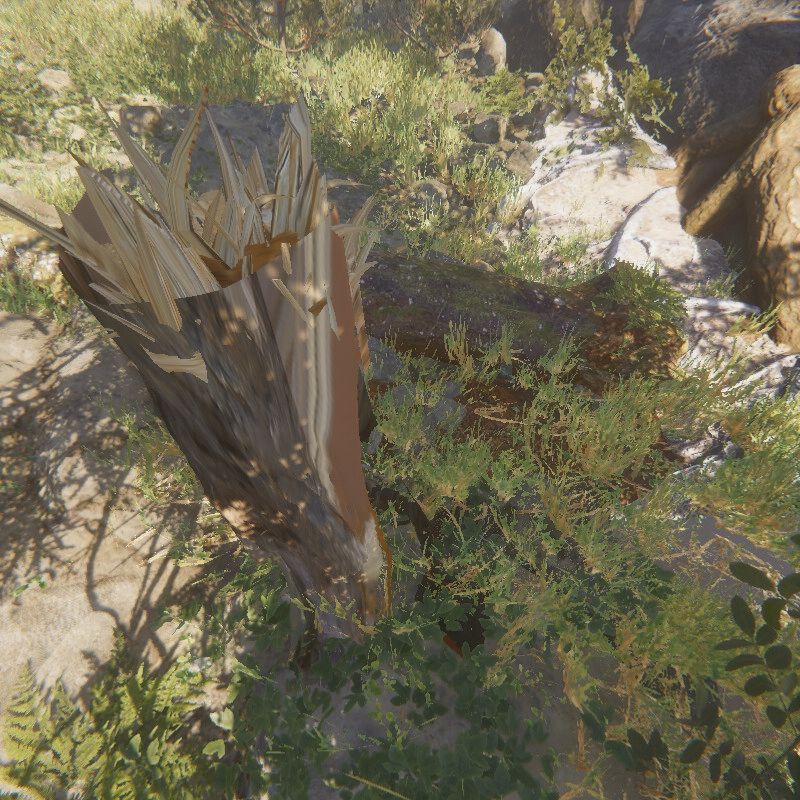
process when new kinds of glitches appear they can readily
be added to the training data by generating more negative
examples.
   Our method uses one image as an input that then will
be classified as correct or faulty with 4 different kinds of
glitches all related to texture malfunctions. To classify the
image a DCNN was used. In recent years, since the widely
used AlexNet was presented (Krizhevsky, Sutskever, and
Hinton 2012), advances like residual networks (He et al.
2016) or dense connections (Huang et al. 2017) have in-
creased the performance of these methods substantially. Al-
though these methods can be highly costly computationally,                 (a) Normal                     (b) Stretched
which was addressed by presenting more lightweight net-
works like ShuffleNet (Zhang et al. 2018).
   In this work, we generate synthetic data and use it to train
different DCNNs into detecting graphical malfunctions. The
main contribution of this paper is showing that DCNNs can
be used to detect glitches effectively, providing one step fur-
ther on automating video game testing. For a more in-depth
discussion, image samples, and analysis see (Garcı́a Ling
2020). In comparison with previous work, (Nantes, Brown,
and Maire 2008) and (Nantes, Brown, and Maire 2013),
where other methods such as multi-layer perceptions, self
organizing maps, or corner detection are used, we propose
a versatile approach that does not need any pre-processing             (c) Low Resolution                 (d) Missing
nor extra information from the game state, but simply a game
capture, and that can be configured for detecting new classes
of glitches by providing adequate samples.

                            Data
The data used for training the models was generated using
the video game engine Unity3D. Accounting for which are
the most common glitches when developing video games,
the data was centered on rendered texture glitches. A texture
is the digital representation of the surface of an object in
3D graphics thus a fundamental part when rendering a video
game scene. They define how the assets in a video game
look like and when missing or incorrectly processed, they             (e) White Placeholder          (f) Pattern Placeholder
can impact the player’s video game experience negatively.
Four different kinds of glitches were synthesized, that can be                     Figure 1: Glitch samples
grouped in corrupted textures, and missing textures. Below,
a description of the glitches and how they are generated:
   Corrupted textures: textures are still rendered in the ob-       Missing Texture: One or more of the textures from the
ject, but due to some error, they are corrupted. We divide        object are not rendered at all, which can be noticed in two
them into two sub-categories:                                     ways.
• Stretched: Due to errors like a wrong texture mapping to        • Missing: When the texture is not rendered due to a mal-
  the object surface or a deformation in the object, the tex-       function in the object the graphical engine renders no de-
  ture is deformed, and characteristic line patterns show in        tails like texture or shadows. This results that the space
  the rendered image. In Unity, the glitches were generated         where the object is located appears as a solid color. This
  by scaling the texture in one random direction (see Figure        is an easy glitch to reproduce as removing the texture will
  1b). Note that in practice this is not exactly what happens       trigger a standard function in respectively game engine.
  in every case since the shape of the object is not deformed.      E.g. in Unity3D the replacing color is a pink monochro-
                                                                    matic placeholder (see Figure 1d).
• Low Resolution: The texture appears as blurry in con-
  trast with other elements of the scene at the same distance     • Placeholder: Often the texture may not be available due
  from the observer. This can occur when lower resolution           to many different reasons. E.g. the texture was not cor-
  texture is loaded with a different LoD (Level of Detail)          rectly loaded, not found in the asset database, not trans-
  e.g. In practice we recreate this glitch by scaling the tex-      ferred, etc. In these cases, while developing the game a
  ture uniformly in every direction (see Figure 1c).                default placeholder texture is used. These are not sup-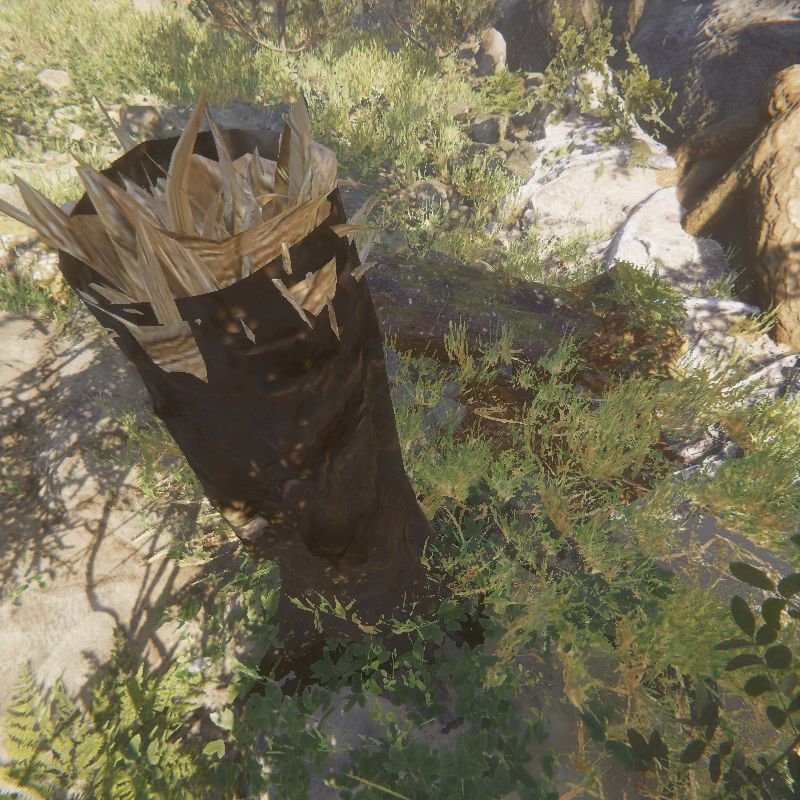
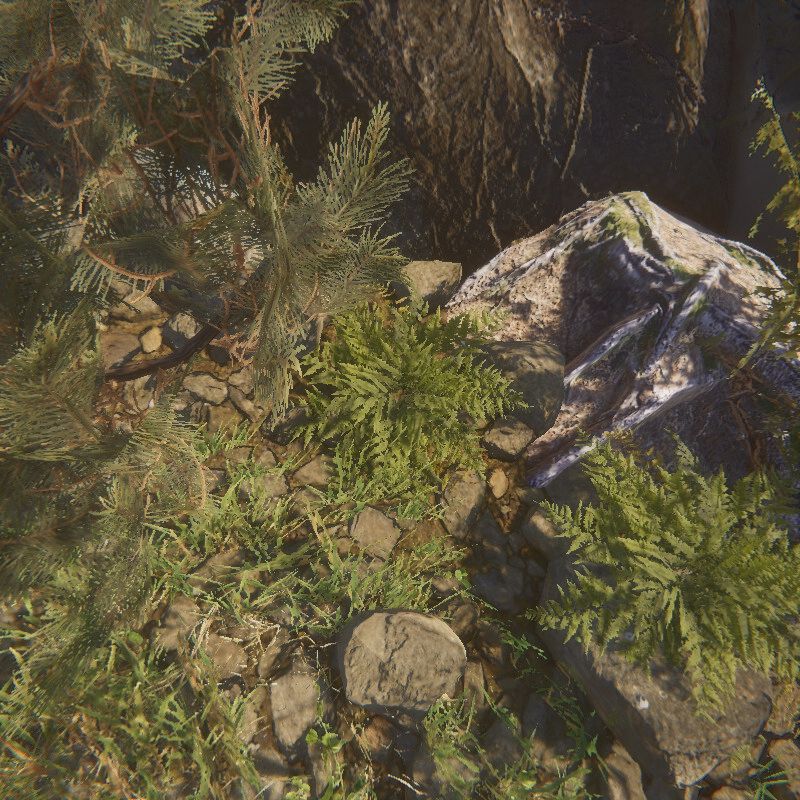
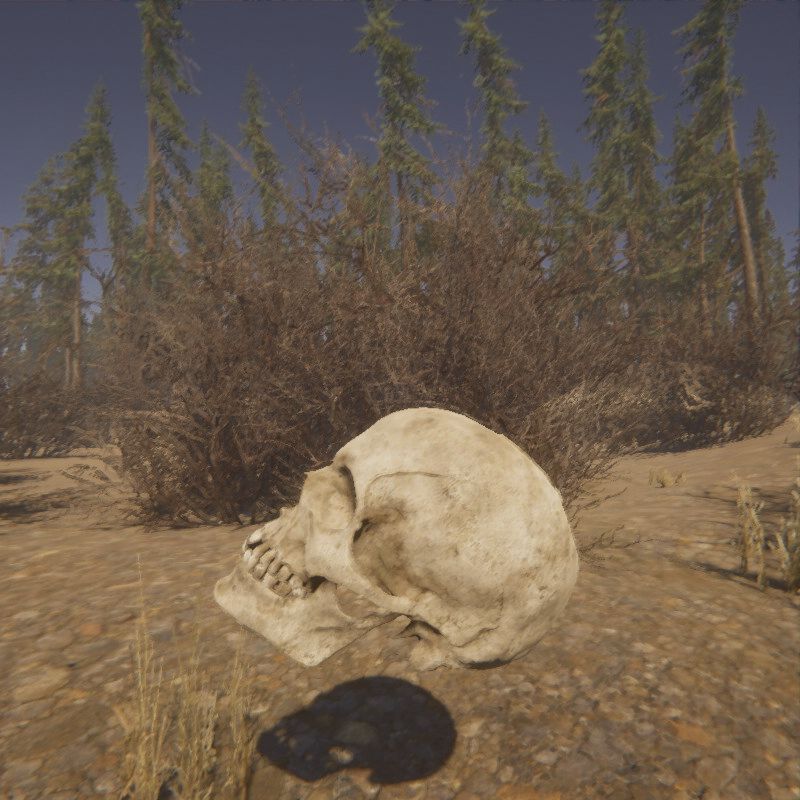
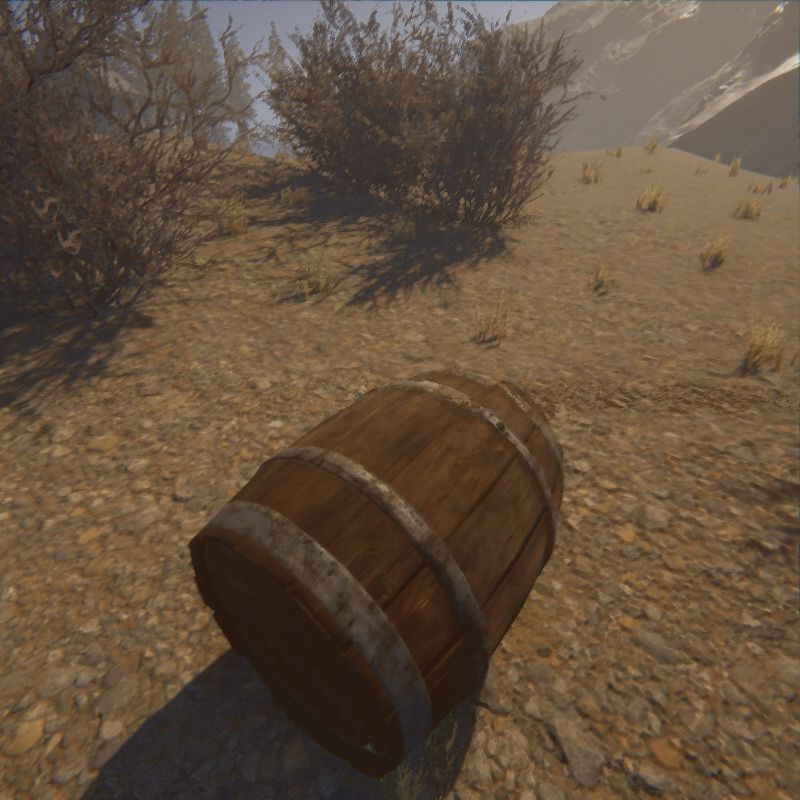
Figure 2: Additional normal samples from Book of the Dead
Environment

  posed to be used in the final version of the game but some-
  times they are not updated to the correct ones resulting in
  faulty images (Compare Figure 1e and 1f). To generate
  these data samples, we substitute the textures in the ob-
  ject for a placeholder. In order to assess how the choice
  of texture affects the performance of the algorithm two
  placeholder versions were generated one plain white (cor-
  responding to the default texture in the used game engine,
                                                                    Figure 3: Normal samples from FPS Sample Environment
  Figure 1e) and another with a checked pattern and letters
  that indicate that is a default texture (Figure 1f). The latter
  solution is often used in order to be more visible to human
  testers.                                                          games mimic to a large extent the real world. It is this prop-
                                                                    erty that motivates why these methodologies also perform
   The dataset generated was balanced with a size of 12700          well in the formulated problem.
samples, 20% of the data were normal samples (Figure 2)                While ImageNet accuracy was an important factor, we
and 80% different kinds of glitches. To capture all the im-         also considered the computational requirements of the net-
ages 127 objects were used meaning that 100 images were             work. Avoiding networks with excessive computation time
taken per object in various angles and distances. The data          will allow running the model in parallel with other tasks,
was generated using assets from the Book of the Dead avail-         like the rendering of the video game images. We trained
able in the Unity3D store. Also, two extra data sets were ob-       state-of-the-art architectures such as VGG, Alexnet, ResNet
tained in the same fashion with elements from Unity3D FPS           etc. Based on this we focused on two representative architec-
Sample (Figure 3) and Viking Village (Figure 4) also avail-         tures ResNet (He et al. 2016) and ShuffleNetV2 (Ma et al.
able in the Unity Asset Store, creating two more data sets          2018) which showed most promising considering accuracy
with respectively 10000 and 11500 samples. In total 34200           and computational resources required. For ResNet different
samples were created. These extra data sets were generated          degrees of complexity were explored by training ResNet18,
to assess the generalizing ability of the method described.         34 and 50 with the number indicating the number of convo-
                                                                    lutional layers. Similarly, for ShuffleNetV2 we explored the
                      Methodology                                   versions x0.5, x1.0, x1.5, x2.0, in increasing order for the
                                                                    number of filters in the layers.
The method proposed uses a DCNN classifier to determine
whether an image contains a glitch or not. As an input an           Training
800x800 color image is provided to the network, this resolu-
                                                                    The implementation of the models was done in Pytorch,
tion was chosen balancing efficiency, and the use case. The
                                                                    based on the implemented models in the Torchvision library.
image is forward passed through a CNN and a vector with
                                                                    The models were modified to adjust to the number of classes
5 components is obtained as an output, these represent the
                                                                    in our problem. In order to fit the model to our data the Adam
probability of the image being normal or a glitch, dividing
                                                                    optimizer (Kingma and Ba 2014) was used, minimizing the
the glitch class in 4 attending on the glitch type
                                                                    cross-entropy loss function, commonly used in the classifi-
                                                                    cation problem. The hyper-parameters of the optimizer such
DCNN Architectures                                                  as the batch size and the learning rate were explored in or-
The network structure for the classifier is one of the most im-     der to determine which was the best configuration for this
portant aspects to consider. To base our decision, we looked        problem. The models were trained for 100 epochs, reaching
at the state-of-the-art networks in classification, paying at-      stable performance after 50 epochs or less.
tention to the performance in ImageNet. We argue that this             Due to the similarity with real images and the known
data set is relevant to our problem since images in video           power of pre-trained models (Huh, Agrawal, and Efros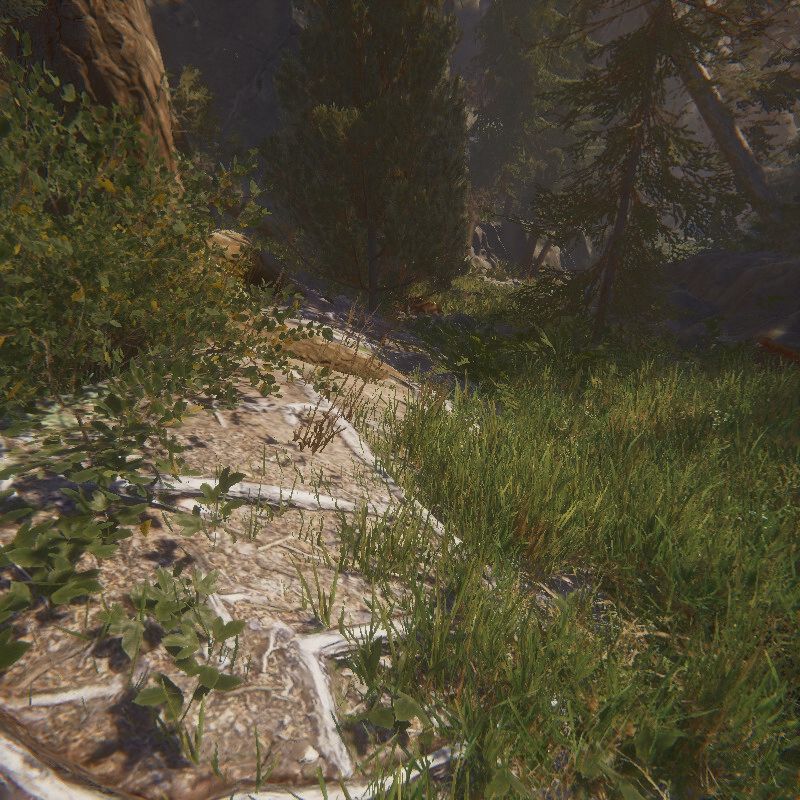
we are using is balanced by construction (all the classes ex-
                                                                   ist in the same proportion) both in the training and validation
                                                                   set, accuracy is not misleading regarding the performance of
                                                                   the model. The accuracy is simply computed as the fraction
                                                                   of samples that whose classes were correctly predicted.
                                                                      Since we can consider this a binary problem (i.e. normal
                                                                   image/glitch image), we can define metrics like: precision
                                                                   (fraction of the elements predicted as glitches that are actu-
                                                                   ally glitches), recall (fraction of the actual glitches that are
                                                                   predicted as glitches), and false positive rate (fraction of the
                                                                   negative samples that are predicted to be positive). These
                                                                   metrics will be provided for the best performing model.
                                                                      Confusion matrices provide detailed information about
                                                                   the behavior of the network. They group the elements into
                                                                   a matrix attending to the original class (rows) and the pre-
                                                                   dicted class (columns). This matrix will be normalized with
                                                                   respect to the original class, meaning that the elements in
                                                                   a row will always add to one. The ideal classifier would
                                                                   have a confusion matrix with ones at the diagonal elements.
                                                                   The confusion matrix provides visibility into which are the
                                                                   classes that are mistaken, giving an insight into why the net-
                                                                   work may be failing.

Figure 4: Normal samples from Viking Village Environment                                      Results
                                                                   We present the results from training the DCNNs with the
                                                                   setting stated in the previous section. Note that the results
2016) the initialization of the networks was done in two dif-      presented in the tables present two numbers. The first corre-
ferent ways: random initialization, using the standard ini-        spond to the average of the metric during the last 20 epochs
tialization, and pre-trained weights on ImageNet as starting       and second is standard deviation (in parenthesis). Similarly,
point.                                                             the confusion matrices present the average of the 20 last
   The core data used was provided by the environment from         epochs, providing a more stable result.
the Book of the Dead assets, however, in order to asses the           First, we compared different DCNN architectures and de-
capacity of the model additional data from the other envi-         cided to focus in two networks that provided the best results
ronments (mentioned in the previous section) was also used.        while being most performant: ResNet and ShuffleNet v2. Ta-
Also, the model was applied to other data sets to asses how        ble 1 presents a comparison between these selected models;
the approach would work in different environments.                 here, we focus on the accuracy and we highlight the differ-
   To validate the model the separation between training and       ences between using the weights of a network pre-trained in
validation data set was done attending to the objects. This        ImageNet as a starting point and a random initialization. We
means that all the images correspondent to one object are          also show the differences for this metric between the training
present in either the training or validation set but not in both   set and the validation set. Another feature which is relevant
at the same time, which gives more validity to the perfor-         is the execution time.
mance observed in the validation set. For all the training runs       The results show some significant findings. First, we see
20 % of the objects are placed in the validation set while the     an improvement when using pretrained models for all the
remaining 80% is used for training. Although different splits      networks, which can be linked to the similarity of our sam-
were used obtaining similar results, in the results section,       ples to natural images. Another characteristic noted is the
the same partition is used allowing for direct comparison          difference between the performance in training and valida-
between the different training configurations.                     tion, we can clearly see that the model overfits the data. This
                                                                   indicates that the models may be too big in relation to the
Metrics                                                            amount of data, which leads to overfitting. Note that the
To assess the performance of the model, different metrics          data set used in this paper was relatively small with 12700
were deployed. These metrics should be intuitive and easy          samples. Lastly, we found that the model which works best
to interpret giving allowing for a correct understanding of        for this task is ShuffleNetV2 due to both, its better per-
the model is performing (Powers 2011). The cross-entropy           formance and execution time. As a note, we would like to
loss was used to fit the networks, but its interpretation is not   state that complexity regarding the ShuffleNetV2 structure
straightforward since it takes arbitrarily high values, and it     was assessed and as with ResNet no significant differences
does not only depend on whether the prediction obtained            in performance were discovered. Other architectures were
matches the original label but also on the probability as-         also evaluated: VGG (Simonyan and Zisserman 2014) and
signed to this prediction. Instead, we will take accuracy as       AlexNet (Krizhevsky, Sutskever, and Hinton 2012) provided
the main metric to compare different models. Since the data        worse results, while MobileNet v2 (Sandler et al. 2018)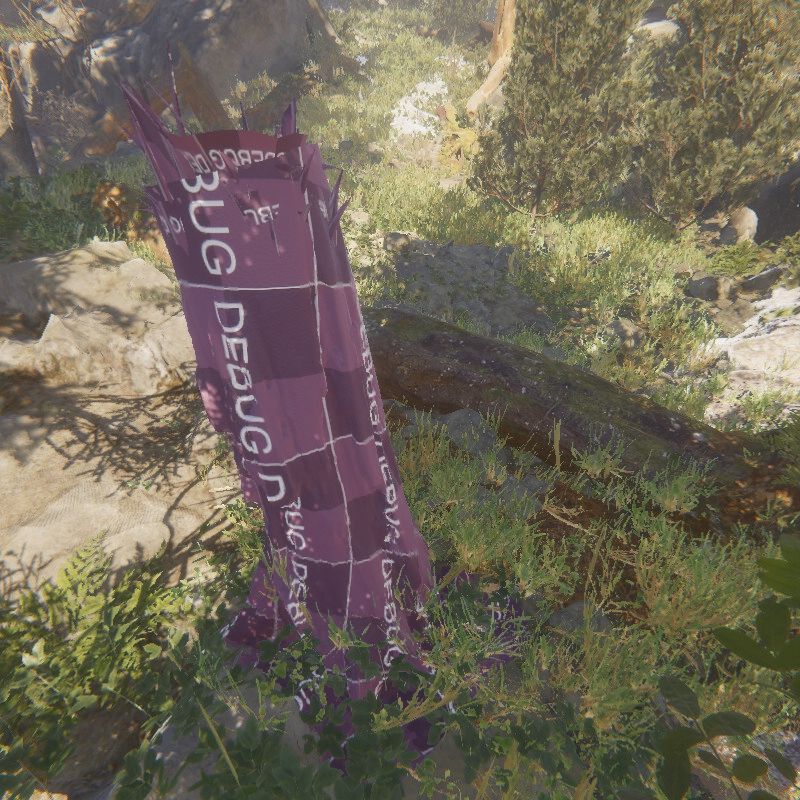
Table 1: Comparison of the performance and computation time for the different networks considered. All networks were trained
using batch size (8) and learning rate (10−3 )

           Network                                    ResNet18          ResNet34         ResNet50          ShuffleNetV2
           Accuracy (Random Init. Validation)         0.674 (0.012)     0.642 (0.006)    0.671 (0.018)     0.617 (0.007)
           Accuracy (Pretrained Validation)           0.721 (0.014)     0.719 (0.017)    0.724 (0.031)     0.767 (0.014)
           Accuracy (Pretrained Training)             0.958 (0.006)     0.951 (0.007)    0.886 (0.015)     0.970 (0.004)
           Execution Rate                             60 fps            60 fps           45 fps            60 fps

                 Table 2: Exploration of the learning rate parameter: ShuffleNet v2 with constant batch size 8

                   Learning Rate              10-2               10-3             10-4             10-5
                   Accuracy (Validation)      0.715 (0.015)      0.767 (0.014)    0.801 (0.012)    0.791 (0.007)

      Figure 5: Confusion Matrix: White Placeholder                         Figure 6: Confusion Matrix: Pattern Placeholder

achieved similar performance as ShuffleNet v2, although               was regarding the placeholder texture. When using a white
with slower training times. We would like to remark that              placeholder texture, the network learns to recognize white
this is an open problem in computer vision and incoming               elements as glitches, misclassifying images with white el-
research may provide more accurate and fast architectures.            ements (Figure 5). A bit surprisingly, using a recognizable
   We also explored the hyperparameter space when fitting             pattern for the placeholder reduced misclassification in other
the models with a focus on the network that we found to               classes as well, this can be seen in Figure 6. We reason this is
perform best, i.e. ShuffleNetV2. To explore the learning rate,        due to the fact that low-res and stretched textures can some-
we tried 4 different values equally spaced in a logarithmic           times resemble a plain texture allowing the network to clas-
scale. The results are compiled in Table 2 focusing in the            sify low-res and stretched texture better when it does not
accuracy of the validation set. There we see that the optimal         resemble the placeholder one. In general the confusion ma-
value for this task was 10−4 .                                        trices allow us to see which classes the network struggles to
   The batch size used in the Adam optimizer was also ex-             classify. The glitches with the best performance correspond
plored, again with equally spaced values in a logarithmic             to those that are easily perceived the missing texture group,
scale. The results are presented in Table 3. The maximum              while the corrupted textures present more confusion.
batch size used was restricted by the graphics card used but             The best performance achieved was when using a recog-
we can see the pattern of an increasing accuracy with the             nizable pattern as a placeholder texture (Figure 6). Here we
batch size.                                                           achieve an average (for the last 20 epochs) of 86.8% accu-
   Another aspect that improved notably the performance of            racy with a 6.7% false positive rate and a recall of 88.1%.
the networks was using better data, the clearer improvement           Note that for the recall we consider the binary problem, there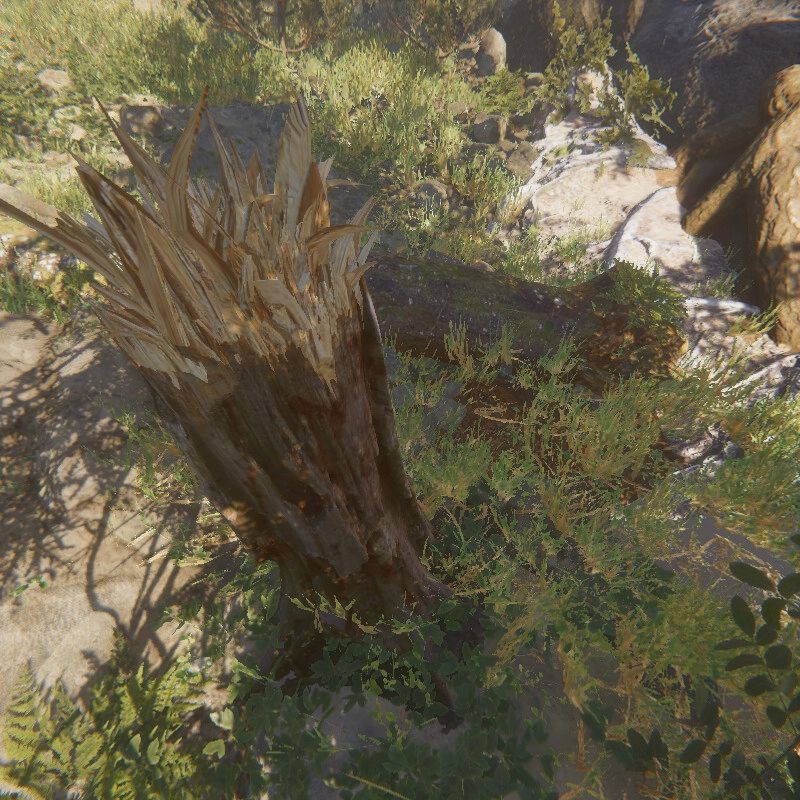
Table 3: Exploration of the batch size parameter: ShuffleNet v2 with constant learning rate 10−4

                   Batch Size                 4                  8                16                32
                   Accuracy (Validation)      0.791 (0.012)      0.804 (0.012)    0.805 (0.011)     0.819 (0.006)

               Table 4: Performance on different data sets: ShuffleNet v2, batch size 32 and learning rate 10−4

              Dataset                    Book of the Dead        FPS Sample      Viking Village     All (Val on BotD)
              Accuracy (Validation)      0.819 (0.006)           0.852 (0.010)   0.807 (0.005)      0.802 (0.008)

is no difference if a glitch is predicted in the wrong glitch         Table 5: Performance aggregating images from the same ob-
class if it is predicted as a glitch.                                 ject for classification.
   Next we present the results for the other environments. In
the Data section we describe how we generated other data                      # Images      1        2        10        20
sets, in Table 4 we can see the performance of the proposed                   Accuracy      0.832    0.851    0.861     0.864
framework with different data sets, seeing how this is simi-
lar for all the data sets, this indicated that this method may
be successfully applied to different video game styles. With          for the U-Net, FCN and Deep Lab V3 structures, defined as
Book of the Dead and Viking Village presenting more real-             the fraction of the glitches with a Intersection over Union
istic looking assets, while the dataset based on FPS Sam-             score higher than 0.5, much lower when comparing with
ple represent a stylized looking game. Although, the styles           classification and taking Recall as an equivalent metric.
of video games represented in this study are not extensive               Although the low performance could be partially ex-
and further research may be needed to assess if this can be           plained due to difficulties found in defining an adequate la-
generalized to other types of environments. We also provide           bel, this setting was deemed not the most adequate in com-
the performance on Book of the Dead when the data set is              parison with the classification approach.
trained in all the data sets here we see that the performance
is lower, which indicates that is advisable to train the model        Aggregate images One of the biggest advantages when
in the environment that it will be applied rather than having         working with video game images and anomaly detection is
one general model.                                                    the total control over the camera. This provides our models
                                                                      with more information for each object, like capturing several
Refined model                                                         images from different angles, lighting conditions, distances,
                                                                      etc. In Table 5 we present the results obtained when using
In this subsection we present modifications applied in our            several images for classifying an object. The probabilities
work and briefly discuss their potential contribution in the          for each class are computed averaging the probabilities ob-
problem formulated.                                                   tained from the network. We do notice an improvement even
Grouping The glitches generated can be divided into two               when just using 2 images instead of 1, note that this slows
groups: corrupted and missing textures. The problem is then           down as the number of images increases.
defined as a 3 class classification problem. Also, considering
only correct and faulty types, a binary classification prob-          Confidence Measures In a real use case when testing a
lem can be defined. These other setting were tried with no            video game, particularly in later phases of the development,
improvement in performance. As the differences in compu-              glitches may be scarce, which makes preventing false pos-
tation and memory costs are negligible between these for-             itives important. One of the problems of Neural Networks
mulations, the 5 class setting was deemed optimal, since it           in classification is that the probability for each class has to
provided more information.                                            add to one, providing high probabilities even when doing big
Semantic Segmentation The classification approach pro-                extrapolation.
vides limited information on the glitches detected, since no             In this work we have investigated the confidence measure
localization is provided. In contrast, Semantic Segmentation          presented in (Hess, Duivesteijn, and Mocanu 2020) (Gauss-
can provide pixel-wise classification and has been object             Confidence) for its ability to reduce false positives. When
of successful research in recent years (Garcia-Garcia et al.          applied to this problem we obtain higher confidences for
2017). Thus, we have also considering relevant state of the           for missing and placeholder glitches having mean values
art Segmentation structures to approach this problem: U-Net           of 0.643 and 0.633 respectively, and lower values of 0.259
(Ronneberger, Fischer, and Brox 2015), Fully Convolutional            and 0.202 for stretched and lower resolution textures respec-
Networks (FCN) (Long, Shelhamer, and Darrell 2015) and                tively. From this we propose using the confidence measure
Deep Lab V3 (Chen et al. 2017).                                       as a potentially effective method to filter out false positives.
   Although highly informative, this approach is compu-                  Furthermore, when using this the confidence measure
tationally and memory expensive, and gave substantially               could be used as a signal to acquire more images (using the
worse results in this problem domain. Obtaining values for            same technique in previous section) from the object in order
the Detection Rate of 0.266, 0.441, and 0.559 respectively            to increase the confidence.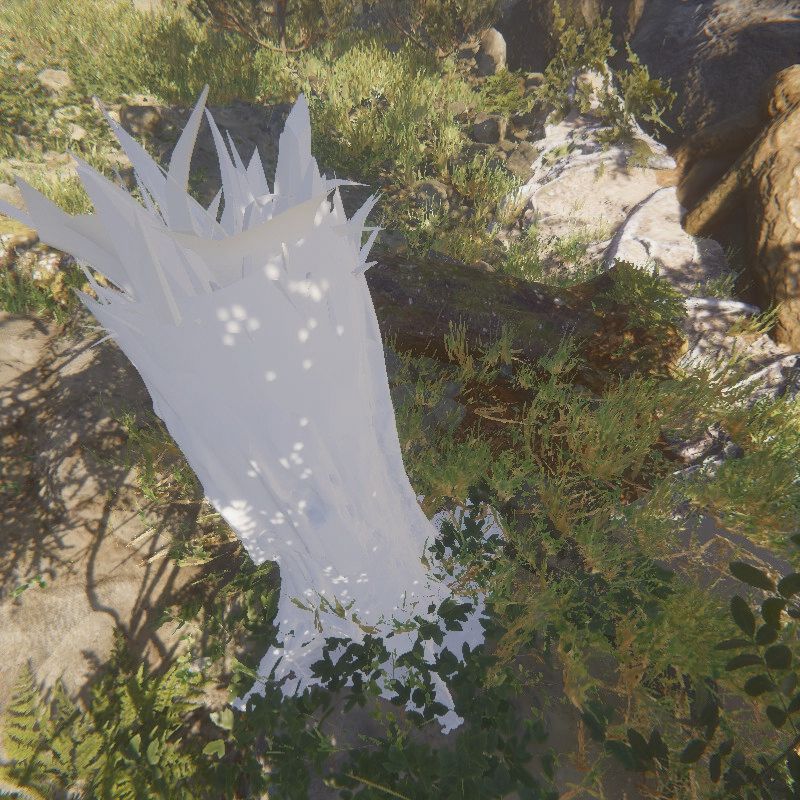
Future Work                                 that human testers also tend to get wrong. Similarly, from
As mentioned, one of the shortcomings of this approach is          experience, human testers tend to classify low resolution as
the lack of localization information. Although semantic seg-       false-positive more than the other classes.
mentation was tested further research may be conveyed to              Furthermore, since the methods presented are trained di-
further assess the viability of this approach. Object detection    rectly in the images from the game, glitch detection is pre-
could be a good alternative to provide certain localization        sented as an independent tool, providing high versatility
information, together with fast computation time, as an area       when used in the actual testing pipeline. This will allow
with broad successful research in recent years (Zou et al.         for diverse uses like processing all the images during a
2019) and structures like YOLO V4 (Bochkovskiy, Wang,              game play, scripting a camera focusing only on specific in-
and Liao 2020) that allow for real time object detection.          stances, or running completely separated from the game us-
   The presented approach mainly recognizes the type of            ing recorded images.
glitches which the network was trained on, thus it will tend          One of the main limitations of the method presented is
to miss issues which was not in the training data. Here unsu-      being supervised which means that specific data exemplify-
pervised and semi-supervised anomaly detection approaches          ing both normal and anomalous images must be provided.
could offer a way of detecting unseen graphical anomalies.         Although some level of extrapolation was displayed by the
Nevertheless, applying these methods is not a trivial task es-     model, this approach would be less useful during the first
pecially when dealing with high dimensional data as it is in       stages of game development since no data is available. These
the case of images but it is certainly an interesting venue of     methods become more effective in the later stages of the
research.                                                          development when operations like migrating to a new ver-
   Furthermore, combining this graphical ML approach with          sion (other console platforms / graphical engine updates) or
logical testing using reinforcement learning (Bergdahl et al.      adding new objects to the game, both cases in which sample
2020) could offer interesting synergy effects. For example,        data is available to train the model.
connecting the reward signal of an automated testing agent            On the other hand, in this work, we have only explored
to the number of graphical glitches it finds, can potentially      one of many possible approaches to the problem, by restrict-
make it more effective in seeking out graphical bugs in the        ing ourselves to a very particular subset of glitches. Further
game at the same time providing more training data to the          research is needed to asses whether other problems in testing
supervised model.                                                  could also be addressed, focusing on other kinds of glitches,
                                                                   and not only limited to static images but also including video
                        Conclusion                                 sequences.

This study presents an approach for detecting graphical
anomalies in video game images. Making use of a super-                               Acknowledgements
vised approach with a DCNN we were able to detect 88.1 %           The authors would like to thank Cristian Deri, Jan Schmid,
of the glitches with a false positive rate of 6.3 %. These re-     Jesper Klittmark (EA DICE) for the valuable feedback and
sults give confidence that we can use such models in a test-       providing us with data.
ing environment to detect graphical malfunctions. On top
of that several considerations regarding data, architecture,
hyper-parameters, and network initialization are discussed                                 References
providing general guidelines for future methods addressing         Ahmed, M.; Mahmood, A. N.; and Islam, M. R. 2016. A
the problem. We have seen that this method is highly data-         survey of anomaly detection techniques in financial domain.
dependent with better generalization with a growing amount         Future Generation Computer Systems 55:278–288.
of data. On the other hand in a modern game with thousands
of assets and environments, generating a diverse training set      An, J., and Cho, S. 2015. Variational autoencoder based
is relatively easy which makes this a valid approach in mod-       anomaly detection using reconstruction probability. Special
ern game production.                                               Lecture on IE 2(1).
   Therefore, the conclusion of this paper is that DCNNs can       Bergdahl, J.; Gordillo, C.; Tollmar, K.; and Gisslén, L. 2020.
be used in a production environment to improve the testing         Augmenting automated game testing with deep reinforce-
process in video games, partially automating a now manual          ment learning. In 2020 IEEE Conference on Games (CoG),
process. The architecture used was able to evaluate images         1–8. IEEE.
at a rate of 60 fps, being computationally light enough to run     Bochkovskiy, A.; Wang, C.-Y.; and Liao, H.-Y. M. 2020.
in parallel with the rendering allowing for real-time assess-      Yolov4: Optimal speed and accuracy of object detection.
ment on the video quality. Another interesting find is that        arXiv preprint arXiv:2004.10934.
default fall-back placeholder textures with a recognisable
pattern to a human, is also improving the classification rate      Chalapathy, R., and Chawla, S. 2019. Deep learn-
significantly. Unlike blob detection techniques that detects       ing for anomaly detection: A survey. arXiv preprint
certain colors, the same reasoning applies as for humans: in       arXiv:1901.03407.
order to more easily detect errors, it is better to use a recog-   Chandola, V.; Banerjee, A.; and Kumar, V. 2009. Anomaly
nizable pattern than a plain color. Also, we found that low        detection: A survey. ACM computing surveys (CSUR)
resolution textures scored the lowest accuracy is something        41(3):15.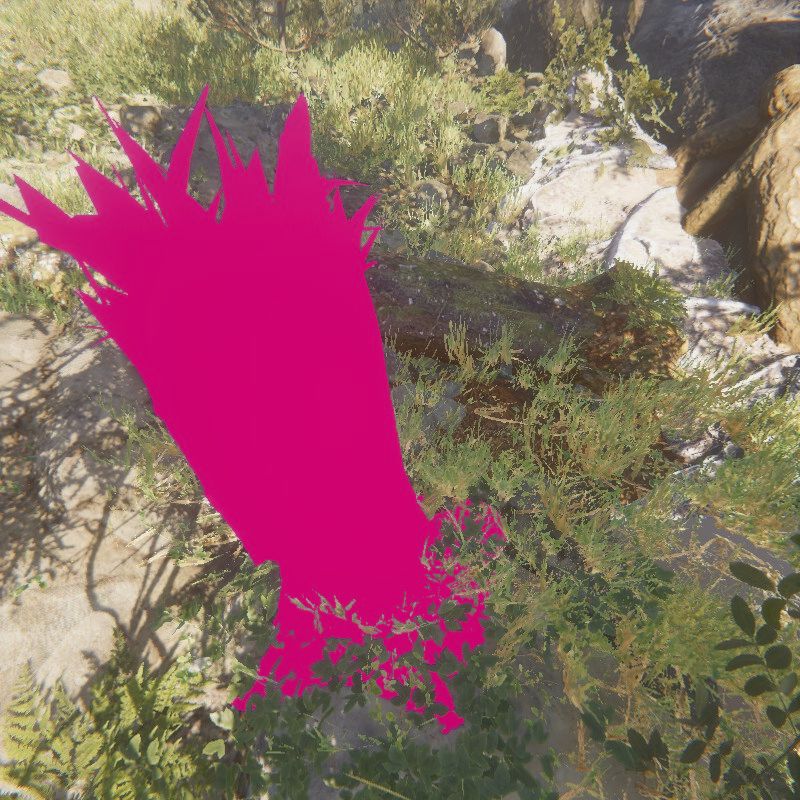
Chen, L.-C.; Papandreou, G.; Schroff, F.; and Adam, H.           Schlegl, T.; Seeböck, P.; Waldstein, S. M.; Schmidt-Erfurth,
2017. Rethinking atrous convolution for semantic image           U.; and Langs, G. 2017. Unsupervised anomaly detection
segmentation. arXiv preprint arXiv:1706.05587.                   with generative adversarial networks to guide marker dis-
Garcia-Garcia, A.; Orts-Escolano, S.; Oprea, S.; Villena-        covery. In International conference on information process-
Martinez, V.; and Garcia-Rodriguez, J. 2017. A review on         ing in medical imaging, 146–157. Springer.
deep learning techniques applied to semantic segmentation.       Simonyan, K., and Zisserman, A. 2014. Very deep convo-
arXiv preprint arXiv:1704.06857.                                 lutional networks for large-scale image recognition. arXiv
Garcı́a Ling, C. 2020. Graphical glitch detection in video       preprint arXiv:1409.1556.
games using cnns.                                                Sultani, W.; Chen, C.; and Shah, M. 2018. Real-world
He, K.; Zhang, X.; Ren, S.; and Sun, J. 2016. Deep resid-        anomaly detection in surveillance videos. In Proceedings
ual learning for image recognition. In Proceedings of the        of the IEEE Conference on Computer Vision and Pattern
IEEE conference on computer vision and pattern recogni-          Recognition, 6479–6488.
tion, 770–778.                                                   Zenati, H.; Foo, C. S.; Lecouat, B.; Manek, G.; and Chan-
Hess, S.; Duivesteijn, W.; and Mocanu, D.               2020.    drasekhar, V. R. 2018. Efficient gan-based anomaly detec-
Softmax-based classification is k-means clustering: For-         tion. arXiv preprint arXiv:1802.06222.
mal proof, consequences for adversarial attacks, and im-         Zhang, X.; Zhou, X.; Lin, M.; and Sun, J. 2018. Shuf-
provement through centroid based tailoring. arXiv preprint       flenet: An extremely efficient convolutional neural network
arXiv:2001.01987.                                                for mobile devices. In Proceedings of the IEEE conference
Huang, G.; Liu, Z.; Van Der Maaten, L.; and Weinberger,          on computer vision and pattern recognition, 6848–6856.
K. Q. 2017. Densely connected convolutional networks. In         Zou, Z.; Shi, Z.; Guo, Y.; and Ye, J. 2019. Object detection
Proceedings of the IEEE conference on computer vision and        in 20 years: A survey. arXiv preprint arXiv:1905.05055.
pattern recognition, 4700–4708.
Huh, M.; Agrawal, P.; and Efros, A. A. 2016. What
makes imagenet good for transfer learning? arXiv preprint
arXiv:1608.08614.
Kingma, D. P., and Ba, J. 2014. Adam: A method for
stochastic optimization. arXiv preprint arXiv:1412.6980.
Krizhevsky, A.; Sutskever, I.; and Hinton, G. E. 2012.
Imagenet classification with deep convolutional neural net-
works. In Advances in neural information processing sys-
tems, 1097–1105.
Long, J.; Shelhamer, E.; and Darrell, T. 2015. Fully con-
volutional networks for semantic segmentation. In Proceed-
ings of the IEEE conference on computer vision and pattern
recognition, 3431–3440.
Ma, N.; Zhang, X.; Zheng, H.-T.; and Sun, J. 2018. Shuf-
flenet v2: Practical guidelines for efficient cnn architecture
design. In Proceedings of the European Conference on Com-
puter Vision (ECCV), 116–131.
Nantes, A.; Brown, R.; and Maire, F. 2008. A framework
for the semi-automatic testing of video games. In AIIDE.
Nantes, A.; Brown, R.; and Maire, F. 2013. Neural network-
based detection of virtual environment anomalies. Neural
Computing and Applications 23(6):1711–1728.
Powers, D. M. W. 2011. Evaluation: From Precision, Re-
call and F-Measure to ROC, Informedness, Markedness &
Correlation. Journal of Machine Learning Technologies
2(1):37–63.
Ronneberger, O.; Fischer, P.; and Brox, T. 2015. U-net:
Convolutional networks for biomedical image segmentation.
In International Conference on Medical image computing
and computer-assisted intervention, 234–241. Springer.
Sandler, M.; Howard, A.; Zhu, M.; Zhmoginov, A.; and
Chen, L.-C. 2018. Mobilenetv2: Inverted residuals and lin-
ear bottlenecks. In Proceedings of the IEEE conference on
computer vision and pattern recognition, 4510–4520.
You can also read