MODELING THE EXPECTED SHORT-TERM DISTRIBUTION OF NEW HIV INFECTIONS BY MODES OF TRANSMISSION
←
→
Page content transcription
If your browser does not render page correctly, please read the page content below
Guidelines | 2012

Modeling the Expected
Short-Term Distribution of
New HIV Infections by Modes
of Transmission
Acknowledgements

The initial spreadsheet was developed by the UNAIDS
Reference Group on HIV Estimates, Modelling and
Projections in 2002, and was revised and prepared for
country application by UNAIDS in 2005. The model was
updated by UNAIDS in 2011 to include the impact of
antiretroviral therapy and to incorporate uncertainty
analysis. The method for conducting uncertainty analysis
was developed by the Futures Institute in 2009.

The model is based on formulae of Weinstein et al and
employed in the model Avert.

UNAIDS / JC2427E (English original, October 2012)
ISBN 978-92-9173-997-4

Copyright © 2012.
Joint United Nations Programme on HIV/AIDS (UNAIDS).
All rights reserved. Publications produced by UNAIDS can be
obtained from the UNAIDS Information Production Unit.
Reproduction of graphs, charts, maps and partial text is
granted for educational, not-for-profit and commercial
purposes as long as proper credit is granted to UNAIDS:
UNAIDS + year. For photos, credit must appear as:
UNAIDS/name of photographer + year. Reproduction
permission or translation-related requests—whether
for sale or for non-commercial distribution—should be
addressed to the Information Production Unit by e-mail at:
publicationpermissions@unaids.org.
The designations employed and the presentation of the
material in this publication do not imply the expression of
any opinion whatsoever on the part of UNAIDS concerning
the legal status of any country, territory, city or area or of its
authorities, or concerning the delimitation of its frontiers or
boundaries.
UNAIDS does not warrant that the information published
in this publication is complete and correct and shall not be
liable for any damages incurred as a result of its use.
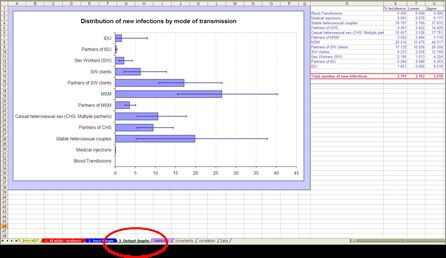
table of contents

                                                          Acknowledgements
                                                                     Summary       2
                                                                    Objectives     2
                                                                   Limitations     3
                             Overview of Modes of Transmission Spreadsheet         4
                                                 Instructions for MOT analysis     5
                                                                Data required      5
                                                    1. Size of risk populations    7
                      2. Current estimated HIV prevalence by risk population       7
      3. Prevalence of sexually-transmitted infections (STI) by risk population    8
              4. Average number of partners per year in each risk population       8
5.Average number of acts of potential HIV risk exposures per partner per year      9
                6. Average percentage of acts of exposure that are protected       9
                                          7. Coverage of antiretroviral therapy   10
                                                          8. Male circumcision    11
                            9. Transmission probability per risky exposure act    11
            Effect of Sexually Transmitted Infections (STI) on HIV transmission   12
                                      Examine the resulting incidence pattern     13
                                                          Uncertainty analysis    14
                                                                     Methods      14
                                  Steps in the uncertainty estimation process     15
                                       Model outputs with uncertainty ranges      17
                                 Step by step summary of uncertainty analysis     18
                                                                    Discussion    19
                                                  Validation of model outputs     20
                                                                  Appendix A      21
                                                           Model assumptions      21
                                                     Potential sources of data    22
                              Data on screening of blood transfusions (WHO)       23
                                                                  Appendix B      24

                                                        Uncertainty analysis:
General guidelines on how to assign ranges on the user-specified input values     24
                                                                   References     26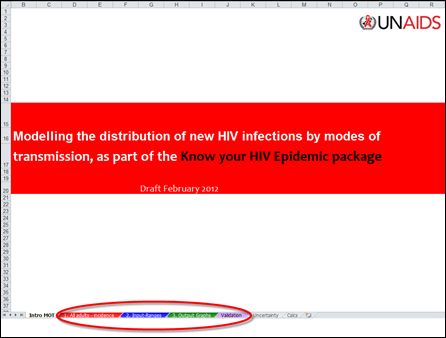
Summary

The “Modes of Transmission” model (MoT) is a simple mathematical model
that was first developed by the UNAIDS Reference Group on Estimates,
Modelling and Projections1 to help countries estimate the proportion of
new HIV infections that occur through key transmission modes using basic
epidemiological and behavioural data as input. Initial application of the
model1, 2 illustrated the variation in patterns of new infections between
countries and argued that this type of in-country application could be used
to inform the planning of appropriately targeted responses.

Application of the model has since been recommended as part of the “Know
your Epidemic / Know your Response” (KYE/KYR) initiative by UNAIDS,
which aims to help countries become more systematic in their approach
to prevention, i.e., using strategic information to make evidence-informed
decisions related to planning appropriate responses to the HIV epidemic.

The first step in the proposed KYE/KYR process involves a comprehensive
review of available epidemiological data to examine patterns and trends in
the general and high risk populations and to describe associated behaviours
and other risk factors.i The results of this review are then utilized in the
second step to model the HIV incidence by mode of transmission through
application of the MoT model. The third step involves a review of the
current prevention response and resource allocation to determine the
degree of alignment between the distribution of new infections by mode of
transmission and resource allocation. Finally, this information can be used
by policy makers to more effectively plan the national prevention response.

Objectives

The objective of the MoT spreadsheet model is to help countries calculate
the expected number of new HIV infections over the coming year on the
basis of a description of the current distribution of prevalent infections and
patterns of risk within different populations. The model firstly allows the
user to identify those risk groups among whom most of the new infections
are likely to occur and secondly to use this information to plan and help
focus appropriate intervention strategies.

i
 An Epidemiology Review toolkit has been developed to help countries determine if relevant data are
available and to assess the quality of the available data. The current recommendation is that availability
and quality of data should first be assessed to determine if a country is ready and if data are adequate
for application for the model. The tool and manual are available at www.unaids.org

2
Methods

The Modes of Transmission model uses
     the current prevalence of HIV infection,
     the numbers of individuals with particular exposures, and
     the rates of these exposures
to calculate the expected incidence of HIV infection over the coming year.

The user of the spreadsheet has to provide biological and behavioural
surveillance data to inform the values in the cells for the spreadsheet. Some
of these may be reasonably well estimated, whereas others may be poorly
specified. Default estimates of transmission probability per contact are based
on reviews of published literature, but can also be specified by the user.

The adult population can be divided into groups with different risks of
acquiring HIV (see below). By estimating the size of these risk groups and
their exposure to HIV infection (i.e. the extent of behaviours which allow
for the transmission of HIV and the prevalence of HIV infection among
their contacts) we can identify where most new HIV infections will occur.

The model is described in more detail in Appendix A.

Limitations

The model uses crude groupings of the population according to their main
exposure to HIV infection. The results are only as good as the data entered
in the spreadsheet on the estimated sizes of the risk groups, the current
prevalence of HIV and other sexually transmitted infections, and the
average risk behaviours within these groups. Even with reliable estimates
the model does not take account of the distribution of behaviours within
the risk groups, the patterns of mixing by demographic, social, geographic
and economic variables and the influence of specific sexually transmitted
diseases. It should therefore not be used to generate accurate predictions
without a full description of these many complexities. Nonetheless, it does
allow the user to identify where most of the new HIV infections are likely
to be found and the relative orders of magnitude of the incident infections
possible within risk groups. Furthermore, it allows users to see the type of
data required, even for crude predictions, and therefore to identify the data
gaps and areas in need of further data collection. The coverage and focus
of the interventions can also be explored and the benefits of both increased
coverage and efficacy can be illustrated.

Modeling the Expected Short-Term Distribution of New HIV Infections by Modes of Transmission | UNAIDS   3
Overview of Modes of
Transmission Spreadsheet
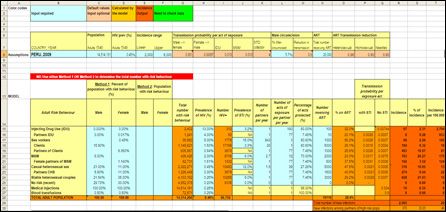
The MoT Excel spreadsheet consists of several worksheets, as shown in NOTE:
Figure 1:
Because of the
uncertainty associated
1. “All adults – incidence”. This is the main page on which the Modes of with the input
Transmission analysis is performed and on which key data inputs need parameters, it is
to be provided. essential to always
report MoT results with
2. “Input-Ranges”. Uncertainty ranges on each of the input parameters uncertainty bounds.
are required on this page, which allows running the uncertainty
analysis from this page.
3. “Output Graphs”. The final results (distribution of new infections
by modes of transmission) with uncertainty bounds are displayed on
this page.
4. “Validation”. If other sources of information on new HIV infections
by modes of transmission are available, the results can be entered on
this page as a way to compare or validate the MoT outputs.
Figure 1. The MoT spreadsheet consists of different worksheets
4Instructions for MoT analysis
Data required
The lay-out of the model is shown in Figure 2. User-specified inputs for
the model are required for the cells with a light blue background and are
optional for the cells that are colored light orange. The cells with a dark
orange background are program outputs and contain formulae so the
contents of these cells should not be changed.
Application of the model starts with providing the adult (aged 15-49 years)
population size (cell C8), the estimated HIV prevalence (Cell D8) and
an estimated range in which the adult incidence is expected to fall. This
information can typically be obtained from the latest national estimation
round (e.g. using the Spectrum software).
The model categorizes the adult population aged 15-49 years into groups
according to their main source of exposure to HIV. Children are not
included in this spreadsheet.
The risk groups are defined as:
Row 15 Injecting drug users (IDU): adults (men and women) who are
currently injecting, or have in the past 12 months injected drugs
Row 16 The regular sex partners of those who inject drugs
Row 17 Female sex workers (FSW): adult women who have exchanged
sex for money in the last 12 month
Row 18 Clients of female sex workers: adult men who have paid for sex
with a sex worker in the last 12 months
Row 19 The regular, non-commercial, sex partners of clients of sex
workers
Row 20 Men who have sex with men (MSM): adult men who have had
sex with another man in the last 12 months
Row 21 The regular female sex partners of those MSM who also have sex
with women
Row 22 Casual heterosexual sex (CHS): Those adults (men and women)
who have had more than one sexual partner in the last 12 months
Modeling the Expected Short-Term Distribution of New HIV Infections by Modes of Transmission | UNAIDS 5Row 23 The regular, spousal or cohabiting, sex partners of those who
engage in casual heterosexual sex
Row 24 Stable heterosexual couples: Those adults who are currently in
stable heterosexual relationships, i.e., adults with current low-risk
behaviour (including those with former high-risk behaviour)
Row 25 No risk: Adults who have been at no risk of acquiring HIV in the
last year, i.e., those who do not inject drugs and are not currently
involved in any sexual activity.
Row 26 Medical injections: Adults who have received at least one medical
injection in the last 12 months. In the absence of data it can be
assumed to include the total adult population.
Row 27 Blood transfusion: Adults who received a blood transfusion in the
last 12 months
Figure 2. Spreadsheet for estimating incidence of HIV infection by modes of
transmission.
For each risk group a number of variables are required, as shown in Figure
2 (columns C to N) and discussed below. Examples of potential data
sources to inform these variables are provided in Appendix A (Table A1).
61. Size of risk populations
Definition: The number of people who engage in the specific risk
behaviours and for whom this is the main source of HIV infection risk.
Note that people can only be counted in one of the risk groups (with the
exception of medical injections and blood transfusions), even though they
may have several different means of exposure. In the case of overlapping
risk behaviours, people should be placed in the category where they are at
highest risk (for example FSW who also inject drugs should be counted in
the IDU category as the risk of infection through injecting drugs is higher
than through sex work). Note that the “medical injections” and “blood
transfusions” groups are counted independently.
To be provided in cells C15 to F27
Either the percentage of males and females with a certain risk
behaviour (cells C15 to D27) or the absolute numbers of males and
females with a certain risk behaviour (cells E15 to F27) need to be
filled in. This information will be used to calculate the total number of
adults with a certain risk behaviour, given in cells G15 to G27.
The ‘risk groups’ are defined according to the main source of exposure
to HIV. For medical injections, if data are not available, it can be
assumed that the entire adult population is “exposed”.
If a particular risk group does not apply to the adult population then
its size can be set to zero.
Note that the sum of all adults across risk groups (cell G28) should be
equal to the total adult population in the country (specified in cell C8).
Potential data sources for obtaining the number or percentage of
people with certain risk behaviours are summarized in table A1.
2. Current estimated HIV prevalence by risk
population
Definition: The percentage of people in the particular risk group who are
infected with HIV.
To be provided in cells H15 to H27
If a risk group does not apply to the adult population then its HIV
prevalence can be set to zero.
Modeling the Expected Short-Term Distribution of New HIV Infections by Modes of Transmission | UNAIDS 7Check that the total population HIV prevalence (cell H28) is similar to
the national adult prevalence specified in cell D8 – if it is significantly
different then the cell will be highlighted in green and the HIV
prevalence for one or more of the risk populations will have to be
adjusted. (The adult prevalence in H28 is the weighted average of the
prevalences across the risk groups).
The number of HIV infections is calculated from the prevalence estimates
and are shown in cells I15 to I27. This information can be used to cross-
check the prevalence data against other or known data sources.
3. Prevalence of sexually-transmitted infections
(STI) by risk population
Definition: The percentage of people in the particular risk groups who have
a sexually transmitted infection.
To be provided in cells J15 to J25
Risk groups that do not require this information are partners of IDU,
partners of sex-work clients, female partners of MSM, regular partners
of those who have casual heterosexual sex, those who receive medical
injections, and those who receive blood transfusions.
4. Average number of partners per year in each
risk population
Definition: The average number of different partners (sexual or drug
injecting) per year. Note that for medical injections each injection counts
as having a “partner” and for blood transfusions, each donor counts as a
“partner”.
To be provided in cells K15 to K27
For most risk groups, with the exception of IDU, medical injections
and blood transfusions, this parameter requires the average number of
sexual partners per year.
For injecting drug users, this is the average number of needle-sharing
partners per year.
8For medical injections and blood transfusions, this is the number of
injections or transfusions received in the year of study: each one is
counted as a ‘partner’.
5. Average number of acts of potential HIV risk
exposures per partner per year
Definition: The average number of contacts (injecting or sexual) with each
partner per year.
To be provided in cells L15 to L27
For most risk groups, with the exception of IDU, medical injections
and blood transfusions, the mode of HIV transmission is sexual, and
the number of acts of exposure per partner per year is the average
number of sex acts with each partner per year.
For the IDU risk group, it is the average number of acts of needle
sharing with each injecting partner per year.
For medical injections and blood transfusions, the number of acts of
exposure per ‘partner’ is fixed at one, because each blood transfusion
or injection is regarded as having a new ‘partner’.
6. Average percentage of acts of exposure that
are protected
Definition: The proportion of acts (sexual or injecting) that are protected
by condom use or through the use of safe/sterile needles. For blood
transfusions, the proportion of bloods that are screened for HIV is required.
To be provided in cells M15 to M27
For most risk groups, with the exception of IDU, medical injections
and blood transfusions, the mode of HIV transmission is sexual,
and the percentage of acts that are protected equals the percentage
of sex acts in which condoms are used correctly. Remember that this
percentage is the average over all partnerships.
Modeling the Expected Short-Term Distribution of New HIV Infections by Modes of Transmission | UNAIDS 9For the IDU risk group, it is the average percentage of injection
events that involve safe/sterile needle use. Again, remember that this
percentage represents the average over all partnerships.
For the medical injections risk group, the percentage of acts of
exposure that are ‘protected’ equals the proportion of injections that
involve safe/sterile needle use.
For the blood transfusions risk group, it is the percentage of units
of blood that are screened effectively: this is the percentage of units
that are tested, multiplied by the % sensitivity of the test used (i.e. the
proportion of HIV+ blood units that are detected as being HIV+ and
hence not used). Information on screening coverage collected through
a WHO survey is provided in Appendix A (Table A2).
7. Use of antiretroviral therapy
Definition: The number of HIV infected people who are receiving
antiretroviral therapy (ART)
To be provided in cells N8 (total), as well as N15 to N25 (by risk
category)
This information is used to adjust the transmission probability
according to the level of ART coverage in the population. Recent
studies have confirmed that the use of ART among HIV positive
people can reduce HIV transmission to their negative heterosexual
partners by about 96%.3
The overall number of adults currently receiving antiretroviral therapy
(ART) should be provided in cell N8
The number of people receiving ART in each risk group should be
provided in cells N15 to N25
ART is assumed to reduce heterosexual transmission of HIV by
96% (cell O8), homosexual transmission by 90% (cell P8) and IDU
transmission by 80% (cell Q8).
108. Male circumcision
Definition: The percentage of adult men in the population that are
circumcised
To be provided in cell L8
This information is used to adjust the transmission probability
according to the prevalence of male circumcision in the population.
Three randomized controlled trails have confirmed that medical
male circumcision provides some protection to men and reduces the
transmission of HIV from females to males by 60%.4-6
The percentage of men that are estimated to be circumcised can be entered
into cell L8. The female to male transmission probability in cell H8 will be
automatically adjusted according to the male circumcision rate.
Until further data become available, it is assumed that male
circumcision does not have a direct impact on male to female
transmission.
9. Transmission probability per risky exposure act
Definition: The probability that HIV is transmitted during an act of
exposure (sexual/injecting/medical). It provides a measure of HIV
infectivity.
Cells G8 to J8
Default transmission probabilities, based on extensive literature reviews,
are provided and it is recommended that these are used. However,
the probability estimates can be changed if country specific data are
available.
In this spreadsheet the transmission probability for each risk group
represents the average infectivity of HIV+ partners to whom they
are exposed. For example, the transmission probability for IDU
represents HIV infectivity of sharing needles with other IDU, whilst
the transmission probability for sexual partners of IDU represents HIV
infectivity of sexual contact.
Modeling the Expected Short-Term Distribution of New HIV Infections by Modes of Transmission | UNAIDS 11Effect of Sexually Transmitted Infections (STI) on HIV
transmission
HIV+ individuals who are also infected with a sexually-transmitted
infection (STI) are more likely to transmit HIV during sexual contact
than HIV+ individuals who do not have an STI. A comprehensive
review of the scientific literature suggest that the probability of
transmission in the presence of an STI range between 2 and 23.5, with
the majority clustering between 2 and 5.7 Here we assume that the STI
cofactor is 4,8 as shown in cell K8.
In the case of sexual transmission, there are two transmission
probabilities estimated for each risk group: transmission in the
presence and in the absence of STIs (for the IDU, blood transfusions
and medical injections risk groups this is not relevant because HIV
transmission is not sexual). Cells P16 to P24 contain the transmission
probabilities for sexual transmission of HIV from HIV+ individuals
who also have an STI, and cells Q16 to Q24 contain the transmission
probabilities for transmission of HIV from HIV+ individuals who do
not have an STI. These probabilities would also be adjusted for the
potential impact of male circumcision and use of ART.
Cell Q15 contains the transmission probability for HIV transmission
among injecting drug users, adjusting for the impact of ART; cell Q26
contains the transmission probability for unsafe medical injections;
and cell Q27 contains the transmission probability through blood
transfusions (which is very high).
12Examine the resulting
incidence pattern
Cells R15 – T27
The incidence, defined as the number of new HIV infections over one
year in each risk population, is shown in cells R15 to R27, along with
the total number of new adult infections in R29 and the total incidence
among ‘partners’ (i.e. partners of IDU + partners of sex-work clients +
female partners of MSM + regular partners of those who have casual
heterosexual sex) in cell R30.
Cells S15 to S27 and S30 show the percentage of the total incidence
that occurs in each risk group.
Finally and importantly, the incidence rate per 100,000 population
is shown by risk population in cells T15 to T27 (and for the adult
population overall in cell T29).
The distribution of incidence by risk behaviour (cells S15-S27) is
shown graphically in cells B31-I52 (Figure 3). Note however, this graph
should only be used for examination of the incidence pattern. The final
distribution of new infections should be presented with uncertainty
bounds as discussed below.
Figure 3: Structure of the population for the MoT modeling
Modeling the Expected Short-Term Distribution of New HIV Infections by Modes of Transmission | UNAIDS 13Uncertainty analysis The reliability of the MoT model outputs is greatly affected by the level of uncertainty associated with the input data. Uncertainty can arise from different sources including the quality of the studies used to provide input data, variation in estimates between studies, power, representativeness and generalisability of study estimates, all of which are important criteria to rate the quality of the input data. In particular, studies on populations most at risk of HIV infection need to be interpreted carefully, as certain behaviours or HIV and STI prevalence from one study might not always be generalizable to the whole population. For example, street-based sex workers may have different risk behaviours compared to brothel-based sex workers, and rural and urban men who have sex with men may have different levels of HIV prevalence. Uncertainty can also be associated with insufficient data. In several countries high risk populations such as injecting drug users and men who have sex with men are stigmatised and hidden and therefore difficult to study. In such cases it is often necessary to extrapolate parameters from a single study, sometimes carried out in a neighbouring country. To take these issues into consideration in the modes of transmission model, a component was developed to estimate the uncertainty around the model outputs, as described below. Methods In the uncertainty analysis, the specified model inputs are allowed to vary simultaneously and randomly within a set range of uncertainty for several model runs (typically 500-1000 runs). Each run will result in a different estimate of the number of incident cases per risk population and of total incidence. The range on the total adult incidence (aged 15-49 years) is typically obtained from the Spectrum software (used to obtain national estimates of HIV impact) and used to select plausible outputs: runs which give a total incidence outside these bounds are discarded. The median of all selected outputs is calculated and the uncertainty is described by plausibility bounds defined as the 2.5 and 97.5 percentiles. 14
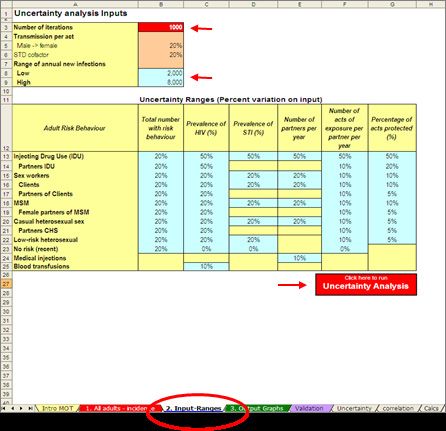
Steps in the uncertainty estimation process

The uncertainty analysis can be run from the worksheet called
“Input-ranges” as shown in Figure 4.

Figure 4. Uncertainty analysis page

                                                                                                        NOTE:

                                                                                                        In order to run the
                                                                                                        uncertainty analysis,
                                                                                                        the user must be able
                                                                                                        to run macros from
                                                                                                        Excel.

Modeling the Expected Short-Term Distribution of New HIV Infections by Modes of Transmission | UNAIDS                           15
STEP 1. Provide uncertainty/variation ranges on each of the
input parameters
For the majority of the parameters included in the model it will be difficult
to provide or calculate confidence intervals. It is therefore suggested to
provide a variation range in the form of a percentage attributed to each
of the parameters depending on how reliable the parameter values are.
The choice of this range is based on experts’ opinions depending on the
source, quantity and quality of available data and should be entered in the
blue cells of the worksheet called “Input-ranges” as shown in Figure 4. The
% variation should be no larger than 100%. A list of criteria to guide the
user on how to define this range is available in Appendix B. For example,
some parameters can be allowed to vary by 20% while others which are
less reliable can have a 100% variation range. This should ensure the final
results to reflect the potential contribution of each group when including
extreme scenarios.
Restricting the outputs
The number of simulated model runs required for the uncertainty analysis NOTE:
should also be entered in this worksheet (in cell B3). The recommended
The adult incidence
number of runs (and therefore the default option) to obtain sound results range obtained
is 1000. However, only runs which give a number of new infections within from Spectrum is
the range obtained from the Spectrum outputs (cells B8 and B9, transferred considered to be a
from the “All adults-incidence” page) are included in the calculation so reliable estimate and
more runs are normally completed in order to obtain the specified number it is calculated using
of runs required. a different method,
meaning that it can
be regarded as an
Other restrictions are directly imposed into the calculations (on the hidden independent value and
worksheet called “Calcs”): the total male and female population is set to be used as a validation
equal to 100% by allowing the proportion of low risk individuals to vary criterion.
according to the proportion of individuals in other groups. Similarly, the
total population prevalence is set to be equal to the specified adult value
by making the prevalence of the low risk group a function of the other
parameters involved in this calculation. Also, in order to keep the number
of partners times sex acts equal for FSW and clients, the number of clients’
sex acts was set to be a function of the other parameters which determine
the final result.
16Model simulations A large number of possible combinations resulting from the simultaneous variation of all the parameters are sampled when the uncertainty analysis is conducted. Using the RANDOM function in Excel, the simulations are generated from the worksheet called “Calcs”. This worksheet is hidden since all the calculations are automatically performed when the uncertainty analysis is run, and the user does not have to make any changes on this page. STEP 2. Running uncertainty analysis The uncertainty analysis can be run from the “Input-ranges” page by clinking on the red button called “Uncertainty analysis” (see Figure 4). This will start the process of generating the number of iterations that have been specified in cell B3. The summary statistics of the model runs (typically 1000 runs), including the median, 2.5 and 97.5 percentiles are calculated and will be shown as plausibility bounds for the final output, i.e. showing that 95% of all values for incidence calculated in each run fell in this range. The individual outputs (percent of new infections by risk population) for each of the model runs are given in the hidden spreadsheet called “Uncertainty”. Unless the user is interested in the individual model runs, this spreadsheet is not normally used. Model outputs with uncertainty ranges The final results of the MoT model with uncertainty bounds are produced in the worksheet “Output graphs”, as shown in Figure 5, and can be used for formal publication of results. Modeling the Expected Short-Term Distribution of New HIV Infections by Modes of Transmission | UNAIDS 17
Figure 5. Results of the uncertainty analysis, showing median and high and low
bounds of the percentage of new infections attributed to each risk group in
table and graph forms.

Step by step summary of uncertainty analysis

1. The base parameter values are taken from the model inputs on the “All
   adults-incidence” worksheet.
2. The low and high bounds on the total number of adult new infections
   are typically obtained from Spectrum. They can be entered in the “All
   adults-incidence” page and are automatically transferred to the “Input-
   ranges” page.
3. On the “Input-ranges” worksheet, enter the variation percentages for
   each of the input parameters.
4. Also on the “Input-ranges” worksheet, enter the number of model runs
   that are required (the default is set at 1000)
5. Run the Macro by clicking on the red button called “Uncertainty
   Analysis”.
6. Final model output with uncertainty bounds are provided in the
   “Output Graphs” worksheet.

18
Discussion

The purpose of this analysis is to see if the overall conclusions from
applying the model are sensitive to the input values. For example, if the
model results indicate that most new infections occur among stable
heterosexual couples, we would like to know whether that conclusion
would be different if the input values were somewhat different, but still
within a plausible range. If the ranges around the percent of new infections
by risk group overlap substantially then we need to be cautious in
describing the source of most new infections. However, if the uncertainty
ranges do not overlap it means that the conclusions are robust and not
likely to be different if we have used different values.

Strengths and limitations
The advantage of this method is that it allows testing the extent by which
the contribution of a risk group to the total HIV incidence changes
when imposing very high uncertainty ranges on some parameters. This
is useful when very little or no data is available for a specific a risk group
and important assumptions have to be made. It is not computationally
demanding and is easy to implement.

This method only takes into account uncertainty related to the input
parameters and does not incorporate the uncertainty inherent to the model
assumptions, meaning that it is likely to underestimate total uncertainty.
In some instances the uncertainty on the input parameters might appear
as a subjective choice. However, when this information is lacking or when
parameters have to be extrapolated from sub-national or foreign studies, it
is necessary to make assumptions. If these are based on sound criteria they
should provide a reasonable reflection of the actual uncertainty of these
values.

Modeling the Expected Short-Term Distribution of New HIV Infections by Modes of Transmission | UNAIDS   19
Validation of model outputs

If alternative sources of information are available on the distribution
of new adult infections in a country, for example from other modeling
exercises (eg. EPP/Spectrum, Asian Epidemic Model, other models),
from good case notification systems, or from consensus expert opinion,
the results can be compared with those of the MoT on the page called
“Validation”, as shown in Figure 6. Note that the analysis on this page is
optional and should only be done if other reliable sources of information
on the distribution of new infections exist.

Figure 6. Validation page: Results from MoT can be compared to other sources
of information on modes of HIV transmission, if available.

20
Appendix A

Model assumptions

If we assume that the risk of infection in a susceptible individual is a simple
binomial function of their number of partners and number of sex acts with
each partner we can derive a risk per susceptible which depends upon the
current prevalence of infection within their contacts. We can further take
account of the different transmission probabilities when another STI is or
is not present. If we multiply this by the number of susceptibles at risk in
the population we get an expected incidence for the coming year using the
following equation:

where I is the incidence of HIV in the target population, which depends
upon the number susceptible, S, and the HIV prevalence in the partner
population, p. The variable B is prevalence of STIs in the target or partner
population, whichever is higher, β’ and β represent the probability of
transmission of HIV during a single contact in the presence or absence
of an STI (in the case of transmission by needle-sharing β’ = β), υ is the
proportion of acts currently protected by effective condom use or the use of
sterile needles, a is the number of contacts per partner and n is the number
of partners (Figure 2).

Modeling the Expected Short-Term Distribution of New HIV Infections by Modes of Transmission | UNAIDS   21
Potential sources of data

A summary of the data required for each risk group with potential sources
of data are provided in Table A1.

Table A1: Data required and possible sources of information

 Data required for         Potential sources of data
 each risk groups
 Number (or percent-       Surveillance (HIV, STI, Behavioural), Population based surveys
 age) of individuals in    (e.g., DHS, MICS), other published and unpublished reports/
 risk group                papers. In countries with DHS reports, data can be found in
                           the chapter on “HIV/AIDS-related Knowledge, attitudes and
                           behaviour”
                           Medical Injections : See Hutin et al.9
                           Blood transfusions: See table by Rapiti et al.10 below

 HIV prevalence in risk    HIV surveillance in various risk populations, Population based
 group                     surveys, UNAIDS/WHO Epi Fact sheets, other published
                           papers/reports.
                           In countries with DHS reports, data can be found in the chapter
                           on “HIV Prevalence and associated factors”
 Prevalence of STI         Surveillance (behavioural and biomedical) and special studies,
                           population based surveys, other published papers/reports.
                           In countries with DHS reports, data on self-reporting of STIs can
                           be found in the chapter on “HIV/AIDS-related Knowledge, at-
                           titudes and behaviour”
 Average number of         Behavioural surveillance, population based surveys, published
 partners per year         papers/reports In countries with DHS reports, data can be found
                           in the chapter on “HIV/AIDS-related Knowledge, attitudes and
                           behaviour”
                           Blood transfusions and Medical injections: Number received
                           should be reported (usually 1 per year)
 Number of acts per        Behavioural surveillance, population based surveys, published
 partner per year          papers/reports.
                           In countries with DHS reports, data can be found in the chapter
                           on “HIV/AIDS-related Knowledge, attitudes and behaviour”
                           Blood transfusions and Medical injections: Fixed at 1
 Percentage of po-         Behavioural surveillance, population based surveys, published
 tential exposure acts     papers/reports
 protected
                           Medical Injections : See Hutin et al.9
                           Blood transfusions: See tables below by Rapiti et al.10
 Transmission probabil-    Recommended to use default values that are derived from pub-
 ity per act of exposure   lished literature
 with and without STIs

22
AFR D AFR E AMR AMR B AMR EMR B EMR EUR A EUR B EUR C SEAR B SEAR D WPR A WPR B
A D D
Proportion of screening 92.8% 96% 100% 92% 67% 100% 97% 100% 97.8% 100% 100% 74% 100% 94%
HIV
Worse-case scenario 50% 50% 100% 50% 50% 50% 50% 100% 80%* 80% 50% 50% 100% 50%
Published studies - 82.5% 100% 95.9% 81.8% - 52% 100% - - - - 100% -
(72-93) (85- (60-
100) 100)
Number of blood 4 5 43 11 7 18 4 57 11 20 5 4 36 15
transfusions per 1000
persons and per year
Regions:
proportion screened, by region for 2000
AFR D: Algeria, Angola, Benin, Burkina Faso, Cameroon, Cape Verde, Chad, Comoros, Equatorial Guinea, Gabon, Gambia, Ghana, Guinea-Bissau, Liberia, Madagascar, Mali,
Mauritania, Mauritius, Niger, Nigeria, Sao Tome and Principe, Senegal, Seychelles, Sierra Leone, Togo
AFR E: Botswana, Burundi, Central African Republic, Congo, Côte d’Ivoire, Democratic Republic of the Congo, Eritrea, Ethiopia, Kenya, Lesotho, Malawi, Mozambique, Namibia,
Rwanda, South Africa, Swaziland, Uganda, United Republic of Tanzania, Zambia, Zimbabwe
AMR A: Canada, Cuba, United States of America
AMR B: Antigua and Barbuda, Argentina, Bahamas, Barbados, Belize, Brazil, Chile, Colombia, Costa Rica, Dominica, Dominican Republic, El Salvador, Grenada, Guyana,
Honduras, Jamaica, Mexico, Panama, Paraguay, Saint Kitts and Nevis, Saint Lucia, Saint Vincent and the Grenadines, Suriname, Trinidad and Tobago, Uruguay, Venezuela
AMR D: Bolivia, Ecuador, Guatemala, Haiti, Nicaragua, Peru
EMR B: Bahrain, Cyprus, Iran (Islamic Republic of), Jordan, Kuwait, Lebanon, Libyan Arab Jamahiriya, Oman, Qatar, Saudi Arabia, Syrian Arab Republic, Tunisia, United Arab
Emirates
Modeling the Expected Short-Term Distribution of New HIV Infections by Modes of Transmission | UNAIDS
Table A2. Estimated number of blood transfusions per person per year and
EMR D: Afghanistan, Djibouti, Egypt, Iraq, Morocco, Pakistan, Somalia, Sudan, Yemen
EUR A: Andorra, Austria, Belgium, Croatia, Czech Republic, Denmark, Finland, France, Germany, Greece, Iceland, Ireland, Israel, Italy, Luxembourg, Malta, Monaco, Netherlands,
Norway, Portugal, San Marino, Slovenia, Spain, Sweden, Switzerland, United Kingdom
Data on screening of blood transfusions (WHO)
EUR B: Albania, Armenia, Azerbaijan, Bosnia and Herzegovina, Bulgaria, Georgia, Kyrgyzstan, Poland, Romania, Slovakia, Tajikistan, The Former Yugoslav Republic of Macedonia,
Turkey, Turkmenistan, Uzbekistan,
EUR C: Belarus, Estonia, Hungary, Kazakhstan, Latvia, Lithuania, Republic of Moldova, Russian Federation, Ukraine
SEAR B: Indonesia, Sri Lanka, Thailand
SEAR D: Bangladesh, Bhutan, Democratic People’s Republic of Korea, India, Maldives, Myanmar, Nepal
WPR A: Australia, Brunei Darussalam, Japan, New Zealand, Singapore
WPR B: Cambodia, China, Cook Islands, Fiji, Kribati, Lao People’s Democratic Republic, Malaysia, Marshall Islands, Micronesia (Federated States of), Mongolia, Nauru, Niue,
Palau, Papua New Guinea, Philippines, Republic of Korea, Samoa, Solomon Islands, Tonga, Tuvalu, Vanuatu, Viet Nam
Source: Rapiti E, Hutin Y, Dhingra N. The global burden of HBV, HCV and HIV infections attributable to unsafe blood transfusions. WHO Unpublished report
23Appendix b
Uncertainty analysis: General guidelines on how to assign
ranges on the user-specified input values
The levels of uncertainty around the input parameters can be related
to the quality of studies that estimates are derived from, variation in
estimates between studies, sample size and power, representativeness and
generalisability of study estimates, all of which are indicative of the overall
quality of the input data. Clearly there is a hierarchy of inputs. Many inputs
are based on national surveys and should have ranges as specified by those
surveys, these are generally provided in the surveys’ appendices. However,
not all the variables we use in this model will have specified ranges. The
ranges on national prevalence are usually fairly small but a range of +/- 5%
for survey derived values would be appropriate. Other values which are
based on smaller, non-national survey (sex worker surveys, for example)
will have larger ranges, on the order of 20%. Values taken from studies in
other countries (percent of MSM, for example) should have even larger
ranges, on the order of 100%. It is probably better to estimate ranges
that are too large rather than too small, since the restriction of the final
output to a range of total number of new infections provides a control
for unrealistic combinations. A diagram summarizing these guidelines is
presented below.
Flowchart indicating uncertainty ranges for model inputs depending on their
source.
Range available Use this value
Yes
Range unavailable +/- 5%
Smaller survey +/- 20%
No
Study from other country +/- 100%
24Other possible guidelines… 1. General criteria for rating data/study quality Criteria Very Good Good Medium Poor Sample size Study Power Representativeness Generalisability Recentness 2. Classification of estimates of high risk groups’ sizes (scoring used by Aceijas et al., 2006)11 Estimates produced using indirect single A or multiple methods (for example, capture- recapture, multiplier) Estimates from population based surveys B Experts’ judgment and information on how the C estimate was produced (for example, Rapid Assessment and Response (RAR) studies) and registered cases Estimates reported without technical information D Modeling the Expected Short-Term Distribution of New HIV Infections by Modes of Transmission | UNAIDS 25
References

1. Pisani E, Garnett GP, Brown T, Stover J, Grassly NC, Hankins C, et al.
   Back to basics in HIV prevention: focus on exposure. Br Med J. 2003; 326: 1384-7.
2.   Gouws E, White PJ, Stover J, Brown T. Short term estimates of adult HIV incidence
     by mode of transmission: Kenya and Thailand as examples. Sex Transm Infect. 2006;
     82 Suppl 3: iii51-5.
3.   Cohen MS, Chen YQ, McCauley M, Gamble T, Hosseinipour MC, Kumarasamy N,
     et al. Prevention of HIV-1 infection with early antiretroviral therapy. N Engl J Med.
     2011; 365(6): 493-505.
4.   Auvert B, Taljaard D, Lagarde E, Sobngwi-Tambekou J, Sitta R, Puren A.
     Randomized, controlled intervention trial of male circumcision for reduction of HIV
     infection risk: the ANRS 1265 Trial. PLoS Med. 2005; 2(11): e298.
5.   Bailey RC, Moses S, Parker CB, Agot K, Maclean I, Krieger JN, et al. Male
     circumcision for HIV prevention in young men in Kisumu, Kenya: a randomised
     controlled trial. Lancet. 2007; 369(9562): 643-56.
6.   Gray RH, Kigozi G, Serwadda D, Makumbi F, Watya S, Nalugoda F, et al. Male
     circumcision for HIV prevention in men in Rakai, Uganda: a randomised trial.
     Lancet. 2007; 369(9562): 657-66.
7.   Fleming DT, Wasserheit JN. From epidemiological synergy to public health policy
     and practice: the contribution of other sexually transmitted diseases to sexual
     transmission of HIV infection. Sex Transm Infect. 1999; 75(1): 3-17.
8.   Gray RH, Wawer MJ, Brookmeyer R, Sewankambo NK, Serwadda D, Wabwire-
     Mangen F, et al. Probability of HIV-1 transmission per coital act in monogamous,
     heterosexual, HIV-1-discordant couples in Rakai, Uganda. Lancet. 2001; 357(9263):
     1149-53.
9.   Hutin YJ, Hauri AM, Armstrong GL. Use of injections in healthcare settings world-
     wide, 2000: literature review and regional estimates. BMJ. 2003; 327(7423): 1075.
10. Rapiti E, Hutin YJ, Dhingra N. The global burden of HBV, HCV and HIV infections
    attributable to unsafe blood transfusions. WHO Unpublished Report. 2000.
11. Aceijas C, Friedman SR, Cooper HL, Wiessing L, Stimson GV, Hickman M.
    Estimates of injecting drug users at the national and local level in developing and
    transitional countries, and gender and age distribution. Sex Transm Infect. 2006; 82
    Suppl 3: iii10-7.

26
Modeling the Expected Short-Term Distribution of New HIV Infections by Modes of Transmission | UNAIDS 27
notes

28
UNAIDS

20 Avenue Appia
1211 Geneva 27
Switzerland

+41 22 791 3666

unaids.org
You can also read