Health impact assessment to predict the impact of tobacco price increases on COPD burden in Italy, England and Sweden - Nature
←
→
Page content transcription
If your browser does not render page correctly, please read the page content below
www.nature.com/scientificreports
OPEN Health impact assessment
to predict the impact of tobacco
price increases on COPD burden
in Italy, England and Sweden
Elaine Fuertes1*, Alessandro Marcon2, Laura Potts3, Giancarlo Pesce4, Stefan K. Lhachimi5,
Virjal Jani1, Lucia Calciano2, Alex Adamson1, Jennifer K. Quint1, Debbie Jarvis1,6,
Christer Janson7, Simone Accordini2,8 & Cosetta Minelli1,8
Raising tobacco prices effectively reduces smoking, the main risk factor for chronic obstructive
pulmonary disease (COPD). Using the Health Impact Assessment tool “DYNAMO-HIA”, this study
quantified the reduction in COPD burden that would occur in Italy, England and Sweden over
40 years if tobacco prices were increased by 5%, 10% and 20% over current local prices, with larger
increases considered in secondary analyses. A dynamic Markov-based multi-state simulation
modelling approach estimated the effect of changes in smoking prevalence states and probabilities
of transitioning between smoking states on future smoking prevalence, COPD burden and life
expectancy in each country. Data inputs included demographics, smoking prevalences and behaviour
and COPD burden from national data resources, large observational cohorts and datasets within
DYNAMO-HIA. In the 20% price increase scenario, the cumulative number of COPD incident cases
saved over 40 years was 479,059 and 479,302 in Italy and England (populous countries with higher
smoking prevalences) and 83,694 in Sweden (smaller country with lower smoking prevalence). Gains
in overall life expectancy ranged from 0.25 to 0.45 years for a 20 year-old. Increasing tobacco prices
would reduce COPD burden and increase life expectancy through smoking behavior changes, with
modest but important public health benefits observed in all three countries.
Tobacco consumption remains the largest preventable risk factor for death and disease in the European Union,
with 50% of smokers dying prematurely and many more suffering from smoking-related d iseases1. Although
estimated population attributable risks vary widely between studies2, there is overwhelming evidence that smok-
ing is the most important risk factor for chronic obstructive pulmonary disease (COPD), a condition responsible
for 3.2 million deaths and 2.6% of disability-adjusted life years (in 2015) w orldwide3.
Various policies have been implemented to reduce smoking initiation and encourage cessation, at both
national and the European Union level (e.g. 2014 European Tobacco Products Directive)4. However, smoking
initiation rates continue to increase among 11–15 year-olds in most of Europe, especially in the West, and remain
high among 16–20 year-olds in East, South and West Europe5. As over half of smokers begin to smoke before
the age of 18 y ears1, policies that discourage smoking initiation (especially in adolescence)6 and encourage ces-
sation at all ages are likely to be most b eneficial7. In particular, male early adolescence represents an important
window of opportunity for preventive interventions that may benefit several generations, as tobacco smoking
before 15 years of age in men may have a negative impact on respiratory health in future offspring8. Increasing
tobacco prices may also help break the chain of tobacco supply to the youngest age groups experimenting with
1
National Heart and Lung Institute, Emmanuel Kaye Building, Imperial College London, 1B Manresa Road,
London SW3 6LR, UK. 2Unit of Epidemiology and Medical Statistics, Department of Diagnostics and Public
Health, University of Verona, Verona, Italy. 3Institute of Psychiatry, Psychology and Neuroscience, King’s College
London, London, UK. 4Sorbonne Université, INSERM UMR‑S 1136, Epidemiology of Allergic and Respiratory
Diseases (EPAR), Pierre Louis Institute of Epidemiology and Public Health (IPLESP), Saint-Antoine Medical School,
Paris, France. 5Health Sciences Bremen, Institute for Public Health and Nursing, University of Bremen, Bremen,
Germany. 6MRC Centre for Environment and Health, Imperial College London, London, UK. 7Department of
Medical Sciences: Respiratory, Allergy and Sleep Research, Uppsala University, Uppsala, Sweden. 8These authors
jointly supervised this work: Simone Accordini and Cosetta Minelli. *email: e.fuertes@imperial.ac.uk
Scientific Reports | (2021) 11:2311 | https://doi.org/10.1038/s41598-021-81876-3 1
Vol.:(0123456789)www.nature.com/scientificreports/
Italy England Sweden
Smoking status Scenario 2018 2058 2018 2058 2018 2058
Reference 17.5 15.3 16.4 9.0 10.6 8.2
5% tobacco price increase 15.4 14.1 14.3 8.2 8.4 7.4
Current
10% tobacco price increase 13.6 12.9 12.5 7.4 6.6 6.7
20% tobacco price increase 10.5 10.8 9.2 6.1 3.3 5.4
Reference 20.4 16.4 19.9 15.3 21.6 12.2
5% tobacco price increase 20.9 15.9 20.4 14.6 22.2 11.5
Former
10% tobacco price increase 21.4 15.4 20.9 14.0 22.7 10.8
20% tobacco price increase 22.0 14.5 21.6 12.8 23.2 9.5
Reference 62.1 68.3 63.7 75.7 67.8 79.6
5% tobacco price increase 63.7 70.0 65.3 77.2 69.4 81.1
Never
10% tobacco price increase 65.1 71.6 66.6 78.5 70.8 82.5
20% tobacco price increase 67.5 74.7 69.2 81.1 73.4 85.1
Table 1. Prevalence of current, former and never smoking (expressed in %) at baseline (2018) and at the end
of the 40-year simulation (2058). Results reported per country and scenario.
smoking, who tend to obtain cigarettes from their peers9,10. Overall, raising the price of tobacco is considered to
be an effective policy to reduce cigarette smoking11, and is likely to be accepted by most of the population, as sug-
gested by the World Health Organization’s MPOWER initiative (the “R” representing “Raise taxes on tobacco”)12.
Health Impact Assessment (HIA) is a tool to derive quantitative predictions of the influence of a successfully
implemented intervention on health and has been used to assess the expected impact of increasing the price of
tobacco on future COPD burden in single-country analyses in the European Union13–15. These previous analyses
suggest that raising tobacco prices would reduce future COPD burden in different European countries, but direct
comparisons of their results are hampered by substantial differences in methodology and interventions tested.
As part of the “Ageing Lungs in European Cohorts” (ALEC) consortium (https://www.alecstudy.org), we
quantified the reduction in COPD burden, through a reduction in smoking prevalence, that would occur in Italy,
England and Sweden over a 40-year time frame if tobacco prices were increased by 5%, 10% and 20% over current
local prices using the standardized, flexible and publicly available tool “DYNAMO-HIA” (https://www.dynam
o-hia.eu16), which has been used for similar e xercises14,17. These price increases were selected as they represent
measures that could be relatively easily and quickly implemented by governments, but larger increases (30%,
40% and 50%) were considered in secondary analyses. We also estimated the gain in life expectancy that could
be expected through a reduction in overall mortality associated with a reduction in smoking. We aimed to iden-
tify whether there were differences between countries in the effectiveness of price interventions in reducing the
national COPD burden. We chose Italy, England and Sweden as our three countries of interest because of their
substantial differences in tobacco prices, ranging from 4.9 euros in Italy to 10.3 euros in England for a pack of
20 cigarettes18; in terms of purchasing power parity, the price of the most sold brand of cigarettes in 2018 ranged
from 7.35 international dollars in Sweden to 13.58 international dollars in E ngland19–21. These countries also vary
in smoking prevalences (ranging from 10.6% in Sweden to 17.5% in Italy in 2018) and COPD burden (prevalence
ranging from 0.9% in England to 1.3% in Sweden in 2018). Populations from these countries also have markedly
different age distributions, which is likely to affect the local effectiveness of tobacco price interventions.
Results
Effect of interventions on smoking behaviour. Current, former and never smoking prevalences per
age, country and intervention at baseline (2018) are presented in Supplementary Figs. S1-S3, and the smoking
initiation, cessation and restart rates per age and region (south/north) used throughout the simulation in Sup-
plementary Fig. S4–S6. Smoking prevalences in the reference and intervention scenarios in 2018 and at the end
of the simulation (2058) are presented in Table 1 (entire simulation for the overall population, males and females
presented in Supplementary Figs. S7, S8 and S9, respectively).
There was a reduction in overall current smoking prevalence of 4.5%, 2.9% and 2.8% between the reference
scenario and 20% tobacco price increase scenario for Italy, England and Sweden, respectively, by the end of the
40-year simulation in 2058. In all countries, tobacco price increases led to higher prevalences of never smokers
and the prevalence of former smokers was lower in the intervention scenarios than in the reference scenario by
2058 (Supplementary Fig. S7).
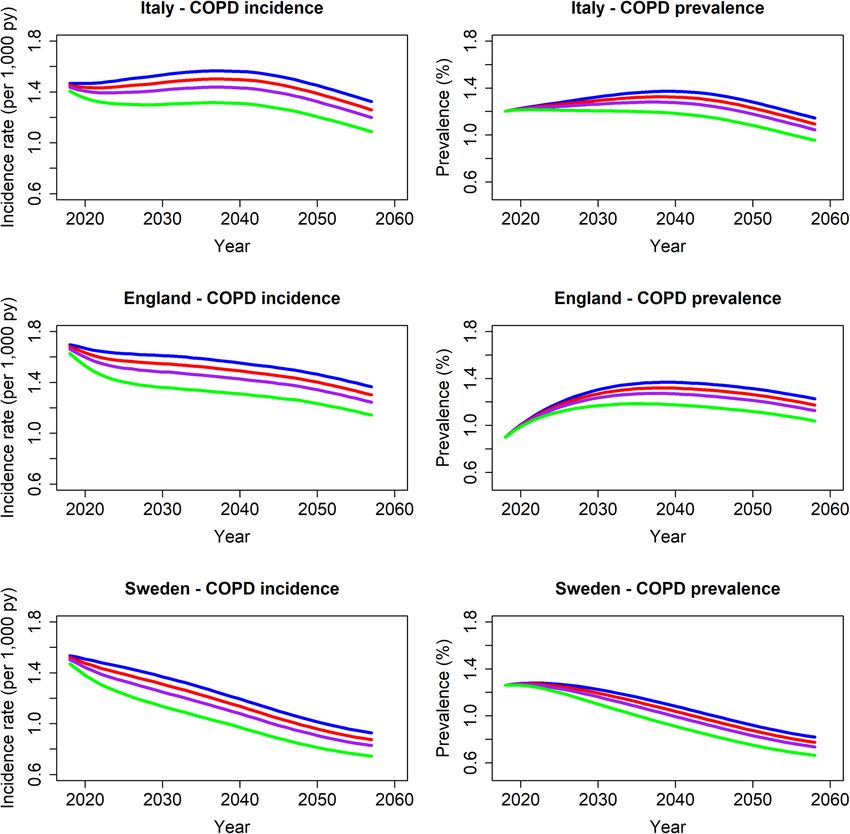
Effect of interventions on COPD prevalence and incidence. At the start of the simulation (2018) in
the reference scenario, COPD prevalence was lowest in England (0.9%) and highest in Sweden (1.3%), whereas
COPD incidence rates were lowest in Italy (1.5 per 1000 person-years) and highest in England (1.7 per 1000
person-years). Country-specific COPD prevalence and incidence rates over the entire simulation are presented
in (Fig. 1).
COPD prevalences 10, 20 and 40 years after the start of the simulation in each scenario are presented per
country in Table 2 for the overall population (sex-specific results in Supplementary Table S1). Compared to the
reference scenario, reductions in COPD prevalence are modest for all intervention scenarios. After 10-year,
Scientific Reports | (2021) 11:2311 | https://doi.org/10.1038/s41598-021-81876-3 2
Vol:.(1234567890)www.nature.com/scientificreports/
Figure 1. Projected COPD incidence (cases/1000 person-years) and COPD prevalence (%) over a 40-year time
period in the various scenarios (blue: reference scenario; red, purple and green: 5%, 10% and 20% tobacco price
increase, respectively). Figure created using the statistical program R (version 3.6.2, https://www.R-project.org).
Italy England Sweden
Health measure Scenario 2028 2038 2058 2028 2038 2058 2028 2038 2058
Reference 1.31 1.37 1.15 1.27 1.37 1.23 1.25 1.11 0.82
5% tobacco price increase 1.28 1.33 1.09 1.24 1.32 1.18 1.22 1.07 0.78
COPD prevalence (%)
10% tobacco price increase 1.26 1.28 1.05 1.21 1.27 1.13 1.19 1.03 0.74
20% tobacco price increase 1.21 1.19 0.96 1.15 1.18 1.04 1.14 0.95 0.66
Reference 1.52 1.57 1.32 1.62 1.57 1.37 1.40 1.23 0.93
5% tobacco price increase 1.46 1.50 1.26 1.56 1.50 1.30 1.34 1.17 0.87
COPD incidence (cases/1,000 person-years)a
10% tobacco price increase 1.41 1.44 1.20 1.49 1.44 1.24 1.28 1.11 0.83
20% tobacco price increase 1.30 1.32 1.09 1.37 1.32 1.14 1.17 1.01 0.75
Table 2. COPD burden (prevalence and incidence) 10 (2028), 20 (2038) and 40 (2058) years from the
implementation of the intervention. Results reported per country and scenario. a The COPD incidence value
after 39 years (2057) instead of 40 years (2058) is given as DYNAMO does not calculate COPD incidence rates
for the last year of the simulation.
Scientific Reports | (2021) 11:2311 | https://doi.org/10.1038/s41598-021-81876-3 3
Vol.:(0123456789)www.nature.com/scientificreports/
Italy England Sweden
Gain in years of life expectancy Gain in years of life expectancy Gain in years of life expectancy
COPD- COPD- COPD-
disability- disability- disability-
Sex Scenario Overall COPD-free adjusted Overall COPD-free adjusted Overall COPD-free adjusted
5% tobacco price
0.10 0.13 0.08 0.14 0.17 0.11 0.11 0.13 0.09
increase
10% tobacco
Males 0.22 0.29 0.19 0.24 0.31 0.21 0.20 0.26 0.17
price increase
20% tobacco
0.43 0.55 0.36 0.45 0.57 0.38 0.43 0.54 0.36
price increase
20 year- old
5% tobacco price
0.10 0.15 0.09 0.08 0.12 0.07 0.06 0.10 0.06
increase
10% tobacco
Females 0.17 0.24 0.14 0.16 0.24 0.14 0.11 0.16 0.09
price increase
20% tobacco
0.33 0.46 0.27 0.31 0.45 0.26 0.25 0.38 0.22
price increase
5% tobacco price
0.08 0.10 0.06 0.09 0.12 0.07 0.09 0.12 0.08
increase
10% tobacco
Males 0.15 0.21 0.13 0.19 0.25 0.16 0.20 0.28 0.18
price increase
20% tobacco
0.33 0.44 0.28 0.40 0.54 0.35 0.36 0.50 0.32
price increase
40 year- old
5% tobacco price
0.05 0.07 0.04 0.07 0.11 0.06 0.06 0.10 0.06
increase
10% tobacco
Females 0.12 0.17 0.10 0.14 0.22 0.13 0.11 0.18 0.10
price increase
20% tobacco
0.25 0.36 0.21 0.29 0.45 0.26 0.23 0.37 0.21
price increase
5% tobacco price
0.04 0.06 0.04 0.04 0.06 0.04 0.03 0.05 0.03
increase
10% tobacco
Males 0.09 0.12 0.07 0.09 0.13 0.08 0.07 0.11 0.06
price increase
20% tobacco
0.16 0.22 0.14 0.23 0.31 0.19 0.16 0.23 0.14
price increase
60 year- old
5% tobacco price
0.06 0.08 0.05 0.06 0.09 0.05 0.04 0.06 0.03
increase
10% tobacco
Females 0.11 0.15 0.09 0.11 0.17 0.09 0.06 0.10 0.05
price increase
20% tobacco
0.19 0.27 0.15 0.21 0.32 0.17 0.12 0.20 0.11
price increase
Table 3. Absolute gain in overall, COPD -free, and COPD-disability-adjusted cohort life-expectancy
(expressed in years) of a 20, 40 and 60 year-old male and female at baseline (2018), as compared to the
reference scenario. Results reported per country and intervention scenario.
reductions ranged from 0.03% in the 5% tobacco price increase scenario in all countries to 0.12% in England,
0.11% in Sweden and 0.10% in Italy in the 20% price increase scenario; reductions after 20 and 40 years are
slightly larger and more similar across countries, ranging from 0.16% to 0.19% in the 20% price increase scenario.
COPD incidence rates 10, 20 and 39 years after the start of the simulation in each scenario are presented
per country in Table 2 for the overall population (sex-specific results in Supplementary Table S2). Compared to
the reference scenario, overall COPD incidence rates are between 0.06 and 0.07 cases/1000 person-years lower
throughout the entire simulation for the 5% tobacco price increase scenario in all countries. This reduction is
slightly larger in the 10% and 20% tobacco price increase scenarios (reductions of 0.10–0.13 cases/1000 person-
years and 0.18–0.25 cases/1000 person-years, respectively).
The total cumulative number of COPD incident cases saved over the entire 40-year simulation for the 5%,
10% and 20% price increase interventions compared to the reference scenario were respectively: 124,364, 247,364
and 479,059 in Italy; 125,712, 248,707 and 479,302 in England; 22,070, 43,654 and 83,694 in Sweden.
Effect of interventions on life expectancy. There are gains in years of overall life expectancy, COPD-
free life expectancy and COPD-disability-adjusted life expectancy in the intervention scenarios compared to the
reference scenario for both sexes (Table 3). Those with more time to benefit from the intervention have greater
improvements. For example, on average, Italian males aged 20 years at the start of the simulation (2018) who
have a life expectancy of 80.3 years in the reference scenario, would gain 0.10, 0.22 and 0.43 years of overall
life expectancy in the 5%, 10% and 20% tobacco price increase intervention scenarios, respectively. The corre-
sponding gains for Italian males aged 60 years in 2018 are only 0.04, 0.09 and 0.16 years, respectively. In terms
of gains in COPD-free and COPD-disability adjusted life expectancy, values ranged from 0.13 to 0.57 years and
Scientific Reports | (2021) 11:2311 | https://doi.org/10.1038/s41598-021-81876-3 4
Vol:.(1234567890)www.nature.com/scientificreports/
0.08 to 0.38 years, respectively, for males aged 20 years in 2018 across the three countries. Overall, gains in life-
expectancy are similar across countries.
Price elasticity sensitivity analysis. With the same price elasticity coefficient of − 0.5 for all ages, there
would be a slightly smaller reduction in current smoking prevalences in the intervention scenarios compared to
the reference scenario. For example, after 40 years, the reduction in the overall prevalence of current smokers in
the 20% tobacco price increase scenario, compared to the reference scenario, would be 4.5%, 2.9% and 2.8% in
the main analysis for Italy, England and Sweden, respectively, while the corresponding values are 2.8%, 1.8% and
1.7% when all price elasticities are set to − 0.5. The health benefits (i.e. lower COPD prevalence, fewer COPD
incident cases and gains in life expectancy) are slightly attenuated in this sensitivity analysis (Supplementary
Table S3).
Price increase secondary analysis. As expected, intervention scenarios of higher tobacco price increases
(i.e. 30%, 40% and 50%) evaluated as secondary analyses yielded greater gains for both COPD prevalence and
incidence throughout the simulations as compared to the main analysis (Table S4). Similarly, there were greater
gains in years of overall life expectancy, COPD-free life expectancy and COPD-disability-adjusted life expec-
tancy for both sexes in these secondary analyses as compared to the main analysis (Table S5).
Discussion
This study shows that increasing the price of tobacco would reduce current smoking prevalences and associ-
ated COPD burden, with modest but important public health benefits observed within 40 years. For example,
although the COPD incidence rate in the 20% price increase scenario in England would be only 0.23 cases/1000
person-years lower than in the reference scenario in 2058, the cumulative number of COPD incidence cases saved
from 2018 to 2058 would be 479,302. By using the same methodology for the HIA analyses in three European
countries, this study also demonstrates that baseline smoking prevalences and projected changes in the popula-
tion structure of a country will influence the effectiveness of national tobacco reduction policies.
Trends in overall smoking prevalences in the reference and intervention scenarios differed slightly by country,
which likely reflects demographic changes in the populations (Supplementary Fig. S10). For example, in Italy,
population projections indicate a fall in the percentage of the population that is middle-aged (45–64 years of age)
between 2018 and 2058 (29% and 23% in 2018 and 2058, respectively). This age group has the highest smoking
prevalence on which the intervention will act.
Projected changes in population structure may also explain differences in the trends of COPD incidence
rates over time. In Italy, despite reductions in current smoking prevalences, a slight increase or plateauing in the
COPD incidence rates are observed for the first 20 years of the simulation, before a steady decrease becomes
apparent. This trend likely occurs because the proportion of older individuals in the population at risk of COPD
increases during that time. In comparison, the age-distribution of the population in England and Sweden is
expected to remain more stable and the decreases in COPD incidence are apparent for all scenarios throughout
the entire simulation.
For the minimum price increase of 5%, 124,364, 125,712 and 22,070 excess COPD cases could be prevented
over a 40-year period in Italy, England and Sweden, respectively, compared to the reference scenario. Accord-
ing to a recent systematic r eview22, the mean direct annual cost per COPD patient due to disease management
in nine European countries is approximately 5700 euros. Using this cost value and assuming each patient lives
10 years with the disease, more than 7 billion euros could be saved in Italy and England, and over 1.2 billion
euros in Sweden, if the COPD cases under the minimum price increase scenario were prevented over the 40-year
study period. These cost savings are certainly underestimates as indirect costs, such as loss in work productivity
and early retirement costs, are not considered. When including the mean annual cost due to work productivity
losses in Italy (397 euros) and Sweden (998 euros) (not reported for the United Kingdom)22 to this annual cost of
disease management, cost savings would rise to over 7.5 billion and over 1.4 billion euros in these two countries,
respectively. Although these figures are only indicative, they provide a picture of the substantial cost savings that
could be achieved with a relatively simple public health intervention of a one-time increase in tobacco price.
Our analysis is largely based on existing data provided within the DYNAMO-HIA tool. However, we added
up-to-date estimates for population size, projected newborns, and importantly, smoking state prevalences and
the probabilities of transitioning between smoking states, using newly available estimates derived from six large
multicentre observational studies participating in the ALEC consortium. Of particular interest is the use of Euro-
pean region-specific probabilities of smoking initiation and cessation, which better reflect known geographical
differences in smoking patterns in Europe5,23. We also incorporated data specifically on young individuals (as of
11 years) to model potential benefits for the entire population who may be affected by tobacco price increases.
Some limitations should be noted. First, any defined intervention scenario remains a limited reflection of
real-world settings. Previous work has assumed that only parts of the population would be affected by an increase
in tobacco price (e.g. only never smokers < 21 years and former smokers ≥ 21 y ears14, or only initiation rates
for ≤ 18 years and cessation and restart rates for > 25 years)15. In the current analysis, we allowed the whole popu-
lation and all smoking states and probabilities of transitioning between these states to be affected. We aimed to
capture the different behaviours of a population by using three different price elasticities; younger populations
were set to be more responsive to increases in tobacco prices because of a presumably lower disposable income.
We conducted a sensitivity analysis in which a lower price elasticity − 0.5) was used for all ages, as done in a recent
analysis in the United Kingdom13, which resulted in slightly smaller reductions in current smoking prevalences
and corresponding health benefits in the intervention scenarios compared to the reference scenario. Previous
studies in Europe have also used even lower price elasticities (e.g. ranging from − 0.1 to − 0.3 depending on
Scientific Reports | (2021) 11:2311 | https://doi.org/10.1038/s41598-021-81876-3 5
Vol.:(0123456789)www.nature.com/scientificreports/
age-group)24. Individual responses to changing prices are likely to vary by other sociodemographic characteristics
than age (e.g. income, socioeconomic status, sex)25, which were not captured in this analysis. Finally, although we
assumed that the price elasticity of tobacco is the same throughout all three countries, there is evidence to sug-
gest that it may be higher in areas between countries with a large price differential, possibly reflecting increased
large-scale illicit trade and cross-border p urchasing26. However, the true extent of the effect of these factors on
overall smoking prevalence continues to be d ebated27,28.
We also assumed that individuals of the same age group would be similarly affected by a percentage price
increase in all countries despite differences in earnings across countries. Tobacco is most affordable in Italy and
Sweden and least affordable in England. The 2020 weighted average price of a pack of 20 cigarettes in euros was
4.9 in Italy, 5.9 in Sweden and 10.3 in E ngland18. After adjusting for purchasing power parity, the corresponding
prices for the most sold brand of cigarettes in 2018 were 7.35, 7.49 and 13.58 international dollars in Sweden,
Italy and England, respectively19–21. Moreover, one could speculate that age groups of the population with more
limited disposable income, such as adolescents, living in countries where the price of tobacco is already high,
may be more likely to alter their behavior even when small price increases are applied compared to those with
more disposable income. It should also be noted that we did not evaluate how changes in income within a country
over the 40-year timeframe considered may change tobacco consumption and subsequently COPD burden. For
example, economic recessions have been shown to be associated with significant decreases in the prevalence of
smoking29.
Although some previous analyses have modelled the effect of large (50%30) or annual (5% per y ear13) tobacco
price increases, we chose to model the effects of a one-time price increase of 5%, 10% and 20% in our main
analysis, as measures that could be relatively easily and quickly implemented by governments. However, countries
such as Italy where tobacco is more affordable could more easily consider price increases substantially larger than
the 20% modelled as the maximum scenario in the main analysis in order to bring the price of tobacco closer
to that of countries were tobacco is less affordable, such as in the United Kingdom, which would result in larger
public health benefits. This suggests that the health benefits simulated in the main analysis may be conservative
estimates of what could be feasibly achieved, and higher price increases may be warranted. In secondary analyses
in which scenarios of larger price increases of 30%, 40% and 50% were evaluated, greater health benefits were
clearly apparent as would be expected. A strategy consisting of yearly cumulative price increases, instead of a
single one-time price increase, would also undoubtedly yield greater benefits, which suggests our main results
are likely conservative estimates of the potential benefits.
The DYNAMO-HIA model does not account for any other policy-related changes that may occur throughout
the timeframe of the simulation. For example, the reference scenario assumed that the price of tobacco remained
constant, which does not truly reflect reality. In the United Kingdom, the price of all tobacco products increases
2% above Retail Price Index inflation every y ear31. A recent analysis in the United Kingdom evaluated the impact
of a yearly 5% price increase of tobacco above inflation, assuming a price elasticity value of − 0.5. This study found
that 3.3% of incident COPD cases could be avoided in one year, after allowing the simulation to run 20-years,
compared to the reference scenario in which the price of tobacco followed the regulatory 2% yearly i ncrease13. We
attempted to replicate this result as closely as possible following our methods (one-time 5% tobacco price increase
at baseline, price elasticity value of − 0.5). Although the absolute number of COPD incident cases avoided is larger
in our study, we obtained a similar percent reduction in incident COPD cases (4.0%) in one year after running
the simulation 20 years compared to the reference scenario in which no price increase was applied. Differences
between these results are likely due to the use of different data sources (e.g. COPD prevalence data was obtained
from Public Health England and the Office for National Statistics in the previous analysis13, whereas the current
analyses used country-specific data incorporated in DYNAMO-HIA) and price interventions, among other fac-
tors. The countries included in our analysis also differ in terms of their specific existing tobacco control policies,
although all completely (or moderately) meet many of the recommended WHO MPOWER measures to reduce
the demand for tobacco (cessation programs in place, monitoring of smoking prevalence, taxation, advertising
bans, use of health warnings on packaging, etc.)19–21.
Our model was unable to assess how tobacco price increases might change smoking intensity and, the use
of alternative products, such as electronic cigarettes, pipe tobacco or smokeless tobacco products, or the illicit
tobacco trade. A rise in tobacco prices might well increase the use of electronic cigarettes and smokeless tobacco
products, some of which have been suggested to affect health outcomes32,33, although there is currently no con-
sistent evidence for an effect on COPD development. Future work should investigate these unknowns, as 20%
of respondents to the European Eurobarometer survey (in 2017) reported at least trying electronic c igarettes1.
Equalising taxation levels of all tobacco products may be an effective strategy to limit any type of smoking initia-
tion, as advocated by the Framework Convention on Tobacco Control34. Finally, population structure changes
attributable to immigration are not considered within DYNAMO-HIA.
In conclusion, this study demonstrates to policy makers that feasible increases in the price of tobacco which
could easily and quickly be implemented would reduce COPD burden, with modest but still important public
health benefits observed within 40 years. Baseline smoking prevalences and projected changes in population
structure of a country are important factors influencing the effectiveness of the intervention and need to be con-
sidered when comparing the potential impact of tobacco price increases on public health outcomes in different
countries. It is also worthwhile noting that additional benefits of increasing the price of tobacco and a subsequent
decrease in smoking prevalence should be expected. These benefits include lower passive smoking exposures,
higher tobacco taxation revenues that could be used for improving health c are35 and supporting tobacco cessa-
tion initiatives/treatments12, a lower environmental burden of c igarettes36, and importantly, a reduction in the
morbidity and mortality from many other smoking-related diseases.
Scientific Reports | (2021) 11:2311 | https://doi.org/10.1038/s41598-021-81876-3 6
Vol:.(1234567890)www.nature.com/scientificreports/
Methods
The DYNAMO‑HIA model. We used the publicly available and flexible DYNAMO-HIA tool to conduct
the present HIA analysis (https://www.dynamo-hia.eu, version 2.0.8), which has been used to model health
impacts following changes in various risk factors14,15,17,37–42. Our analysis consists of a dynamic Markov-based
multi-state simulation modeling of the age- and sex-specific probabilities of individuals staying in or moving
to a particular risk factor state in different intervention scenarios defined by the user, compared to a reference
scenario. A detailed description of this tool has been published16,43 and is detailed online on the DYNAMO-HIA
website (https://www.dynamo-hia.eu). Summary information of the model specifications is provided in the Sup-
plemental Material. We simulated the effect of changes in smoking prevalence states (current/ex/never smoker)
and rates of transitioning between these states (smoking initiation, cessation and restart) due to increases in local
tobacco prices on future smoking prevalence, COPD prevalence, COPD incidence and gains in life expectancy
in Italy, England and Sweden.
Data sources. The model input parameters consisted of data on demographics, smoking prevalences and
behaviour as well as COPD burden. Except for population size and projected number of newborns, all data were
stratified by sex and year of age for the entire lifespan (0–95 years of age). When data were only available per age
group (e.g. per five years rather than per single year), the same value was applied to all ages in that group. The
relative risk of smoking on COPD was provided by sex and age group (ranged from 8.13 to 19.83) and the rela-
tive risk of smoking on total mortality by sex (2.07 for males and 1.74 for females).
The data used and its sources are summarized in Supplementary Table S6. Most datasets used are integrated
within the DYNAMO-HIA tool16 (further details available: https: //www.dynamo -hia.eu/en/docume nts-and-publi
cations) with three notable exceptions. First, we used updated information on population size and projected num-
ber of newborns obtained from national sources. Second, smoking prevalences were based on recent data from
large country-specific population-based observational studies or representative national surveys, as described
in the Supplementary File and summarised in Supplementary Table S6. Third, the probabilities of transitioning
between smoking states (initiation/cessation/restart) were calculated per age, sex and region in Europe (Italy
considered “South” and England and Sweden both considered “North”, corresponding to the United Nations
geoscheme and tobacco e pidemiology44) using pooled data from six large multicentre observational studies
participating in the ALEC consortium, as previously d escribed5,23.
Tobacco price increase scenarios. Four scenarios were evaluated: the price of tobacco was left unchanged
(“reference scenario”, sometimes labelled as “business-as-usual” scenario) or was increased once by 5%, 10% and
20% above local prices at the beginning of the simulation period (“intervention scenarios”).
The purpose of the reference scenario is to determine future smoking prevalence and burden of COPD if no
intervention takes place. Accordingly, no changes were applied to the smoking state prevalences or probabilities
of transitioning between smoking states.
In the three intervention scenarios, the price elasticity of demand for tobacco (i.e. the percentage change
in consumption resulting from a 1% increase in price) was used to calculate the impact of increasing tobacco
prices on smoking prevalence and the probabilities of transitioning between smoking states. In line with previous
work13,45, we used − 0.5 as the coefficient of price elasticity for adults (≥ 30 years of age). For younger popula-
tions who are more sensitive to price changes, we assumed a higher coefficient of price elasticity of − 0.75 for
19–29 year-olds and − 1.5 for < 19 year-olds46,47. In a sensitivity analysis, we repeated the analysis using − 0.5 as
ingdom13.
the coefficient of price elasticity for all ages, as done recently in an analysis in the United K
Statistical analyses. All possible smoking states were categorized as never, former and current. Addition-
ally, we made the following assumptions:
• Smoking could only begin as of 11 years of age, since it has been reported that uptake of smoking at younger
ages is unlikely5;
• Smoking cessation was only possible as of 16 years of age23. Restarting smoking was only possible as of
22 years of age. These cut-offs were selected because of the difficulty in generating precise estimates of ces-
sation and restart rates at younger ages because of data sparseness;
• As summarized in Table 4, an increase in tobacco price would affect both the prevalence of never smokers
(as fewer people start smoking) and former smokers (as current smokers quit) by the same percentage. Con-
sequently, the prevalence of current smokers was calculated as the complement to 100% of the prevalence
of never and former smokers. We also assumed that the rates of initiation, cessation and restart would be
affected by the same percentage. All changes were assumed to occur at the beginning of the simulation (i.e.
there is no delay in the delivery of the intervention);
• As COPD onset is rarer before age 40 years, COPD prevalence was only considered as of this a ge48.
Using a simulated population for each year of age (from 0 to 95) and sex, we performed country-specific
analyses over a 40-year time period (from 2018 to 2058). Given the long latency period of COPD, this long
timeframe was required to allow changes in COPD prevalence due to changes in smoking patterns in younger
age groups to be observed. All figures were created using the statistical program R (version 3.6.2)49 except Figure
S10 which was created using the DYNAMO-HIA tool.
Scientific Reports | (2021) 11:2311 | https://doi.org/10.1038/s41598-021-81876-3 7
Vol.:(0123456789)www.nature.com/scientificreports/
Age groups
11–15 years 16–18 years 19–21 years 22–29 years > 30 years
Price elasticity coefficienta − 1.5 − 1.5 − 0.75 − 0.75 − 0.5
↓of (100 − (never + for- ↓ of (100 − (never + for- ↓ of (100 − (never + for- ↓ of (100 − (never + for-
Current ↓ of (100 – never)
mer)) mer)) mer)) mer))
↑ of (1.5)•(% price ↑ of (0.75)•(% price ↑ of (0.75)•(% price ↑ of (0.5)•(% price
Smoking prevalence Former NA
increase) increase) increase) increase)
↑ of (1.5)•(% price ↑ of (1.5)•(% price ↑of (0.75)•(% price ↑ of (0.75)•(% price ↑ of (0.5)•(% price
Never
change) increase) increase) increase) increase)
↓ of (1.5)•(% price ↓ of (1.5)•(% price ↓ of (0.75)•(% price ↓ of (0.75)•(% price ↓ of (0.5)•(% price
Initiation
change) increase) increase) increase) increase)
Smoking state prob- ↑ of (1.5)•(% price ↑ of (0.75)•(% price ↑ of (0.75)•(% price ↑ of (0.5)•(% price
Cessation NA
abilities increase) increase) increase) increase)
↓ of (0.75)•(% price ↓ of (0.5)•(% price
Restart NA NA NA
increase) increase)
Table 4. Predicted changes in smoking prevalence and smoking state probabilities attributable to a one-time
tobacco price increase. NA = no change possible because of constraints placed on age ranges (e.g. smoking
cessation only possible ≥ 16 years of age). a Defined as the percentage change in tobacco per 1% increase in
tobacco price.
Secondary analyses. We a priori chose to model the effects of a one-time price increase of 5%, 10% and
20% in our main analysis as measures that could be relatively easily and quickly implemented by governments.
In a secondary post-hoc analysis, we estimated the health benefits that would be expected if larger tobacco price
increases of 30%, 40% and 50% were used instead, which would be harder to implement by governments but
would likely lead to larger reductions in smoking prevalence and corresponding COPD burden.
Data availability
Nearly all data used are publicly available (data sources listed in Table S6). Only components of the smoking
prevalence data as well as the smoking initiation, restart and cessation probabilities have not previously been
published and are available to interested researchers from the corresponding author upon reasonable request.
Received: 23 July 2020; Accepted: 12 January 2021
References
1. European Union. Attitudes of Europeans towards tobacco and electronic cigarettes. https://op.europa.eu/en/publication-detail/-/
publication/2f01a3d1-0af2-11e8-966a-01aa75ed71a1 (2018).
2. Eisner, M. D. et al. An official American Thoracic Society public policy statement: novel risk factors and the global burden of
chronic obstructive pulmonary disease. Am. J. Respir. Crit. Care Med. 182, 693–718 (2010).
3. Soriano, J. B. et al. Global, regional, and national deaths, prevalence, disability-adjusted life years, and years lived with disability
for chronic obstructive pulmonary disease and asthma, 1990–2015: a systematic analysis for the Global Burden of Disease Study
2015. Lancet Respir. Med. 5, 691–706 (2017).
4. European Commission. Tobacco products directive (2014/40/EU). https://www.ec.europa.eu/health/tobacco/products_en (2014).
5. Marcon, A. et al. Trends in smoking initiation in Europe over 40 years: a retrospective cohort study. PLoS ONE 13, e0201881 (2018).
6. Hawkins, S. S., Bach, N. & Baum, C. F. Impact of tobacco control policies on adolescent smoking. J. Adolesc. Health 58, 679–685
(2016).
7. Otavova, M. et al. Potential impact of reduced tobacco use on life and health expectancies in Belgium. Int. J. Public Health 65,
129–138 (2020).
8. Accordini, S. et al. A three-generation study on the association of tobacco smoking with asthma. Int. J. Epidemiol. 47, 1106–1117
(2018).
9. McGee, C. E. et al. Influence of family and friend smoking on intentions to smoke and smoking-related attitudes and refusal self-
efficacy among 9–10 year old children from deprived neighbourhoods: a cross-sectional study. BMC Public Health 15, 225 (2015).
10. Milton, B., Woods, S. E., Dugdill, L., Porcellato, L. & Springett, R. J. Starting young? Children’s experiences of trying smoking
during pre-adolescence. Health Educ. Res. 23, 298–309 (2008).
11. Gilbert, C. J. Which are the most effective and cost-effective interventions for tobacco control? Copenhagen, WHO Regional Office
for Europe. http://www.euro.who.int/document/e82993.pdf (2003).
12. World Health Organization. MPOWER. http://www.who.int/tobacco/mpower/en/ (2020).
13. Knuchel-Takano, A. et al. Modelling the implications of reducing smoking prevalence: the benefits of increasing the UK tobacco
duty escalator to public health and economic outcomes. Tob. Control 27, e124–e129 (2018).
14. Kulik, M. C. et al. Comparison of tobacco control scenarios: quantifying estimates of long-term health impact using the DYNAMO-
HIA modeling tool. PLoS ONE 7, e32363 (2012).
15. Holm, A. L., Brønnum-Hansen, H., Robinson, K. M. & Diderichsen, F. Assessment of health impacts of decreased smoking preva-
lence in Copenhagen: application of the DYNAMO-HIA model. Scand. J. Public Health 42, 409–416 (2014).
16. Lhachimi, S. K. et al. DYNAMO-HIA—a dynamic modeling tool for generic Health Impact Assessments. PLoS ONE 7, e33317
(2012).
17. Lhachimi, S. K. et al. Health impacts of increasing alcohol prices in the European Union: a dynamic projection. Prev. Med. 55,
237–243 (2012).
18. European Commission. Taxes in Europe database v3.16.0. https: //ec.europa .eu/taxati on_custom s/tedb/splSea rchFo
rm.html (2020).
19. World Health Organization. WHO report on the global tobacco epidemic. MPOWER country profile Sweden. www.who.int/tobac
co/surveillance/policy/countr y_profile/swe.pdf?ua=1 (2019).
Scientific Reports | (2021) 11:2311 | https://doi.org/10.1038/s41598-021-81876-3 8
Vol:.(1234567890)www.nature.com/scientificreports/
20. World Health Organization. WHO report on the global tobacco epidemic. MPOWER country profile Italy. www.who.int/tobac
co/surveillance/policy/countr y_profile/ita.pdf?ua=1 (2019).
21. World Health Organization. WHO report on the global tobacco epidemic. MPOWER country profile United Kingdom of Great
Britain and Northern Ireland. www.who.int/tobacco/surveillance/policy/countr y_profile/gbr.pdf?ua=1 (2019).
22. Rehman, A. et al. The economic burden of chronic obstructive pulmonary disease (COPD) in Europe: results from a systematic
review of the literature. Eur. J. Health Econ. 21, 181–194 (2020).
23. Pesce, G. et al. Time and age trends in smoking cessation in Europe. PLoS ONE 14, e0211976 (2019).
24. Levy, D. T., Huang, A.-T., Currie, L. M. & Clancy, L. The benefits from complying with the framework convention on tobacco
control: a SimSmoke analysis of 15 European nations. Health Policy Plan. 29, 1031–1042 (2014).
25. Farrelly, M. C., Bray, J. W., Pechacek, T. & Woollery, T. Response by adults to increases in cigarette prices by sociodemographic
characteristics. S. Econ. J. 68, 156–165 (2001).
26. Almeida, A., Golpe, A. A., Iglesias, J. & Martín Álvarez, J. M. The price elasticity of cigarettes: new evidence from Spanish regions,
2002–2016. Nicotine Tob. Res. https://doi.org/10.1093/ntr/ntaa131 (2020).
27. Chaloupka, F. J. Taxes, prices and illicit trade: the need for sound evidence. Tob. Control 23, e1–e2 (2014).
28. Schwartz, R. & Zhang, B. Debunking the taxation–contraband tobacco myth. Can. Med. Assoc. J. 188, 401–402 (2016).
29. Martín Álvarez, J. M., Golpe, A. A., Iglesias, J. & Ingelmo, R. Price and income elasticities of demand for cigarette consumption:
what is the association of price and economic activity with cigarette consumption in Spain from 1957 to 2016? Public Health 185,
275–282 (2020).
30. Global Tobacco Economics Consortium. The health, poverty, and financial consequences of a cigarette price increase among 500
million male smokers in 13 middle income countries: compartmental model study. The BMJ 361; https://doi.org/10.1136/bmj.
k1162(2018).
31. HM Revenue & Customs. Tobacco products duty rates. https: //www.gov.uk/govern ment/ public ation
s/tobacc o-produc ts-duty-rates
-for-2018/tobacco-products-duty-rates-2018 (2018).
32. World Health Organization. Scientific Advisory Committee on Tobacco Products Regulation. Recommendation on smokeless
tobacco products. www.who.int/tobacco/sactob/recommendations/en/smokeless_en.pdf (2002).
33. Critchley, J. A. & Unal, B. Health effects associated with smokeless tobacco: a systematic review. Thorax 58, 435–443 (2003).
34. World Health Organization. WHO report on the global tobacco epidemic: monitoring tobacco use and prevention policies. http://
www.who.int/tobacco/en (2017).
35. Yeh, C.-Y., Schafferer, C., Lee, J.-M., Ho, L.-M. & Hsieh, C.-J. The effects of a rise in cigarette price on cigarette consumption, tobacco
taxation revenues, and of smoking-related deaths in 28 EU countries: applying threshold regression modelling. BMC Public Health
17, 676 (2017).
36. Zafeiridou, M., Hopkinson, N. S. & Voulvoulis, N. Cigarette smoking: an assessment of tobacco’s global environmental footprint
across its entire supply chain. Environ. Sci. Technol. 52, 8087–8094 (2018).
37. Kang, E. Assessing health impacts of pictorial health warning labels on cigarette packs in Korea using DYNAMO-HIA. J. Prev.
Med. Pub. Health 50, 251–261 (2017).
38. Fischer, F. & Kraemer, A. Health Impact Assessment for second-hand smoke exposure in Germany—quantifying estimates for
ischaemic heart diseases, COPD, and stroke. Int. J. Environ. Res. Public. Health 13, 198 (2016).
39. Lhachimi, S. K. et al. Modelling obesity outcomes: reducing obesity risk in adulthood may have greater impact than reducing
obesity prevalence in childhood. Obes. Rev. 14, 523–531 (2013).
40. Mansfield, T. J. & MacDonald Gibson, J. Health impacts of increased physical activity from changes in transportation infrastructure:
quantitative estimates for three communities. BioMed Res. Int. 2015, e812325 (2015).
41. Hendriksen, M. A. H., van Raaij, J. M. A., Geleijnse, J. M., Breda, J. & Boshuizen, H. C. Health gain by salt reduction in Europe: a
modelling study. PLoS ONE 10, e0118873 (2015).
42. Erkoyun, E., Sözmen, K., Bennett, K., Unal, B. & Boshuizen, H. C. Predicting the health impact of lowering salt consumption in
Turkey using the DYNAMO Health Impact Assessment tool. Public Health 140, 228–234 (2016).
43. Boshuizen, H. C. et al. The DYNAMO-HIA Model: An efficient implementation of a risk factor/chronic disease Markov model
for use in Health Impact Assessment (HIA). Demography 49, 1259–1283 (2012).
44. Bilano, V. et al. Global trends and projections for tobacco use, 1990–2025: an analysis of smoking indicators from the WHO
comprehensive information systems for tobacco control. The Lancet 385, 966–976 (2015).
45. Chaloupka, F., Cummings, K., Morley, C. & Horan, J. Tax, price and cigarette smoking: evidence from the tobacco documents and
implications for tobacco company marketing strategies. Tob. Control 11, i62–i72 (2002).
46. Chaloupka, F., Hu, T., Warner, K., Jacobs, R. & Yurekli, A. The Taxation of Tobacco Products in Tobacco Control in Developing
Countries. 237–272 (Oxford, Oxford University Press, 2000).
47. Ranson, M. K., Jha, P., Chaloupka, F. J. & Nguyen, S. N. Global and regional estimates of the effectiveness and cost-effectiveness
of price increases and other tobacco control policies. Nicotine Tob. Res. 4, 311–319 (2002).
48. Global Initiative for Chronic Obstructive Lung Disease. Diagnosis of diseases of chronic airflow limitation: asthma COPD and
asthma—COPD overlap syndrome (ACOS). https://goldcopd.org/wp-content/uploads/2016/04/GOLD_ACOS_2015.pdf (2015).
49. R Core Team. R: A language and environment for statistical computing. R Foundation for Statistical Computing, Vienna, Austria.
https://www.R-project.org/. (2019).
Acknowledgements
This work was supported by the Ageing Lungs in European Cohorts (ALEC) study (https://www.alecstudy.org),
which has received funding from the European Union’s Horizon 2020 research and innovation programme under
grant agreement No. 633212. The funding source was not involved in the study design, in the collection, analysis
and interpretation of data, the writing of the report and in the decision to submit the article for publication.
Author contributions
E.F., A.M., L.P., G.P., S.K.L., V.J., L.C., A.A., J.K.Q., D.J., C.J., S.A. and C.M. made substantial contributes to the
conception and design of the work as well as the acquisition, analysis and interpretation of the data. S.K.L. created
the DYNAMO-HIA software used. EF drafted the work and all other authors substantively revised it. All authors
have approved the submitted version, agree to be personally accountable for their own contribution, and will
ensure that questions related to the accuracy or integrity of any part of the work are appropriately investigated,
resolved, and the resolution documented in the literature.
Competing interests
The authors declare no competing interests.
Scientific Reports | (2021) 11:2311 | https://doi.org/10.1038/s41598-021-81876-3 9
Vol.:(0123456789)www.nature.com/scientificreports/
Additional information
Supplementary Information The online version contains supplementary material available at https://doi.
org/10.1038/s41598-021-81876-3.
Correspondence and requests for materials should be addressed to E.F.
Reprints and permissions information is available at www.nature.com/reprints.
Publisher’s note Springer Nature remains neutral with regard to jurisdictional claims in published maps and
institutional affiliations.
Open Access This article is licensed under a Creative Commons Attribution 4.0 International
License, which permits use, sharing, adaptation, distribution and reproduction in any medium or
format, as long as you give appropriate credit to the original author(s) and the source, provide a link to the
Creative Commons licence, and indicate if changes were made. The images or other third party material in this
article are included in the article’s Creative Commons licence, unless indicated otherwise in a credit line to the
material. If material is not included in the article’s Creative Commons licence and your intended use is not
permitted by statutory regulation or exceeds the permitted use, you will need to obtain permission directly from
the copyright holder. To view a copy of this licence, visit http://creativecommons.org/licenses/by/4.0/.
© The Author(s) 2021
Scientific Reports | (2021) 11:2311 | https://doi.org/10.1038/s41598-021-81876-3 10
Vol:.(1234567890)You can also read