A Low-Cost, High-Throughput Digital Image Analysis of Stain Patterns on Smoked Cigarette Filter Butts to Estimate Mainstream Smoke Exposure - MDPI

Page created by Tony Casey
 
CONTINUE READING
A Low-Cost, High-Throughput Digital Image Analysis of Stain Patterns on Smoked Cigarette Filter Butts to Estimate Mainstream Smoke Exposure - MDPI
International Journal of
               Environmental Research
               and Public Health

Article
A Low-Cost, High-Throughput Digital Image Analysis of Stain
Patterns on Smoked Cigarette Filter Butts to Estimate
Mainstream Smoke Exposure
Clifford H. Watson * , Jane Yan, Stephen Stanfill, Liza Valentin-Blasini, Roberto Bravo Cardenas
and Benjamin C. Blount

                                          U.S. Division of Laboratory Sciences, Centers for Disease Control and Prevention, 4770 Buford Highway,
                                          NE MS F-55, Atlanta, GA 30341, USA; xay3@cdc.gov (J.Y.); zsa1@cdc.gov (S.S.); lbv5@cdc.gov (L.V.-B.);
                                          zlg9@cdc.gov (R.B.C.); bkb3@cdc.gov (B.C.B.)
                                          * Correspondence: cow1@cdc.gov; Tel.: +1-(770)-488-7638

                                          Abstract: Standard machine smoking protocols provide useful information for examining the impact
                                          of design parameters, such as filter ventilation, on mainstream smoke delivery. Unfortunately, their
                                          results do not accurately reflect human smoke exposure. Clinical research and topography devices
                                          in human studies yield insights into how products are used, but a clinical setting or smoking a
                                cigarette attached to such a device may alter smoking behavior. To better understand smokers’ use of
         
                                          filtered cigarette products in a more natural environment, we developed a low-cost, high-throughput
Citation: Watson, C.H.; Yan, J.;          approach to estimate mainstream cigarette smoke exposure on a per-cigarette basis. This approach
Stanfill, S.; Valentin-Blasini, L.;       uses an inexpensive flatbed scanner to scan smoked cigarette filter butts and custom software to
Bravo Cardenas, R.; Blount, B.C.
                                          analyze tar-staining patterns. Total luminosity, or optical staining density, of the scanned images
A Low-Cost, High-Throughput
                                          provides quantitative information proportional to mainstream smoke-constituent deliveries on a
Digital Image Analysis of Stain
                                          cigarette-by-cigarette basis. Duplicate sample analysis using this new approach and our laboratory’s
Patterns on Smoked Cigarette Filter
                                          gold-standard liquid chromatography/tandem mass spectrometry (LC/MS/MS) solanesol method
Butts to Estimate Mainstream Smoke
Exposure. Int. J. Environ. Res. Public    yielded comparable results (+7% bias) from the analysis of 20 commercial cigarettes brands (menthol
Health 2021, 18, 10546. https://          and nonmentholated). The brands varied in design parameters such as length, filter ventilation,
doi.org/10.3390/ijerph181910546           and diameter. Plots correlating the luminosity to mainstream smoked-nicotine deliveries on a per-
                                          cigarette basis for these cigarette brands were linear (average R2 > 0.91 for nicotine and R2 > 0.83
Academic Editors: E.                      for the tobacco-specific nitrosamine NNK), on a per-brand basis, with linearity ranging from 0.15 to
Melinda Mahabee-Gittens and               3.00 mg nicotine/cigarette. Analysis of spent cigarette filters allows exposures to be characterized on
Ashley L. Merianos                        a per-cigarette basis or a “daily dose” via summing across results from all filter butts collected over
                                          a 24 h period. This scanner method has a 100-fold lower initial capital cost for equipment than the
Received: 28 July 2021
                                          LC/MS/MS solanesol method and provides high-throughput results (~200 samples per day). Thus,
Accepted: 4 October 2021
                                          this new method is useful for characterizing exposure related to filtered tobacco-product use.
Published: 8 October 2021

                                          Keywords: cigarette; filter butts; nicotine; tar; smoke exposure
Publisher’s Note: MDPI stays neutral
with regard to jurisdictional claims in
published maps and institutional affil-
iations.
                                          1. Introduction
                                               Cigarette smoking remains a leading preventable cause of premature death in the
                                          United States [1]. Tobacco smoke contains a complex mixture of more than 4000 chem-
Copyright: © 2021 by the authors.
                                          icals [2]. Inhaling harmful chemicals from cigarette smoke is associated with increased
Licensee MDPI, Basel, Switzerland.
                                          risk of cancer, birth defects, and heart disease [2–4]. The International Agency for Re-
This article is an open access article    search on Cancer [5] groups individual chemicals and chemical mixtures according to their
distributed under the terms and           carcinogenicity in humans, and has classified whole cigarette smoke as a known human
conditions of the Creative Commons        carcinogen related to numerous cancers. Understanding specific chemical deliveries from
Attribution (CC BY) license (https://     mainstream cigarette smoke under natural conditions is important to help assess nicotine
creativecommons.org/licenses/by/          addiction and health risks related to other chemical exposures from cigarette use.
4.0/).

Int. J. Environ. Res. Public Health 2021, 18, 10546. https://doi.org/10.3390/ijerph181910546                  https://www.mdpi.com/journal/ijerph
A Low-Cost, High-Throughput Digital Image Analysis of Stain Patterns on Smoked Cigarette Filter Butts to Estimate Mainstream Smoke Exposure - MDPI
Int. J. Environ. Res. Public Health 2021, 18, 10546                                                                           2 of 10

                                              Determining the mainstream cigarette smoke delivery of nicotine and other harmful
                                        chemicals under real-world conditions is challenging. Modern smoking machines that use
                                        fixed smoking regimens are often used to establish regulatory limits for specific cigarette
                                        yields. Such measurements can be useful to make product-to-product comparisons, but are
                                        poor predictors of actual smoker exposure because human smoking behaviors are typically
                                        much more diverse [6–8]. Machine smoking regimens use fixed puff volumes, durations,
                                        and intervals. Smokers, however, do not smoke each cigarette the same way. Different
                                        smokers, using the same brand, can have very different smoking behaviors based on their
                                        individual, time-specific nicotine cravings [9]. By changing puff volume, time interval
                                        between puffs, and the potential filter vent-hole obstruction with lips or fingers, smokers
                                        can easily influence their inhalation of smoke constituents [10–12].
                                              Previous researchers have used many approaches for examining exposures to nicotine
                                        and other harmful or potentially harmful constituents in mainstream tobacco smoke. These
                                        methods have included questionnaires [13], the use of topography devices to record air
                                        flow drawn through a cigarette during a smoking session [14], analysis of urine or saliva
                                        for exposure biomarkers [15], and measurement of exhaled carbon monoxide [11]. While
                                        these methods provide useful data, nonbiomarker methods can vary in accuracy and
                                        interpretation [16–18] and alter how a person smoke [19]. Furthermore, collecting physio-
                                        logical fluids for biomarker measurement can be invasive and biomarker concentrations
                                        are time-averaged measures (not specific to each cigarette smoked) influenced by time of
                                        last use and individual metabolic differences [16,19].
                                              Solanesol (and other mainstream smoke constituents) accumulates in cigarette filter
                                        butts during smoking and can be measured to accurately assess the intensity with which
                                        each cigarette is smoked [20–22]. Such analyses can provide crucial data on nicotine
                                        and smoke toxicant deliveries to better understand addiction and other harms related
                                        to smoking. Additionally, using smoked filter butts to characterize how people smoke
                                        cigarettes and examine the body burden of harmful chemicals can help determine whether
                                        new regulations meaningfully reduce or otherwise impact exposure. Multiple research
                                        groups have estimated smoke intake by using various forms of filter analyses [23–30].
                                              Filter-butt analysis approaches are also useful because data can be obtained on a per-
                                        cigarette basis under more natural, real-world conditions. Such information provides data
                                        related to smoke constituent deliveries as well as behavioral use patterns. Our laboratory
                                        successfully used this method to examine the difference in deliveries of nicotine and
                                        tobacco-specific nitrosamines [31], the influence of menthol on smoking behavior [32],
                                        differences in smoking behaviors in a clinical setting [33], and changes in smoking when
                                        cigarette nicotine content is reduced [34,35]. This new luminosity-based, digital-image
                                        approach is a low-cost, high-throughput method that provides comparable results to our
                                        established liquid chromatography/tandem mass spectrometry (LC/MS/MS) solanesol
                                        method [21,22].

                                        2. Materials and Methods
                                        2.1. Cigarette Styles Analyzed
                                             To demonstrate the feasibility and utility of this approach, we purchased 20 cigarette
                                        brands from a local vendor (Lab Depot, Dawsonville, GA, USA). The cigarettes were
                                        selected with a range of different physical properties to reflect the diversity of products
                                        on the market. These cigarette brands were of two different lengths: ten king-size brands
                                        and ten 100s brands (~84 mm and ~100 mm, respectively). The cigarettes were a mixture
                                        of mentholated and nonmentholated brands (11 and 9 brands, respectively) with filter-
                                        ventilation levels ranging from 0% to 56%. Eighteen brands had the standard cigarette
                                        diameter and two brands were slim varieties (7.5 mm and 5 mm, respectively). Upon
                                        receipt of the products from the vendor, unopened cigarette packs were logged into the
                                        products database, labeled, placed in resealable storage bags, and stored at −70 ◦ C until
                                        analysis.
A Low-Cost, High-Throughput Digital Image Analysis of Stain Patterns on Smoked Cigarette Filter Butts to Estimate Mainstream Smoke Exposure - MDPI
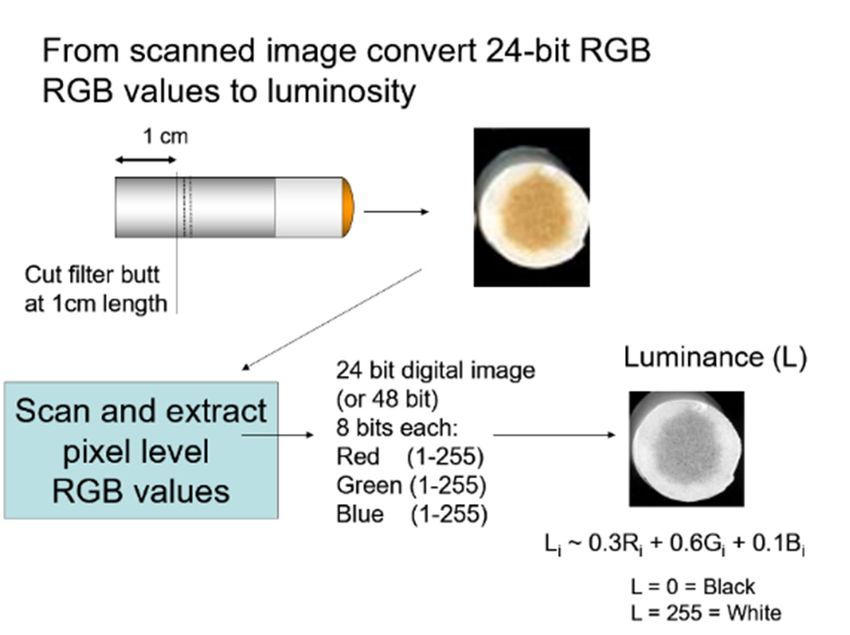
Int. J. Environ. Res. Public Health 2021, 181, 546                                                                                                    3 of 10

                                          the10546
Int. J. Environ. Res. Public Health 2021, 18,  productsfrom the vendor, unopened cigarette packs were logged into the products3 of 10
                                         database, labeled, placed in resealable storage bags, and stored at −70 °C until analysis.

                                         2.2. Correlating Filter-Stain Patterns with Mainstream Smoke Deliveries
                                        2.2. Correlating Filter-Stain Patterns with Mainstream Smoke Deliveries
                                               Cigarettes were conditioned in an environmental chamber at 22 °C and 60% humidity
                                                                                                                                    ◦ C and 60% humidity
                                         for a minimumwere
                                              Cigarettes      of 24conditioned      in an environmental
                                                                      h prior to smoking.                        chamberlinear
                                                                                                  An SM450 16-port           at 22 smoking      machine (Ce-
                                        for a minimum
                                         rulean,              of 24 h UK)
                                                   Milton Keynes,        priorwasto smoking.         An SM450
                                                                                       used for machine             16-portSystematic
                                                                                                               smoking.        linear smoking
                                                                                                                                           variation machine
                                                                                                                                                         of puff
                                        (Cerulean,    Milton     Keynes,    UK)     was     used   for machine     smoking.
                                         volume, puff frequency, and filter-ventilation blocking provided a wide range of smoking Systematic    variation    of
                                        puff  volume,     puff    frequency,     and     filter-ventilation     blocking    provided
                                         conditions and resultant mainstream smoke deliveries. Cigarettes were smoked under an            a  wide    range   of
                                        smoking     conditions
                                         ISO standard      smoking and regimen
                                                                         resultant (5  mainstream
                                                                                           cigarettes smoke
                                                                                                        per pad, deliveries.
                                                                                                                    35 mL puff,  Cigarettes
                                                                                                                                      2s puffwere     smoked
                                                                                                                                                duration,    60s
                                        under   an  ISO  standard     smoking      regimen     (5  cigarettes  per  pad,   35 mL
                                         puff interval, filter vent holes unobstructed) and an intensive regimen (3 cigarettes per  puff, 2s  puff  duration,
                                        60s puff interval, filter vent holes unobstructed) and an intensive regimen (3 cigarettes per
                                         pad, 55 mL puff, 2s puff duration, 30s puff interval, filter vent holes completely blocked).
                                        pad, 55 mL puff, 2s puff duration, 30s puff interval, filter vent holes completely blocked).
                                         All measurements were made in triplicate. For ISO smoking, total particulate matter
                                        All measurements were made in triplicate. For ISO smoking, total particulate matter (TPM)
                                         (TPM) was collected from smoking runs with 2 puffs, 4 puffs, and normal butt termination
                                        was collected from smoking runs with 2 puffs, 4 puffs, and normal butt termination (puff
                                         (puff count when cigarette coal reached a 3 mm distance from the filter paper overwrap).
                                        count when cigarette coal reached a 3 mm distance from the filter paper overwrap). For
                                         For intense smoking, TPM was collected from smoking runs with 4 puffs, 6 puffs, and
                                        intense smoking, TPM was collected from smoking runs with 4 puffs, 6 puffs, and normal
                                         normal butt termination (puff count when cigarette coal reached a 3 mm distance from
                                        butt termination (puff count when cigarette coal reached a 3 mm distance from the filter
                                         the filter paper overwrap). This smoking protocol provided a roughly uniform distribu-
                                        paper overwrap). This smoking protocol provided a roughly uniform distribution of six
                                         tion of six variable mainstream smoke deliveries for each cigarette brand.
                                        variable mainstream smoke deliveries for each cigarette brand.
                                               The mainstream smoke TPM for each smoking regimen/puff count combination was
                                              The mainstream smoke TPM for each smoking regimen/puff count combination was
                                         measured for nicotine [36] and the tobacco-specific nitrosamine 4-(methylnitrosamino)-1-
                                        measured for nicotine [36] and the tobacco-specific nitrosamine 4-(methylnitrosamino)-
                                         (3-pyridyl)-1-butanone (NNK)
                                        1-(3-pyridyl)-1-butanone          (NNK)[37].  [37].TheThecorresponding
                                                                                                    corresponding    cigarette
                                                                                                                        cigarette  butts were
                                                                                                                                     butts   werecollected
                                                                                                                                                    collectedfor
                                        for subsequent digital and solanesol analyses (Figure 1). A scalpel was used to cut theat
                                         subsequent     digital    and   solanesol     analyses     (Figure  1).  A scalpel   was    used   to cut  the  butt
                                         a length
                                        butt         of 1 cm
                                              at a length   of from
                                                                 1 cm the
                                                                        frommouth
                                                                               the mouthend, preserving
                                                                                               end, preservingventilation    holes holes
                                                                                                                     ventilation      so their  effects
                                                                                                                                             so their     could
                                                                                                                                                        effects
                                        could also be captured. The cleanly cut inner surface of the filter butt was digitally scannedat
                                         also  be  captured.     The   cleanly    cut   inner   surface   of  the  filter  butt   was  digitally   scanned
                                        at600
                                           600dpi
                                                dpiusing
                                                      usinga standard
                                                               a standard  commercial
                                                                               commercial    CCD-based,
                                                                                                 CCD-based,   color  flatbed
                                                                                                                  color         scanner
                                                                                                                          flatbed         (HP (HP
                                                                                                                                     scanner    ScanJet    4670,
                                                                                                                                                       ScanJet
                                         HP   Inc, Palo  Alto,    CA,   USA;    https://support.hp.com/us-en/product/hp-scanjet-4670-scan-
                                        4670, HP Inc., Palo Alto, CA, USA; https://support.hp.com/us-en/product/hp-scanjet-
                                         ner-series/303640/manuals, accessed on
                                        4670-scanner-series/303640/manuals,                       31 August
                                                                                              accessed   on 312021).
                                                                                                                  August  The    scanner’s
                                                                                                                             2021).           OEM software
                                                                                                                                      The scanner’s      OEM
                                         was   used   without     modification      to   scan   the  images;   autocorrection
                                        software was used without modification to scan the images; autocorrection exposure          exposure     and contrast
                                                                                                                                                           and
                                         featuresfeatures
                                        contrast    were all were
                                                                turned alloff. All images
                                                                           turned      off. Allwere    collected
                                                                                                  images            using 600using
                                                                                                           were collected         dpi scanning
                                                                                                                                         600 dpi resolution.
                                                                                                                                                    scanning
                                         To provideToconsistent
                                        resolution.                    images and
                                                          provide consistent              enable
                                                                                     images     and accurate
                                                                                                      enable scan-to-scan        comparisons,
                                                                                                               accurate scan-to-scan              a reference
                                                                                                                                            comparisons,      a
                                         target strip,
                                        reference   targetKodak      Q-13, Eastman
                                                            strip, Kodak     Q-13, Eastman   Kodak     Company,
                                                                                                    Kodak  Company,  Rochester,
                                                                                                                           Rochester,NY;NY,https://www.ko-
                                                                                                                                              USA; https://
                                         dak.com/en/motion/page/color-separation-guides-and-gray-scales, accessedaccessed
                                        www.kodak.com/en/motion/page/color-separation-guides-and-gray-scales,                                     on 31 Au- on
                                         gust  2021)   was   included     with   each     scan  to  reproducibly     set  the
                                        31 August 2021) was included with each scan to reproducibly set the white and black   white    and   black   points  for
                                                                                                                                                        points
                                         each
                                        for    scan.
                                            each       After
                                                   scan.      scanning,
                                                          After             the butts
                                                                    scanning,    the butts werewere
                                                                                                  analyzed    by our
                                                                                                       analyzed     byquantitative
                                                                                                                        our quantitativeLC/MS/MS
                                                                                                                                               LC/MS/MS solane-
                                         sol method
                                        solanesol       [21] to[21]
                                                     method       allow   directdirect
                                                                      to allow     comparison        of theoftwo
                                                                                            comparison         theapproaches.
                                                                                                                    two approaches.

                                        Figure 1. Protocol for measuring human smoke exposure using digital imaging and chemical analysis
                                        ofFigure
                                           spent 1. Protocol
                                                  cigarette    for measuring human smoke exposure using digital imaging and chemical anal-
                                                            filters.
                                         ysis of spent cigarette filters.
                                              Scanning the inside surface of a 1 cm, cleanly cut filter butt provides a clean image
                                        free of debris (e.g., tobacco flakes, dust, and lipstick). The cut position is limited because
                                        the filter ventilation holes in many cigarette brands are ~12–13 mm from the mouth end.
                                        We experimented with shorter cuts (data not shown) but found the 10 mm cut optimal as
Int. J. Environ. Res. Public Health 2021, 181, 546                                                                                             4 of 10

                                                  Scanning the inside surface of a 1 cm, cleanly cut filter butt provides a clean image
                                           free
Int. J. Environ. Res. Public Health 2021, 18,    of debris (e.g., tobacco flakes, dust, and lipstick). The cut position is limited because
                                              10546                                                                                             4 of 10
                                           the filter ventilation holes in many cigarette brands are ~12–13 mm from the mouth end.
                                           We experimented with shorter cuts (data not shown) but found the 10 mm cut optimal as
                                           it provided the maximum sample to extract and analyze in order to optimize sensitivity.
                                         itEach
                                            provided      the maximum
                                                   individually     scanned   sample     to extract
                                                                                 filter-butt   imageand    analyze in
                                                                                                      is analyzed      order
                                                                                                                    using     to optimize
                                                                                                                           software        sensitivity.
                                                                                                                                      developed   using
                                         Each   individually       scanned     filter-butt   image  is  analyzed  using   software
                                           Visual Basic (code available upon request) to determine the corresponding luminance      developed   using
                                        Visual
                                           (Figure  Basic   (code
                                                      2). The       available
                                                                luminance         uponcorrelated
                                                                              is then     request) to    determine
                                                                                                     to the          the corresponding
                                                                                                             smoke delivery               luminance
                                                                                                                               from each butt. Because
                                        (Figure     2). The    luminance     is then   correlated  to  the smoke  delivery   from  each
                                           of the differences in filter designs (e.g., length, fiber denier, porosity, and ventilation),butt. Becausethe
                                         offilter
                                             the differences      in filter
                                                   efficiency varies        designs
                                                                          from    brand (e.g., length,Brand-specific
                                                                                           to brand.    fiber denier, porosity,  and curves
                                                                                                                        correlation  ventilation),
                                                                                                                                             were the
                                                                                                                                                   thus
                                         filter efficiency
                                           constructed          varies the
                                                             relating   from    brand to of
                                                                            luminosity      brand.
                                                                                                each Brand-specific
                                                                                                     filter’s image tocorrelation   curves were
                                                                                                                        the corresponding        thus
                                                                                                                                              measured
                                         constructed       relating   the
                                           mainstream smoke deliveries.    luminosity     of  each filter’s image  to  the corresponding    measured
                                         mainstream smoke deliveries.

                                         Figure2.2.Example
                                       Figure      Example of
                                                           of captured
                                                              captured image
                                                                       image and
                                                                             and determination
                                                                                 determinationofofthe
                                                                                                   thecorresponding
                                                                                                       correspondingluminosity value
                                                                                                                      luminosity     (1-
                                                                                                                                 value
                                         255).
                                       (1-255).

                                             Theluminosity
                                            The  luminositywas
                                                             wascalculated
                                                                 calculatedfrom
                                                                             fromthe
                                                                                  the24-bit
                                                                                      24-bitRGB
                                                                                             RGBrepresentation
                                                                                                   representationvalues
                                                                                                                  values(8-bits
                                                                                                                          (8-bitseach
                                                                                                                                  each
                                        forred
                                       for  red(R),
                                                (R),green
                                                     green(G),
                                                           (G),and
                                                                andblue
                                                                    blue(B)
                                                                          (B)measured
                                                                               measuredbybythe
                                                                                             thescanner’s
                                                                                                  scanner’ssoftware
                                                                                                            softwareand
                                                                                                                      andusing
                                                                                                                            usingthethe
                                        followingequation:
                                       following   equation:

                                                               LuminosityLuminosity
                                                                            = 255 −= (0.3
                                                                                      255 −×(0.3×R + 0.6×G
                                                                                             R + 0.6  ×G+  + 0.1×B)
                                                                                                             0.1 × B)                     (1)
                                                                                                                                        (1)
                                               The normal value for luminosity (0.3×R + 0.6×G + 0.1×B) was subtracted from 255 (28)
                                             The
                                        so that     normal
                                                   darker   value(higher
                                                           values  for luminosity
                                                                          deliveries of ×
                                                                                   (0.3    R + 0.6 × G
                                                                                        mainstream       + 0.1 ×
                                                                                                       smoke)     B) was
                                                                                                                would    subtracted
                                                                                                                      correspond
                                               8 ) so that darker values (higher deliveries of mainstream smoke) would correspond
                                                                                                                                  to from
                                                                                                                                     larger
                                       255  (2
                                        values. Thus, for the white cellulose acetate filters the luminosity was near zero for un-
                                       to larger values. Thus, for the white cellulose acetate filters the luminosity was near zero
                                        smoked butts. As more tar collects in the filter, the staining pattern darkens. The luminos-
                                       for unsmoked butts. As more tar collects in the filter, the staining pattern darkens. The
                                        ity-derived value could increase from zero to a maximum value of 255 (corresponding to
                                       luminosity-derived value could increase from zero to a maximum value of 255 (correspond-
                                        a ~3 mg nicotine/cigarette upper limit of measurable delivery). The relationship between
                                       ing to a ~3 mg nicotine/cigarette upper limit of measurable delivery). The relationship
                                        measured filter-butt luminosity and the range of mainstream smoke nicotine deliveries
                                       between measured filter-butt luminosity and the range of mainstream smoke nicotine
                                        for the 20 filtered cigarette brands included can be approximated using a linear regression
                                       deliveries for the 20 filtered cigarette brands included can be approximated using a linear
                                        model.
                                       regression model.

                                       3.3.Results
                                            Results
                                                Correlationcurves
                                              Correlation   curveswere
                                                                    wereobtained
                                                                          obtainedfor
                                                                                    forthe
                                                                                         the20
                                                                                             20cigarette
                                                                                                cigarettebrands
                                                                                                          brandsby bymeasuring
                                                                                                                       measuringthethemain-
                                                                                                                                       main-
                                       stream smoke deliveries for nicotine and the tobacco-specific nitrosamine, NNK under a a
                                         stream    smoke  deliveries for nicotine and   the  tobacco-specific  nitrosamine,    NNK   under
                                         rangeofofsmoking
                                       range         smokingconditions
                                                              conditions(see
                                                                          (seeExperimental
                                                                               ExperimentalSection
                                                                                               Sectionand
                                                                                                       andFigure
                                                                                                             Figure1).1).The
                                                                                                                          Thespent
                                                                                                                              spentcigarette
                                                                                                                                    cigarette
                                       filter butts used to generate the mainstream smoke samples were analyzed for thecorre-
                                         filter butts  used to generate  the mainstream     smoke  samples    were  analyzed   for the   cor-
                                         sponding scanner-based
                                       responding      scanner-based luminosity
                                                                      luminosity and     solanesol content.
                                                                                   and solanesol    content. Because
                                                                                                              Because scanning
                                                                                                                          scanningthe
                                                                                                                                    thefilter
                                                                                                                                         filter
                                         butts   for capturing luminosity   values is nondestructive,    the same  butts   were
                                       butts for capturing luminosity values is nondestructive, the same butts were used for theused  for  the
                                       solanesol measurements. Correlation curves linking the filter measurements to correspond-
                                       ing mainstream smoke deliveries were obtained using the same procedure as our previous
                                       solanesol analyses [21]. In all cases, we used a simple linear regression to evaluate linearity
Int. J. Environ. Res. Public Health 2021, 181, 546                                                                                            5 of 10

                                        solanesol measurements. Correlation curves linking the filter measurements to corre-
  Int. J. Environ. Res. Public Health 2021, 18, 10546                                                                            5 of 10
                                        sponding mainstream smoke deliveries were obtained using the same procedure as our
                                        previous solanesol analyses [21]. In all cases, we used a simple linear regression to evalu-
                                        ate linearity based on a coefficient of determination (R2) and the regression model equa-
                                          based
                                        tion     on a cigarette
                                             for each coefficient of determination
                                                                brand (summarized(R  in2 )Table
                                                                                           and the
                                                                                                1). regression model equation for each
                                          cigarette brand (summarized in Table 1).
                                        Table 1. Comparison of luminosity and solanesol average correlation curve fits for nicotine and
                                        NNK  for1.20
                                         Table       brands of commercial
                                                   Comparison              cigarettes.
                                                                of luminosity and solanesol average correlation curve fits for nicotine and NNK
                                         for 20 brands of commercial cigarettes.
                                                                      Nicotine                                  NNK 1
                                                                     Luminosity
                                                                        Nicotine           Solanesol              NNK 1
                                                                                                              Luminosity             Solanesol
                                                     R2                 0.905
                                                                       Luminosity            0.893
                                                                                             Solanesol           0.831
                                                                                                                Luminosity             0.842
                                                                                                                                       Solanesol
                                                   Stdev
                                                       R2
                                                                        0.050
                                                                          0.905
                                                                                             0.079
                                                                                               0.893
                                                                                                                 0.169
                                                                                                                   0.831
                                                                                                                                       0.100
                                                                                                                                         0.842
                                                  RSDStdev
                                                       (%)               5.6
                                                                          0.050               8.9
                                                                                               0.079             20.4
                                                                                                                   0.169                11.8
                                                                                                                                         0.100
                                        1   NNK: RSD
                                                 4-(methylnitrosamino)-1-(3-pyridyl)-1-butanone.
                                                     (%)              5.6                 8.9                        20.4                  11.8
                                            1   NNK: 4-(methylnitrosamino)-1-(3-pyridyl)-1-butanone.
                                               The resulting correlation curves linking the mainstream smoke deliveries and lumi-
                                        nosity Thevalues    were determined
                                                       resulting                  using linear
                                                                     correlation curves   linkingregressions     over all
                                                                                                    the mainstream           the smoking
                                                                                                                         smoke    deliveriesprotocols
                                                                                                                                               and lumi-
                                        used.   An    example      correlation  plot  (Figure  3)  demonstrates      the
                                           nosity values were determined using linear regressions over all the smoking    relationship    between    the
                                                                                                                                               protocols
                                        measured
                                           used. Anmainstream           smoke nicotine
                                                        example correlation                 deliveries
                                                                                  plot (Figure            for a typical
                                                                                                  3) demonstrates      thecigarette    brand
                                                                                                                            relationship       using the
                                                                                                                                            between     a
                                        range    of smoking
                                           measured     mainstreamconditions
                                                                         smoke with  the corresponding
                                                                                 nicotine  deliveries for aluminosities      measured
                                                                                                              typical cigarette    brand from
                                                                                                                                           usingthe   re-
                                                                                                                                                  a range
                                        spective    cigarette
                                           of smoking            filter butts.
                                                           conditions    with The   correlation plots
                                                                               the corresponding         linked the measured from
                                                                                                      luminosities                  mainstream     nico-
                                                                                                                                          the respective
                                        tine  values    and    the   luminosities   measured     from   the  stain  patterns.    For  this
                                           cigarette filter butts. The correlation plots linked the measured mainstream nicotine values    example,     a
                                        good    linear   fit of  the  regression   line had   an  R 2 of 0.94. An average R2 value of 0.91 was
                                           and the luminosities measured from the stain patterns. For this example, a good linear fit of
                                        obtained     for nicotine
                                           the regression     line had   an R2 of plots
                                                                      correlation        from
                                                                                   0.94. An  average      2 value of
                                                                                                the 20Rcigarette    brands.
                                                                                                                      0.91 was The  linear regression
                                                                                                                                  obtained   for nicotine
                                        fits  for luminosity
                                           correlation     plots fromcorrelation   curves were
                                                                          the 20 cigarette   brands.comparable
                                                                                                        The lineartoregression
                                                                                                                         those achieved       with the
                                                                                                                                    fits for luminosity
                                        LC/MS/MS
                                           correlationsolanesol
                                                           curves weremethod   (Table 1). to
                                                                            comparable     Cigarette    design differences
                                                                                              those achieved                    such as filtersolanesol
                                                                                                                  with the LC/MS/MS             length,
                                        paper
                                           methodporosity,
                                                      (Tableand 1). tobacco  mass
                                                                     Cigarette      necessitated
                                                                                design             the such
                                                                                         differences    generation    oflength,
                                                                                                              as filter  brand-specific     correlation
                                                                                                                                  paper porosity,     and
                                        curves
                                           tobaccoas is the necessitated
                                                      mass   case for the solanesol     method.
                                                                             the generation    of brand-specific correlation curves as is the case
                                           for the solanesol method.

                                          Figure 3. Correlation curve relating the measured mainstream smoke deliveries from a low-delivery
                                        Figure 3. Correlation curve relating the measured mainstream smoke deliveries from a low-delivery
                                          cigarette brand and corresponding luminosity levels from the filter butts: Inserts A, B, and C
                                        cigarette brand and corresponding luminosity levels from the filter butts: Inserts A, B, and C repre-
                                          represent staining patterns from filters obtained using two ISO puffs, two CI puffs, and full CI
                                        sent staining patterns from filters obtained using two ISO puffs, two CI puffs, and full CI smoking
                                          smoking conditions,
                                        conditions,             respectively.
                                                    respectively.

                                                 The corresponding slopes and y-intercepts were used to determine the estimated
                                            ISO nicotine deliveries from butts using the standard linear-regression equations for both
                                            the solanesol and luminosity approaches. A Bland–Altman plot [38] was then generated
Int. J. Environ. Res. Public Health 2021, 181, 546                                                                                                6 of 10

                                               The corresponding slopes and y-intercepts were used to determine the estimated ISO
                                        nicotine
   Int. J. Environ. Res. Public Health 2021,        deliveries from butts using the standard linear-regression equations for both the
                                             18, 10546                                                                                                 6 of 10
                                        solanesol and luminosity approaches. A Bland–Altman plot [38] was then generated to
                                        compare the estimated ISO nicotine deliveries for the 20 cigarettes brands using each
                                        brand’s specific correlation curve (Figure 4). The mainstream ISO machine-smoked nico-
                                        tinetodeliveries
                                                compare the       estimated
                                                             showed     goodISO      nicotinebetween
                                                                                agreement       deliveriesthefortwo
                                                                                                                  themethods.
                                                                                                                       20 cigarettes
                                                                                                                                   Thebrands    using each
                                                                                                                                         Bland–Altman
                                            brand’s    specific   correlation  curve   (Figure   4). The mainstream       ISO
                                        plots also indicated that the scanner method had a +7% bias relative to the solanesol  machine-smoked       nicotine
                                            deliveries     showed     good  agreement       between    the  two   methods.
                                        method; the bias was mostly observed in the lower nicotine-delivery range. We analyzed The   Bland–Altman      plots
                                        the data using a multivariate analysis to see which, if any, physical properties of the ciga-the
                                            also   indicated    that the scanner    method     had  a +7%   bias  relative  to the solanesol   method;
                                            bias(tobacco
                                        rettes     was mostly      observed
                                                             weight,          in the
                                                                       cigarette      lowerfilter
                                                                                   length,    nicotine-delivery
                                                                                                   length, diameter,range.andWefilter
                                                                                                                                 analyzed    the datacon-
                                                                                                                                      ventilation)    using
                                            a multivariate
                                        tributed     to the bias.analysis
                                                                     A weakto see
                                                                                butwhich,    if any, physical
                                                                                     non-statistically           properties
                                                                                                          significant          of the
                                                                                                                         relation   (p cigarettes
                                                                                                                                        > 0.05) was(tobacco
                                                                                                                                                      ob-
                                            weight,    cigarette    length,  filter length,   diameter,    and   filter ventilation)
                                        served between the bias and filter length. This could be related to the lower delivery cig-     contributed   to the
                                        arettes with higher filter ventilation that have very low yields under the ISO smokingthe
                                            bias.   A  weak   but   non-statistically    significant  relation   (p  > 0.05)  was  observed    between
                                            bias at
                                        regime     andlowfilter
                                                            puff length.  ThisWe
                                                                   numbers.      could   be related
                                                                                    attribute         to the
                                                                                                this bias  to lower
                                                                                                              the much delivery
                                                                                                                            highercigarettes
                                                                                                                                     dynamicwithrangehigher
                                                                                                                                                        of
                                            filter  ventilation     that have    very   low   yields  under    the   ISO  smoking
                                        the MS relative to the inexpensive flatbed scanner. The LC/MS/MS solanesol method has         regime   at low   puff
                                        a much wider dynamic range (~106) compared to the 8-bit luminosity-based approach to
                                            numbers.       We   attribute  this  bias  to the  much    higher    dynamic     range   of the MS   relative
                                        (~10the
                                              2). inexpensive flatbed scanner. The LC/MS/MS solanesol method has a much wider
                                            dynamic range (~106 ) compared to the 8-bit luminosity-based approach (~102 ).

      Figure 4. Bland-Altman
         Figure  4. Bland-Altman    plots   showing
                                         plots showingagreement
                                                        agreementbetween
                                                                   betweenthe
                                                                            thestandard
                                                                                 standardsolanesol
                                                                                          solanesolanalytical
                                                                                                     analyticalmethodology
                                                                                                                methodologyandand the
                                                                                                                                   the scan-
                                                                                                                                       scanner-
      ner-based  luminosity      approach     for predicting ISO nicotine deliveries for 20 cigarette brands.  Δ = Difference in estimated
         based luminosity approach for predicting ISO nicotine deliveries for 20 cigarette brands. ∆ = Difference in estimated nicotine
      nicotine
         (X
               (Xsolanesol
                     –X
                           – Xscanner
                                 ).
                                      ).
             solanesol    scanner

                                              A potential   limitation
                                                  A potential             waswas
                                                                 limitation     previously
                                                                                    previouslypublished
                                                                                                  publishedquestioning
                                                                                                              questioning whether
                                                                                                                              whether thethe
                                                                                                                                          color  stain
                                                                                                                                             color  stain
                                        patterns   of discarded     cigarettes   could   change   or  fade over  time   [39]. We
                                           patterns of discarded cigarettes could change or fade over time [39]. We investigated   investigated   this
                                        issue
                                           thisfor our for
                                                 issue  current    approach
                                                            our current        using a using
                                                                            approach      time-dependent     stabilitystability
                                                                                                a time-dependent        analysis.analysis.
                                                                                                                                    A series A
                                                                                                                                             ofseries
                                                                                                                                                com- of
                                        mercial   cigarette
                                           commercial        butts were
                                                           cigarette        machine
                                                                        butts           smoked,smoked,
                                                                              were machine         collected  in bulk,in
                                                                                                            collected    and   stored
                                                                                                                           bulk,   andatstored
                                                                                                                                          roomat tem-
                                                                                                                                                   room
                                        perature   and a −20
                                           temperature      and°C  a−  20 ◦ C in
                                                                     freezer      a resealable
                                                                               freezer           storage bag.
                                                                                         in a resealable        Thebag.
                                                                                                           storage    buttsThewere   analyzed
                                                                                                                                 butts          using
                                                                                                                                        were analyzed
                                        theusing
                                             scanner-based      method over
                                                    the scanner-based       methodthe course
                                                                                        over theof course
                                                                                                    four weeks.
                                                                                                            of four Using   the Student’s
                                                                                                                       weeks.    Using thet-test    to
                                                                                                                                              Student’s
                                        compare    measurements         over time,   we   observed    no significant   statistical  change
                                           t-test to compare measurements over time, we observed no significant statistical change in       in meas-
                                        ured  luminosity
                                           measured          over time
                                                        luminosity        or storage
                                                                        over time or conditions.
                                                                                       storage conditions.
                                              TheThe
                                                   scanner
                                                       scannerapproach
                                                                  approach was   successfully
                                                                               was   successfullypiloted   andand
                                                                                                     piloted    compared
                                                                                                                    compared  with
                                                                                                                                 withother measures
                                                                                                                                        other measures
                                        in an
                                           in ananalysis
                                                   analysisof of
                                                               reduced-nicotine-content
                                                                   reduced-nicotine-content     cigarettes  to help
                                                                                                    cigarettes  to helpestimate
                                                                                                                          estimate thethe
                                                                                                                                        potential  forfor
                                                                                                                                           potential
                                           compensatory
                                        compensatory          smoking
                                                          smoking         among
                                                                       among       intermittent
                                                                                intermittent       smokers
                                                                                               smokers       when
                                                                                                          when       using
                                                                                                                 using       these
                                                                                                                         these      cigarettes
                                                                                                                                cigarettes     [40].
                                                                                                                                            [40]. TheThe
                                           data
                                        data      presented
                                              presented    here here  indicate
                                                                   indicate  thatthat
                                                                                    thethe  scanner
                                                                                         scanner       approach
                                                                                                   approach        is applicable
                                                                                                               is applicable    to atowide
                                                                                                                                       a wide  range
                                                                                                                                            range   of of
                                           commercial cigarettes covering a range of nicotine deliveries, cigarette filler amounts, and
                                           filter lengths. To demonstrate the utility with other mainstream smoke constituents, we
                                           also measured the corresponding luminosity and LC/MS/MS solanesol correlations to the
                                           mainstream smoke deliveries of NNK (Table 1). The R2 values for NNK were not as precise
Int. J. Environ. Res. Public Health 2021, 18, 10546                                                                             7 of 10

                                        as those for nicotine, likely because the concentration of NNK relative to nicotine is about
                                        1000-fold lower.
                                              In general, we found good agreement in linearity of the correlation curves across the
                                        20 brands examined for the estimated nicotine and NNK mouth-level intake between the
                                        new luminosity measurement and our established solanesol methodology.
                                              The scanner luminosity method and the MS/LS/LS solanesol method each has ad-
                                        vantages and disadvantages. As noted above, the solanesol approach has a much higher
                                        dynamic range. On the other hand, the initial infrastructure costs for the luminosity mea-
                                        surements are much lower compared to the solanesol method. For the luminosity method,
                                        the main requirements are a scanner, reference target, desktop computer, and software to
                                        analyze the stain patterns (2021 equipment cost estimate is ~USD 3000). The solanesol
                                        method uses an LC/MS/MS instrument and automated sample preparation station with
                                        an estimated equipment cost of ~USD 400,000 (2021). Additionally, the solanesol method
                                        requires a highly skilled operator, so personnel costs would be higher than those needed
                                        for the simpler scanner method. However, some measurement costs are shared for both
                                        approaches. For example, as noted above, each correlation curve is brand specific, requiring
                                        18 smoke runs (6 conditions: three each ISO and three each intense, performed in triplicate).
                                        Generating these correlation curves can incur significant costs depending on the number
                                        of brands analyzed.
                                              A benefit of our filter-butt approaches luminosity, mass spectrometry [21,22] or UV
                                        absorbance [30] is the opportunity to probe nicotine delivery or other select constituent
                                        deliveries under natural conditions. This can be done on a per-cigarette basis or a daily-
                                        dose basis by summing results from all butts collected over a 24 h period. We have
                                        successfully used our solanesol-based approach to examine difference in deliveries and
                                        smoking behavior as a function of menthol [32], tobacco blends [29,31], and the use of
                                        reduced-nicotine-content cigarettes [34,35] for a variety of mainstream smoke constituents.
                                        However, the scanner-based method could produce comparable data while saving time
                                        and money.
                                              One potential application of the luminosity method is as a screening approach to
                                        examine relative changes in smoking patterns within specific brands. For example, this
                                        approach could be useful for determining if relative changes in smoking intensity are
                                        related to specific cravings, situations, locations, reactions to various stimuli, concurrent
                                        use of other nicotine products, or various cessation interventions. As noted by Jarvis
                                        et al. (2001) humans do consume cigarettes as predicted by standardized smoking machine
                                        measurements [6]. The correlation curves linking standard smoking machine yields to those
                                        achieved under naturalistic smoking conditions provides improved delivery estimates.
                                        However, the filter-butt analysis does not reflect the degree of inhalation. A commonly used
                                        means to examine changes in smoking is to look at the number of cigarettes smoked per day.
                                        The exposure “gold-standard”, biomarkers of exposure, may not decrease proportionally
                                        as the number of cigarettes smoked per day decreases [41]. A likely explanation is that
                                        smokers compensate for fewer cigarettes by smoking those cigarettes more intensely to
                                        achieve a desired nicotine dose.
                                              In many cases, the low-cost luminosity approach could be useful to probe behavior-
                                        related changes in smoking intensity or to test various hypotheses before incurring the
                                        expense of making appropriate biomarker measurements. Biomarker measurement has the
                                        advantage of capturing an internal measure of exposure that is not biased by subjective
                                        reporting or forgetting to save/return used cigarette filter butts for analysis. However,
                                        in cases where biomarker analysis is cost-prohibitive due to sample size or budgetary
                                        constraints, the filter analysis approach could provide much-needed information. Further-
                                        more, biomarker data also are time-averaged based on the half-life of the biomarker; thus,
                                        biomarker data lack the time-dependent resolution of the filter methods for understanding
                                        exposure on a per-cigarette basis. Analysis of filters is not time-dependent on last cigarette
                                        use. Additionally, filter analysis can provide both intake per cigarette and daily delivery
                                        information by summing across cigarette butts to determine total intake over a 24 h cycle.
Int. J. Environ. Res. Public Health 2021, 18, 10546                                                                                      8 of 10

                                        The filter-based approaches (e.g., via measuring luminosity, solanesol, UV absorbance,
                                        or other approaches) have value for probing natural, real-world smoking deliveries and
                                        behaviors. These include, but are not limited to, providing information on a smoker’s
                                        responses to various stimuli, examining effectiveness of treatment options, probing com-
                                        pensation behavior, studying changes in smoking patterns with modified cigarettes, and
                                        examining smokers’ reactions to regulatory changes in product design.

                                        4. Conclusions
                                             The digital-image, scanner-based approach for determining the luminosity of staining
                                        patterns in cigarette filter butts provides comparable data to our established solanesol
                                        method for estimating exposures to select mainstream smoke constituents. We found good
                                        agreement with comparable linear responses among the brand-specific constituent correla-
                                        tion curves between the luminosity and solanesol methods for filtered cigarettes. Biomarker
                                        measurements will always be the gold standard for exposure assessment. However, used
                                        cigarette-filter approaches such as the luminosity method presented here can generate
                                        supplemental information in terms of delivery per cigarette and provide an opportunity to
                                        probe changes in smoking behavior under various conditions.

                                        Author Contributions: Conceptualization, C.H.W.; Data curation, J.Y., S.S. and R.B.C.; Formal
                                        analysis, C.H.W., J.Y., S.S., L.V.-B., R.B.C. and B.C.B.; Funding acquisition, B.C.B.; Investigation,
                                        C.H.W. and L.V.-B.; Methodology, C.H.W., J.Y., S.S., L.V.-B. and B.C.B.; Project administration, L.V.-B.
                                        and B.C.B.; Resources, J.Y., L.V.-B. and B.C.B.; Software, C.H.W.; Supervision, B.C.B.; Writing–original
                                        draft, C.H.W., R.B.C. and B.C.B.; Writing–review & editing, S.S. and B.C.B. All authors have read and
                                        agreed to the published version of the manuscript.
                                        Funding: This report was supported in full by funding from the Centers for Disease Control and
                                        Prevention, U.S. Department of Health and Human Services.
                                        Institutional Review Board Statement: Not applicable.
                                        Informed Consent Statement: Not applicable.
                                        Acknowledgments: The first author is deeply indebted to the late Gregory Polzin for his personal
                                        friendship, scientific insights, enthusiasm, brain-storming sessions, and assistance in debugging
                                        programming code.
                                        Conflicts of Interest: The authors declare no conflict of interest.
                                        Disclaimer: The findings and conclusions in this report are those of the author(s) and do not
                                        necessarily represent the official position of the U.S. Centers for Disease Control and Prevention. Use
                                        of trade names is for identification only and does not imply endorsement by the U.S. Centers for
                                        Disease Control and Prevention, the U.S. Public Health Service, or the U.S. Department of Health
                                        and Human Services.

References
1.    Department of Health and Human Services, Centers for Disease Control and Prevention, National Center for Chronic Disease
      Prevention and Health Promotion, Office on Smoking and Health. Smoking Cessation: A Report of the Surgeon General. In The
      Chemical Components of Tobacco and Tobacco Smoke, 2nd ed.; Rodgman, A., Perfetti, T.A., Eds.; CRC Press: Boca Raton, FL, USA,
      2020; ISBN 9781466515482.
2.    Fisher, R. Cigarettes, Cancer, and Stastics; The Centennial Review of Arts & Science; Michigan State University Press: East Lansing,
      MI, USA, 1958; Volume 2, pp. 151–166. Available online: https://www.jstor.org/stable/23737529 (accessed on 25 June 2021).
3.    Mitacek, E.J.; Brunnemann, K.D.; Hoffmann, D.; Limsila, T.; Suttajit, M.; Martin, N.; Caplan, L.S. Volatile nitrosamines and
      tobacco-specific nitrosamines in the smoke of Thai cigarettes: A risk factor for lung cancer and a suspected risk factor for liver
      cancer in Thailand. Carcinogenesis 1999, 20, 133–137. [CrossRef] [PubMed]
4.    Proctor, R.N. The history of the discovery of the cigarette—lung cancer link: Evidentiary traditions, corporate denial, global toll.
      Tob. Control. 2012, 21, 87–91. [CrossRef] [PubMed]
5.    International Agency for Research on Cancer. List of Classifications by Cancer Sites with Sufficient or Limited Evidence in Humans; Iarc
      Monographs; World Health Organization: Lyon, France, 2020; Volume 1–128.
Int. J. Environ. Res. Public Health 2021, 18, 10546                                                                                     9 of 10

6.    Jarvis, M.J.; Boreham, R.; Primatesta, P.; Feyerabend, C.; Bryant, A. Nicotine Yield From Machine-Smoked Cigarettes and Nicotine
      Intakes in Smokers: Evidence From a Representative Population Survey. JNCI J. Natl. Cancer Inst. 2001, 93, 134–138. [CrossRef]
      [PubMed]
7.    Woodward, M.; Tunstall-Pedoe, H. Self-titration of nicotine: Evidence from the Scottish Heart Health Study. Addiction 1993, 88,
      821–830. [CrossRef] [PubMed]
8.    Gori, G.B.; Lynch, C.J. Analytical cigarette yields as predictors of smoke bioavailability. Regul. Toxicol. Pharmacol. 1985, 5, 314–326.
      [CrossRef]
9.    Parish, S.; Collins, R.; Peto, R.; Youngman, L.; Barton, J.; Jayne, K.; Clarke, R.; Appleby, P.; Lyon, V.; Cederholm-Williams, S.; et al.
      Cigarette smoking, tar yields, and non-fatal myocardial infarction: 14,000 cases and 32,000 controls in the United Kingdom. BMJ
      1995, 311, 471. [CrossRef] [PubMed]
10.   Kozlowski, L.T.; O’Connor, R.J. Cigarette filter ventilation is a defective design because of misleading taste, bigger puffs, and
      blocked vents. Tob. Control. 2002, 11, i40–i50. [CrossRef]
11.   Sweeney, C.T.; Kozlowski, L.T.; Parsa, P. Effect of Filter Vent Blocking on Carbon Monoxide Exposure From Selected Lower Tar
      Cigarette Brands. Pharmacol. Biochem. Behav. 1999, 63, 167–173. [CrossRef]
12.   Benowitz, N.L.; Jacob, P.; Yu, L.; Talcott, R.; Hall, S.; Jones, R.T. Reduced Tar, Nicotine, and Carbon Monoxide Exposure While
      Smoking Ultralow- but Not Low-Yield Cigarettes. JAMA 1986, 256, 241–246. [CrossRef]
13.   Petitti, D.B.; Friedman, G.D.; Kahn, W. Accuracy of information on smoking habits provided on self-administered research
      questionnaires. Am. J. Public Health 1981, 71, 308–311. [CrossRef]
14.   Strasser, A.A.; Ashare, R.L.; Kozlowski, L.T.; Pickworth, W.B. The effect of filter vent blocking and smoking topography on carbon
      monoxide levels in smokers. Pharmacol. Biochem. Behav. 2005, 82, 320–329. [CrossRef]
15.   Xia, B.; Blount, B.C.; Guillot, T.; Brosius, C.; Li, Y.; Van Bemmel, D.M.; Kimmel, H.L.; Chang, C.M.; Borek, N.; Edwards, K.C.;
      et al. Tobacco-Specific Nitrosamines (NNAL, NNN, NAT, and NAB) Exposures in the US Population Assessment of Tobacco and
      Health (PATH) Study Wave 1 (2013–2014). Nicotine Tob. Res. 2021, 23, 573–583. [CrossRef]
16.   StHelen, G.; Novalen, M.; Heitjan, D.F.; Dempsey, D.; Jacob, I.I.I.P.; Aziziyeh, A.; Wing, V.C.; George, T.P.; Tyndale, R.F.; Benowitz,
      N.L. Reproducibility of the Nicotine Metabolite Ratio in Cigarette Smokers. Cancer Epidemiol. Prev. Biomark. 2012, 21, 1105–1114.
      [CrossRef]
17.   Marian, C.; O’Connor, R.J.; Djordjevic, M.V.; Rees, V.W.; Hatsukami, D.K.; Shields, P.G. Reconciling Human Smoking Behavior
      and Machine Smoking Patterns: Implications for Understanding Smoking Behavior and the Impact on Laboratory Studies. Cancer
      Epidemiol. Prev. Biomark. 2009, 18, 3305–3320. [CrossRef] [PubMed]
18.   Caraballo, R.S.; Giovino, G.A.; Pechacek, T.F.; Mowery, P.D. Factors Associated with Discrepancies between Self-Reports on
      Cigarette Smoking and Measured Serum Cotinine Levels among Persons Aged 17 Years or Older: Third National Health and
      Nutrition Examination Survey, 1988–1994. Am. J. Epidemiol. 2001, 153, 807–814. [CrossRef] [PubMed]
19.   Kischkel, S.; Miekisch, W.; Sawacki, A.; Straker, E.M.; Trefz, P.; Amann, A.; Schubert, J.K. Breath biomarkers for lung cancer
      detection and assessment of smoking related effects—Confounding variables, influence of normalization and statistical algorithms.
      Clin. Chim. Acta 2010, 411, 1637–1644. [CrossRef] [PubMed]
20.   Watson, C.H.; McCraw, J.; Polzin, G.M.; Ashley, D.L. Development of a Method to Assess Cigarette Smoke Intake. Env. Sci. Tech.
      2004, 38, 248–253. [CrossRef]
21.   Polzin, G.M.; Wu, W.; Yan, X.; McCraw, J.M.; Abdul-Salaam, S.; Tavakoli, A.D.; Zhang, L.; Ashley, D.L.; Watson, C.H. Estimating
      smokers’ mouth level exposure to select mainstream smoke constituents from discarded cigarette filter butts. Nicotine Tob. Res.
      2009, 11, 868–874. [CrossRef]
22.   Bravo-Cardenas, R.; Ngac, P.; Watson, C.H.; Valentin-Blasini, L. Determination of Free Solanesol Levels in Cigarette Filters by
      Liquid Chromatography—Mass Spectrometry. J. Anal. Toxicol. 2021. [CrossRef]
23.   O’Connor, R.J.; Stitt, J.P.; Kozlowski, L.T. A Digital Image Analysis System for Identifying Filter Vent Blocking on Ultralight
      Cigarettes. Canr. Epidemiol. Biomark. Prev. 2005, 14, 533–537. [CrossRef]
24.   Shepperd, C.J.; St Charles, F.K.; Lien, M.; Dixon, M. Validation of methods for determining consumer smoked cigarette yields
      from cigarette filter analysis. Beitr. Tabforsch. Int. 2006, 22, 176–184. [CrossRef]
25.   St Charles, F.K.; Krautter, G.R.; Dixon, M.; Mariner, D.C. A comparison of nicotine dose estimates in smokers between filter
      analysis, salivary cotinine, and urinary excretion of nicotine metabolites. Psychopharmacology 2006, 189, 345–354. [CrossRef]
      [PubMed]
26.   Strasser, A.A.; O’Connor, R.J.; Mooney, M.E.; Wileyto, E.P. Digital Image Analysis of Cigarette Filter Stains as an Indicator of
      Compensatory Smoking. Cancer Epidemiol. Prev. Biomark. 2006, 15, 2565–2569. [CrossRef] [PubMed]
27.   O’Connor, R.J.; Vance, T.T.; Cummings, K.M.; Kozlowski, L.T.; Hammond, D.; Stitt, J.P. (2—7_ Digital Image Analysis of Cigarette
      Filter Staining to Estimate Smoke Exposure. Nicotine Tob. Res. 2007, 9, 865–871. [CrossRef] [PubMed]
28.   Pauly, J.L.; O’Connor, R.J.; Paszkiewicz, G.M.; Cummings, K.M.; Djordjevic, M.V.; Shields, P.G. Cigarette Filter–based Assays as
      Proxies for Toxicant Exposure and Smoking Behavior—A Literature Review. Cancer Epidemiol. Biomark. Prev 2009, 18, 3321–3333.
      [CrossRef] [PubMed]
29.   Ding, Y.S.; Chou, T.; Abdul-Salaam, S.; Hearn, B.; Watson, C.H. Development of a Method to Estimate Mouth-Level
      Benzo[a]pyrene Intake by Filter Analysis. Cancer Epidemiol. Prev. Biomark. 2012, 21, 39–44. [CrossRef] [PubMed]
Int. J. Environ. Res. Public Health 2021, 18, 10546                                                                                10 of 10

30.   Yan, X.; Zhang, Z.; Hearn, B.A.; Valentin-Blasini, L.; Polzin, G.M.; Watson, C.H. A High Throughput Method for Estimating
      Mouth-Level Intake of Mainstream Cigarette Smoke Nicotine. Tob. Res. 2015, 17, 1324–1330. [CrossRef]
31.   Ashley, D.L.; O’Connor, R.J.; Bernert, J.T.; Watson, C.H.; Polzin, G.M.; Jain, R.B.; Hammond, D.; Hatsukami, D.K.; Giovino, G.A.;
      Cummings, K.M.; et al. Effect of differing levels of tobacco-specific nitrosamines in cigarette smoke on the levels of biomarkers in
      smokers. Cancer Epidemiol. Prev. Biomark. 2010, 19, 1389–1398. [CrossRef]
32.   Watson, C.V.; Richter, P.; de Castro, R.; Sosnoff, C.; Potts, J.; Clark, P.; McCraw, J.; Yan, X.; Chambers, D.; Watson, C.H. Smoking
      Behavior and Exposure: Results of a Menthol Cigarette Cross-over Study. Am. J. Health Behav. 2017, 41, 309–319. [CrossRef]
33.   Watson, C.V.; Patricia, P.; Li, Y.; Phillips, T.; Pickworth, W.B.; de Castro, R.B.; Potts, J.; Watson, C.H. Mouth Level Nicotine in a
      Clinical Setting versus Non-clinical Setting. Tob. Reg. Sci. 2019, 5, 229–241. [CrossRef]
34.   Smith, T.T.; Koopmeiners, J.S.; Hatsukami, D.K.; Tessier, K.N.; Benowitz, N.L.; Murphy, S.E.; Strasser, A.A.; Tidey, J.W.; Blount,
      B.C.; Valentin, L.; et al. Mouth-Level Nicotine Intake Estimates from Discarded Filter Butts to Examine Compensatory Smoking
      in Low Nicotine Cigarettes. Cancer Epidemiol. Prev. Biomark. 2020, 29, 643–649. [CrossRef]
35.   Smith, T.T.; Koopmeiners, J.S.; White, C.M.; Denlinger-Apte, R.L.; Pacek, L.R.; De Jesús, V.R.; Wang, L.; Watson, C.H.; Blount, B.C.;
      Hatsukami, D.K.; et al. The Impact of Exclusive Use of Very Low Nicotine Cigarettes on Compensatory Smoking: An Inpatient
      Crossover Clinical Trial. Cancer Epidemiol. Prev. Biomark. 2020, 29, 880–886. [CrossRef]
36.   Calafat, A.M.; Polzin, G.; Saylor, J.; Richter, P.; Ashley, D.L.; Watson, C.H. Determination of tar, nicotine, and carbon monoxide
      yields in the mainstream smoke of selected international cigarettes. Tob. Control. 2004, 13, 45–51. [CrossRef]
37.   Wu, W.; Zhang, L.; Ashley, D.L.; Watson, C.H. Determination of Tobacco-specific nitrosamines in mainstream smoke from U.S.
      brand and non-U.S. brand cigarettes. Nicotine Tob. Res. 2005, 7, 443–451. [CrossRef] [PubMed]
38.   Mansournia, M.A.; Waters, R.; Nazemipour, M.; Bland, M.; Altman, D.G. Bland-Altman methods for comparing methods of
      measurement and response to criticisms. Glob. Epidemiol. 2020, 3, 100045. [CrossRef]
39.   Morton, M.J.; Williams, D.L.; Hjorth, H.B.; Smith, J.M. Machine-smoking studies of cigarette filter color to estimate tar yield by
      visual assessment and through the use of a colorimeter. Regul. Toxicol. Pharmacol. 2009, 56, 321–331. [CrossRef] [PubMed]
40.   Shiffman, S.; Mao, J.M.; Kurland, B.F.; School, S.M. Do non-daily smokers compensate for reduced cigarette consumption when
      smoking very-low-nicotine-content cigarettes? Psychopharmacology 2018, 235, 3435–3441. [CrossRef]
41.   Jain, R. Trends in serum cotinine concentrations among daily cigarette smokers: Data from NHANES 1999–2010. Sci. Total Environ.
      2014, 472, 72–77. [CrossRef]
You can also read