An EPAC1/PDE1C-Signaling Axis Regulates Formation of Leading-Edge Protrusion in Polarized Human Arterial Vascular Smooth Muscle Cells - MDPI
←
→
Page content transcription
If your browser does not render page correctly, please read the page content below
cells
Article
An EPAC1/PDE1C-Signaling Axis Regulates
Formation of Leading-Edge Protrusion in Polarized
Human Arterial Vascular Smooth Muscle Cells
Paulina Brzezinska and Donald H. Maurice *
 Department of Biomedical and Molecular Sciences, Queen’s University, Kingston, ON K7L 3N6, Canada;
 paulina.brzezinska@queensu.ca
 * Correspondence: mauriced@queensu.ca; Tel.: +1-613-533-6000 (ext. 75089)

 Received: 25 October 2019; Accepted: 18 November 2019; Published: 20 November 2019

 Abstract: Pharmacological activation of protein kinase A (PKA) reduces migration of arterial smooth
 muscle cells (ASMCs), including those isolated from human arteries (HASMCs). However, when
 individual migration-associated cellular events, including the polarization of cells in the direction
 of movement or rearrangements of the actin cytoskeleton, are studied in isolation, these individual
 events can be either promoted or inhibited in response to PKA activation. While pharmacological
 inhibition or deficiency of exchange protein activated by cAMP-1 (EPAC1) reduces the overall
 migration of ASMCs, the impact of EPAC1 inhibition or deficiency, or of its activation, on individual
 migration-related events has not been investigated. Herein, we report that EPAC1 facilitates the
 formation of leading-edge protrusions (LEPs) in HASMCs, a critical early event in the cell polarization
 that underpins their migration. Thus, RNAi-mediated silencing, or the selective pharmacological
 inhibition, of EPAC1 decreased the formation of LEPs by these cells. Furthermore, we show that the
 ability of EPAC1 to promote LEP formation by migrating HASMCs is regulated by a phosphodiesterase
 1C (PDE1C)-regulated “pool” of intracellular HASMC cAMP but not by those regulated by the more
 abundant PDE3 or PDE4 activities. Overall, our data are consistent with a role for EPAC1 in regulating
 the formation of LEPs by polarized HASMCs and show that PDE1C-mediated cAMP hydrolysis
 controls this localized event.

 Keywords: exchange protein activated by cAMP; EPAC1; cyclic nucleotide phosphodiesterase; PDE1C;
 human arterial smooth muscle cells; HASMCs; migration; leading edge protrusion; cAMP; chemotaxis

1. Introduction
     Agents that increase cyclic AMP (cAMP) signaling largely inhibit migration of arterial smooth
muscle cells (ASMCs), including those ASMCs isolated from human arteries (HASMCs). For instance,
studies have shown that the pan-cellular increases in cAMP caused by agents that activate all
transmembrane adenylyl cyclases, including agents such as forskolin, or which inhibit all cellular
cAMP-hydrolyzing phosphodiesterases (PDEs), like isobutyl-methyl-xanthine (IBMX), consistently
reduce ASMC migration [1]. For these reasons, cAMP-elevating agents have long been seen as
attractive agents through which to reduce ASMC migration in several conditions, including in-stent
restenosis, where PDE4 inhibition reduces neointima formation and inhibits vascular cell adhesion
molecule 1 (VCAM-1) expression and histone methylation in an exchange protein activated by cAMP
(EPAC)-dependent manner [2,3]
     Interestingly, notwithstanding the observation that increased cAMP signaling results in reduced
levels of ASMC migration, when the numerous steps involved in coordinating cellular migration are
studied individually, it is found that they are equally likely to be inhibited or promoted [1,4–6]. For

Cells 2019, 8, 1473; doi:10.3390/cells8121473                                   www.mdpi.com/journal/cells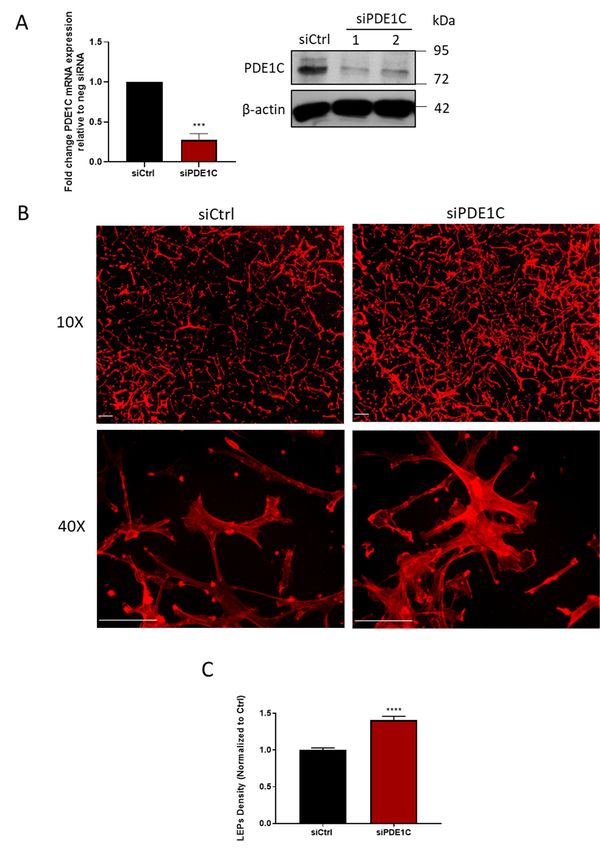
Cells 2019, 8, 1473                                                                                  2 of 12

instance, while increased protein kinase A (PKA) activity reduces overall cellular migration, PKA
activation promotes, rather than inhibits, the formation of cellular protrusions at the cellular front, a
critical early step in polarizing cells for migration [5–9]. Although these dichotomous effects have not
been studied systematically, it is likely that they arise due to the complexities involved in coordinating
the recognized spatial and temporal selectivity of cellular cAMP signaling. Indeed, spatial and temporal
compartmentation of cAMP signaling is made possible by the subcellular localization of the enzymes
that synthesize cAMP (adenylyl cyclases), the enzymes that hydrolyze and inactivate cAMP (cyclic
nucleotide phosphodiesterases; PDEs), and the dominant cAMP effectors (PKA and EPAC) [3,4,10–13].
Other factors that likely contribute to the dichotomous effects of cAMP on cell migration involve the
interdependence of the individual steps (i.e., cell adhesion, protrusion, and retraction) required for
cells to move efficiently [4,13,14]. Indeed, cell migration is an oscillatory process that requires a series
of coordinated steps, in which extension or cell protrusion of the leading-edge initiates and maintains
directional migration. Recently, multiple extracellular factors have also been shown to impact cell
migration efficiency including such factors as the topography and deformability of the extracellular
matrix and its composition [8,15]. Of relevance, and potentially directly linking cAMP signaling to
these extrinsic factors, both PKA and EPAC1 are known to accumulate at the leading edge of migrating
cells, including ASMCs, endothelial cells, and fibroblasts, and this compartmentation critically controls
leading edge dynamics in an extracellular matrix protein-dependent fashion [5,6,8,9].
      Since EPAC1 localizes at the front of migrating cells, and PKA activation within this domain is
known to promote the formation of their leading-edge protrusions (LEP), we sought to investigate
how EPAC1 impacted the formation of these dynamic structures. Overall, our findings are consistent
with the idea that EPAC1 plays a critical role in promoting LEP formation in these HASMCs. Thus,
RNAi-mediated silencing of EPAC1, or its pharmacological inhibition, decreased the formation of LEPs
in HASMCs. In addition, we found that this effect was coordinated by calcium bound calmodulin
(Ca2+ /CaM)-regulated PDE inhibitors and silencing of PDE1C, but not by targeting the more dominant
PDE3 or PDE4 activities.

2. Materials and Methods

2.1. Cell Culture and siRNA Transient Transfections
     Human arterial smooth muscle cells (HASMCs) were isolated from discarded unused portions
of the internal thoracic artery in coronary artery bypass graft surgeries as described previously [16],
from donor patients of Kingston General Hospital, as well as this, HASMCs were purchased from
Cell Applications. For tissues obtained from Kingston General Hospital (KGH), their use in this
research study (SURG-334-15; “Endothelial cell function in human hearts”) was approved by the
Queen’s University Health Sciences and Affiliated Teaching Hospitals Research Ethics Board (HSREB).
HASMCs were cultured in smooth muscle basal medium (SMBM) and smooth muscle growth medium
bullet kit (SMGM-2) (Lonza), supplemented with 10% fetal bovine serum (FBS), cultured at 37 ◦ C in 5%
CO2 , and used between passages 4–9. For siRNA transfection, HASMCs were cultured in basal SMBM
containing Lipofectamine 3000 (Invitrogen) and siRNA (Sigma) in a 1:1 ratio, and media was changed
5 h post transfection with SMGM-2. Experiments were conducted 48 h post transfection. The following
sequences of siRNAs were used, listed in Table 1. All siRNAs were purchased from Invitrogen.
Cells 2019, 8, 1473                                                                              3 of 12

                                         Table 1. siRNA sequences.

    Target            siRNA ID             Sense                         Antisense
                                           50 -UAUAGCAAAGAUCUCCAG        50 -CACCAGCUGUUA
    PDE1C # 1         PDE1CHSS107703
                                           CUCCGUC-30                    UUGAGGCAUUAAA-30
                                           50 -CACCAGCUGUUAUUGAGG 50 -UUUAAUGCCUCA
    PDE1C # 2         PDE1CHSS182019
                                           CAUUAAA-30             AUAACAGCUGGUG-30
                                           50 -CCUCAAGGAGCAGAAGAA        50 -AUUGAGAUUCUU
    EPAC1             RAPGEF3HSS115938
                                           UCUCAAU-30                    CUGCUCCUUGAGG-30

2.2. Chemotactic Leading Edge Protrusion (LEP) Assay
     HASMCs resuspended in SMBM basal media were plated on the upper surface of gelatin-coated
(ddH2 0 supplemented with 0.25% gelatin (Biorad)), 3-µm, 24 mm2 -diameter BD Falcon Corning®
FluoroBlokTM cell culture inserts forming a monolayer, as described previously [9,17]. Chemotaxis
was initiated by adding 0.5% FBS in SMBM media to the underside of the inserts to allow
cells to form leading edge protrusions (LEPs) for 4 h. Pharmacological activators or inhibitors
were added to the top of the insert prior to the addition of FBS to the underside of the inserts.
The following drugs were used: CE3F4 (ToCRIS), 8-CPT-20 -O-Me-cAMP (Biolog), Compound 33 ((C33)
a generous gift from Dr. Guy Breitenbucher; Dart Neurosciences), PF-04827736 (Sigma), Cilostamide
(Calbiochem), and Ro 20-1724 (Calbiochem). To visualize the extent of LEPs, inserts were fixed
with paraformaldehyde (4% (v/v)), rinsed with Hank’s Balanced Salt Solution (HBSS), and incubated
for 1 h with phalloidin-tetramethylrhodamine B isothiocyanate (1:1000; Sigma) and DAPI (1:1000;
Thermofisher) (0.3% bovine serum albumin (BSA) diluted in HBSS). Inserts were mounted on glass
slides and the extent of LEPs were measured by quantifying the total fluorescence of phalloidin-TRITC
on the bottom of the insert, as a measure of the total density of LEPs formed. In each case, 5 images
were taken per transwell and these covered all 4 quadrants as well as the center of the transwell.
In experiments in which we controlled for the number of cells applied to the top of the transwell, this
was measured by counting the number of nuclei on the top of the transwell in a similarly unbiased and
representative sampling of this structure. Images were captured with a Zeiss Axiovert S100 microscope
and imaged with Slidebook software. LEP quantification was conducted by processing the images
using Image Pro software, where the threshold tools were used to segment the LEPs followed by
counting the pixel density of the area occupied by the LEPs.

2.3. Immunoblotting
      HASMCs monolayers were lysed using triton-based lysis buffer in (mM): 1.0% Triton X-100,
100 sodium pyrophosphate, 10 sodium β-glycerophosphate, 5 benzamidine, 10 sodium orthovanadate,
50 Tris-HCl, 100 sodium chloride, 1 EDTA, 5 magnesium chloride, 0.5 calcium chloride, 10
phenylmethylsulfonyl fluoride (PMSF), and the following protease inhibitors in µg/mL: 1 pepstantin A,
1 E-64, 5 bestantin, 1 aprotinin, and 2 leupeptin. Lysates were homogenized (20 G needle), centrifuged
at 10,000 RPM, resolved by SDS-PAGE gels, transferred to PVDF membranes, and immunoblotted for
the proteins of interest. The following anti-sera were used: anti-PDE1C (1:500; Fabgenix), anti-EPAC1
(cell signaling), anti-β-actin (1:10,000; Sigma), and anti-β-tubulin (1:1000; Sigma).

2.4. RNA Isolation, Reverse Transcription, and qPCR
      HASMC RNA was isolated using the Qiagen RNeasy (Qiagen) mini kit as per the manufacturer’s
instructions, followed by measurement of RNA purity and concentration using a Nanodrop 1000
(Thermo Scientific). cDNA was synthesized using a Qiagen Omniscript RT, according to the
manufacturer’s instructions. qPCR reactions were performed using PowerUPTM SYBRTM Green
Master Mix (Thermo Fisher Scientific) with 2 ng cDNA template, and the following primers were used,
listed in Table 2. Thermocycler conditions were the following, using the QuantStudio 5 Real-Time PCR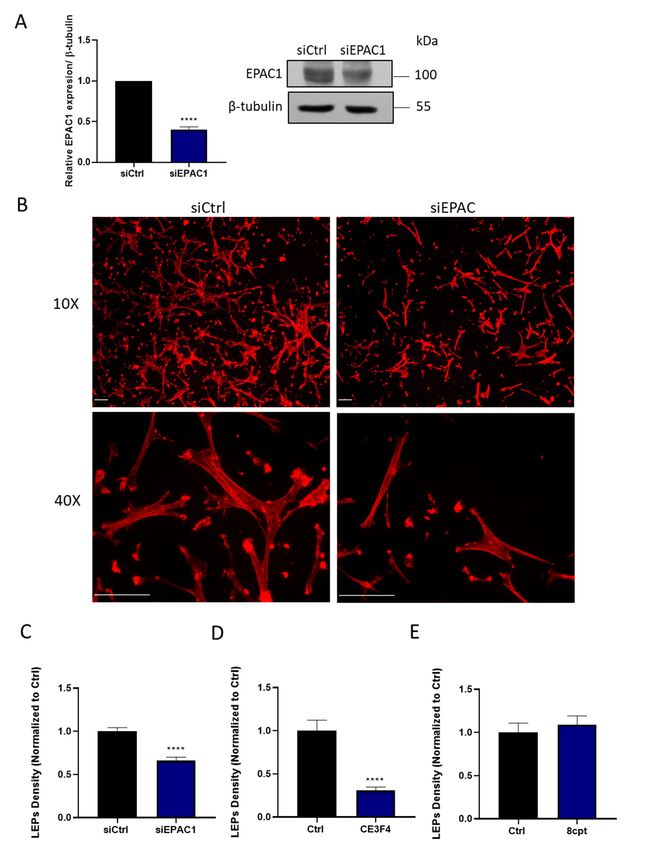
Cells 2019, 8, 1473                                                                                4 of 12

System: PCR stage: Step 1 95 ◦ C, 15 min; Step 2 60 ◦ C, 1 min repeated 40X. Melt curve stage: Step 1 95
◦ C, 15 min; Step 2 60 ◦ C, 1 min, and Step 3 Dissociation, 95 ◦ C, 1 s.

                                       Table 2. Primer Sequences.

                 Gene       Forward                        Reverse
                 TBP        TATAATCCCAAGCGGTTTGC           GCTGGAAAACCCAACTTCTG
                 PGK        CTGTGGGGGTATTTGAATGG           CTTCCAGGAGCTCCAAACTG
                 PDE1C      CAGCAAAAGCATGGGACCTC           TGAAGGTGGGTTCCACGATG

2.5. Statistical Analysis
     All data presented were analyzed using GraphPad Prism Software and used for statistical analysis.
Data in this study was collected from at least three independent experiments unless otherwise stated
and presented as means ± (SEM). Statistical analysis between two groups was compared using an
unpaired, two-tailed Student’s t-test and multiple comparisons were assessed using a 1- or 2-way
analysis of variance (ANOVA), followed by the appropriate post-hoc test as indicated in the figure
captions. A p value < 0.05 was considered significant.

3. Results

3.1. Pharmacological Inhibition, or RNAi-Mediated Silencing, of EPAC1 Reduces Formation of Leading-Edge
Protrusions (LEPs) in HASMCs
     Using a combination of approaches, we assessed the role of EPAC1, the sole EPAC expressed
in HASMCs [18], in coordinating the ability of these cells to generate polarized LEPs in response to
a chemotactic gradient. Thus, treating HASMCs with an EPAC1-silencing siRNA decreased EPAC1
expression (Figure 1A), and antagonized the ability of these cells to generate LEPs (Figure 1B,C).
Similarly, inhibiting EPAC1 pharmacologically with a selective EPAC1 inhibitor, CE3F4 (20 µM) [19,20],
also markedly reduced the ability of HASMCs to generate LEPs in response to an FBS gradient
(Figure 1D). In contrast, but consistent with the idea that EPAC1 is effectively activated in migrating
HASMCs, the addition of the EPAC1 activating cAMP analogue, 8-CPT-20 -O-Me-cAMP (100 µM) [19],
did not significantly alter the number of LEPs formed by these cells in our experiments (Figure 1E).

3.2. Selective Pharmacological Inhibition of HASMC PDEs Differentially Impacts Their Capacity to
Generate LEPs
     While previous studies have shown that pharmacological inhibition of the dominant HASMC
cAMP PDEs, namely PDE1, PDE3, or PDE4, like PKA activation, reduced their migratory capacity [1,21],
we hypothesized that selective pharmacological inhibition of PDE1, PDE3, or PDE4 might differentially
impact the ability of these cells to form LEPs. Interestingly, while selective inhibition of HASMC
PDE3 activity with cilostamide (5 µM) [1,22] reduced LEP formation in HASMCs, PDE4 inhibition
with Ro 20-1724 (10 µM) did not (Table 3). Unexpectedly, pharmacological inhibition of PDE1 activity
(C33, 1 µM) [23,24] in these cells markedly promoted the formation of LEPs in our experiments
(Table 3). Although HASMCs have been reported by us and others to express both PDE1A and
PDE1C gene-encoded enzymes, since PDE1C preferentially hydrolyzes cAMP compared to PDE1A,
we next investigated the possibility that PDE1 inhibitors acted by inhibiting cAMP hydrolysis by
PDE1C. Consistent with this hypothesis, silencing PDE1C (Figure 2A) increased the formation of LEPs
(Figure 2B,C) and obviating the LEP producing effects of the PDE1 inhibitor, C33 (Table 4).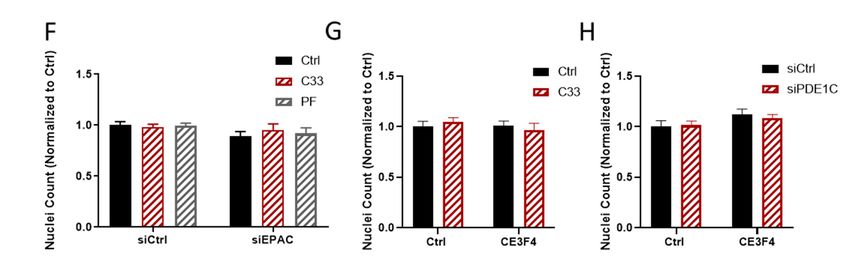
Cells 2019, 8, 1473                                                                                                                            5 of 12
               Cells 2019, 8, x FOR PEER REVIEW                                                                                   5 of 13

                  Figure silencing
      Figure 1. EPAC1      1. EPAC1 or  silencing   or inhibition
                                           inhibition     decreases   decreases    leading-edge
                                                                          leading-edge            protrusion
                                                                                            protrusion    (LEP)(LEP)   formationby
                                                                                                                   formation         byHASMCs.
                  HASMCs. (A) Detection of EPAC1 by immunoblotting of samples obtained from a representative
      (A) Detection of EPAC1 by immunoblotting of samples obtained from a representative experiment in
                  experiment in which HASMC were treated with siCtrl or siEPAC1 for 48 h is shown. Quantitating
      which HASMC levels were    treated
                          of EPAC1          with siCtrl
                                      in similar   samplesorobtained
                                                                   siEPAC1  fromforn 48
                                                                                     = 3hindependent
                                                                                           is shown. experiments
                                                                                                         Quantitating        levels
                                                                                                                        showed     thatof EPAC1
      in similar samples     obtained from
                  siEPAC1 transfection             n = 3 reduced
                                            significantly    independentEPAC1 experiments         showedtothat
                                                                                 levels when normalized              siEPAC1
                                                                                                               tubulin,            transfection
                                                                                                                          as assessed
                  using
      significantly      the Student’s
                     reduced      EPAC1  unpaired
                                              levels t-test,
                                                        when  **** pnormalized
                                                                     < 0.0001. (B) Representative
                                                                                     to tubulin, images,     obtainedusing
                                                                                                    as assessed          at either
                                                                                                                                 the10×Student’s
                  or 40× magnification, of actin-stained LEPs detected on the lower levels (bottom) of FluoroBlokTM
      unpaired t-test,  **** p < 0.0001. (B) Representative images, obtained at either 10× or 40× magnification,
                  transwells (3-μm pores) following a 4 h exposure of HASMCs to an FBS gradient.                   Prior to exposure
      of actin-stained   LEPs detected on the lower levels (bottom) of FluoroBlokTM transwells (3-µm pores)
                  of these cells to the FBS gradient, the cells had been transfected either with a control siRNA (siCtrl) or
      following aan4 h  exposure of HASMCs
                      EPAC1-targeting      siRNA (siEPAC) to anforFBS 48 h.gradient.    Prior
                                                                              Actin (red)  and to  exposure
                                                                                                nuclei            of these
                                                                                                        (blue) were           cellsby
                                                                                                                       visualized     to the FBS
      gradient, the   cells had
                  incubating  fixedbeen     transfected
                                     cells with                either with
                                                 TRITC-conjugated               a control
                                                                          phalloidin         siRNA
                                                                                      or DAPI,         (siCtrl)
                                                                                                respectively       or an
                                                                                                             (scaling      EPAC1-targeting
                                                                                                                        bars,  50 μm).
                  Note: Since
      siRNA (siEPAC)       for 348μmh.pores
                                          Actinprecluded
                                                   (red) migration
                                                             and nuclei   of HASMCs     to the lower
                                                                               (blue) were            level of by
                                                                                               visualized       these transwells, no
                                                                                                                    incubating        fixed cells
      with TRITC-conjugated phalloidin or DAPI, respectively (scaling bars, 50 µm). Note: Since 3 µm
      pores precluded migration of HASMCs to the lower level of these transwells, no DAPI (blue) staining
      is present in these images. (C) Quantification of the LEPs formed by siCtrl or siEPAC1 transfected
      HASMCs following their exposure to the FBS gradient are shown. Statistically significant reduction in
      LEPs formed by siEPAC1 HASMCs compared to siCtrl HASMC was determined by comparing results
      obtained in n = 3 independent experiments using the Student’s unpaired t-test, **** p < 0.0001). (D–E)
      Quantification of the impact of inhibiting EPAC1 with CE3F4 (20 µM) (D) or activating EPAC1 with
      8-CPT-20 -O-Me-cAMP (100µM) (E) on LEP formation in HASMCs in n = 3 independent experiments
      using the Student’s unpaired t-test, **** p < 0.0001.
Cells 2019, 8, 1473 6 of 12
Cells 2019, 8, x FOR PEER REVIEW 7 of 13
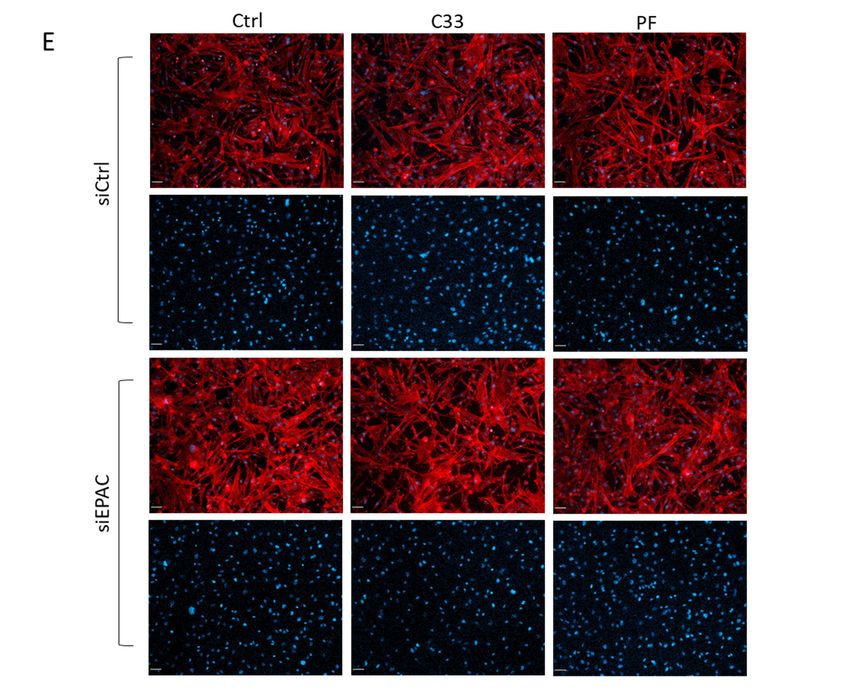
FigureFigure 2. PDE1C
2. PDE1C silencingpromotes
silencing promotes HASMC
HASMC LEPs formation.
LEPs (A) Detection
formation. of PDE1C of
(A) Detection protein
PDE1Cby protein
immunoblotting (immunoblots), or mRNA by qRT-PCR (histogram), of samples obtained from a
by immunoblotting (immunoblots), or mRNA by qRT-PCR (histogram), of samples obtained from
representative experiment (immunoblot) indicating the knockdown efficiency of PDE1C using 2
a representative experiment (immunoblot) indicating the knockdown efficiency of PDE1C using 2
different siRNAs (PDE1C siRNA #1 or PDE1C siRNA #2) or n = 3 independent experiments
different siRNAs (PDE1C
(histogram), in whichsiRNA
HASMC #1 had
or PDE1C siRNA #2)
been incubated with = 3 independent
or nsiCtrl or PDE1C siRNA experiments
#2 for 48(histogram),
h.
in which HASMC
Reductions in had
PDE1Cbeen incubated
protein with were
and mRNA siCtrlboth
or PDE1C siRNA
statistically #2 foras
significant, 48assessed
h. Reductions
using thein PDE1C
protein and mRNA
Student’s were
unpaired both
t-test, statistically
**** p < 0.0001. significant, as assessed
(B) Representative images, using theatStudent’s
obtained either 10× unpaired
or 40× t-test,
**** p < 0.0001. (B) Representative images, obtained at either 10× or 40× magnification, of actin-stained
magnification, of actin-stained LEPs detected on the lower levels (bottom) of FluoroBlok TM transwell
(3-μm pores) following a 4 h exposure of HASMCs to an FBS gradient. Prior to exposure of these cells
LEPs detected on the lower levels (bottom) of FluoroBlokTM transwell (3-µm pores) following a 4 h
to the FBS gradient, the cells had been transfected either with a control siRNA (siCtrl) or a PDE1C-
exposure of HASMCs to an FBS gradient. Prior to exposure of these cells to the FBS gradient, the cells
targeting siRNA (siPDE1C) for 48 h. Actin (red) and nuclei (blue) were visualized by incubating fixed
had been
cellstransfected either with
with TRITC-conjugated a control
phalloidin siRNA
or DAPI, (siCtrl) or(scaling
respectively a PDE1C-targeting siRNA
bars, 50 μm). Note: Since(siPDE1C)
3 μm for
48 h. Actin (red) and nuclei (blue) were visualized by incubating fixed cells with
pores precluded migration of HASMCs to the lower level of these transwells, no DAPI (blue) staining TRITC-conjugated
phalloidin or DAPI,
is present respectively
in these images. (C)(scaling bars, 50
Quantification ofµm). Note: Since
LEP formation 3 µmor
in siCtrl pores precluded
siPDE1C migration of
transfected
HASMCs to the lower level of these transwells, no DAPI (blue) staining is present in these images. (C)
Quantification of LEP formation in siCtrl or siPDE1C transfected HASMCs in response to exposure to
an FBS gradient for 4 h in n = 3 independent experiments, assessed using the Student’s unpaired t-test,
**** p < 0.0001.Cells 2019, 8, 1473 7 of 12
Table 3. LEP formation in HASMCs treated with PDE inhibitors.
Treatment Density of LEPs on Bottom of Transwells (% of Control)
DMSO 100 ± 5
C33 1 µM 178 ± 12 1
Ro 20-1724 10 µM 78 ± 14
Cilostamide 5 µM 46 ± 3 1
Values
Cells are
2019, 8, means of n =REVIEW
x FOR PEER 3 independent experiments ± SEM. 1 p < 0.0001 compared with vehicle-treated HASMC
8 of LEP
13
formation, as determined by a one-way analysis of variance (ANOVA) and Dunnett’s multiple comparisons test.
HASMCs in response to exposure to an FBS gradient for 4 h in n = 3 independent experiments,
3.3. assessed
Silencing using the
HASMC Student’s
EPAC1 unpaired
Obviates t-test, Inhibition-Directed
PDE1 **** p < 0.0001. LEP Formation
Since
3.3. inhibition
Silencing HASMC orEPAC1
silencing of the
Obviates PDE1 cAMP effector EPAC1
Inhibition-Directed reduced LEP formation and PDE1
LEP Formation
inhibition, or PDE1C silencing promoted the formation of these structures, we next investigated
Since inhibition or silencing of the cAMP effector EPAC1 reduced LEP formation and PDE1
whether EPAC1
inhibition, or promoted LEP formation
PDE1C silencing promotedthrough a PDE1C-sensitive
the formation mechanism.
of these structures, we nextTo investigate this
investigated
idea,whether
we determined whetherLEP
EPAC1 promoted silencing
formationEPAC1
throughwould antagonize PDE1
a PDE1C-sensitive inhibitor-mediated
mechanism. To investigateformation
this
of LEPs
idea, inwethese cells. Thus,
determined while
whether PDE1 inhibition
silencing EPAC1 would withantagonize
either C33PDE1 (1 µM) or with PF-04827736
inhibitor-mediated
(1 µM) [25] promoted
formation of LEPs inLEP formation
these in control
cells. Thus, HASMCs,
while PDE1 neither
inhibition of either
with these C33
PDE1 (1 inhibitors
μM) or with werePF-able to
04827736
rescue (1 μM) [25]inpromoted
LEP formation LEP formation
EPAC1-silenced in control
cells (Figure HASMCs,
3A,B) neither
or in cells in of theseEPAC1
which PDE1 inhibitors
was inhibited
were3C).
(Figure ableAlso,
to rescue LEPsilencing
while formationPDE1C
in EPAC1-silenced
promoted cellsLEP(Figure 3A, B)inorcontrol
formation in cells cells,
in which
thisEPAC1
basal effect
was inhibited (Figure 3C). Also, while silencing PDE1C promoted LEP formation
and the ability of EPAC1 inhibition to promote LEP formation were lost in PDE1C-silenced HASMCs in control cells, this
basal effect and the ability of EPAC1 inhibition to promote LEP formation were lost in PDE1C-
(Figure 3D). To obviate that our results reflected an effect related to a reduced adhesion of HASMCs to
silenced HASMCs (Figure 3D). To obviate that our results reflected an effect related to a reduced
the upper surface of the transwells upon PDE1 inhibition or EPAC1-silencing, or loss of cells during
adhesion of HASMCs to the upper surface of the transwells upon PDE1 inhibition or EPAC1-
the treatments
silencing, orperiods, we counted
loss of cells during the HASMC
treatments nuclei which
periods, wewere present
counted HASMCon the upper
nuclei surfaces
which were of the
transwells, in which we detected changes in LEP numbers. As shown in (Figure
present on the upper surfaces of the transwells, in which we detected changes in LEP numbers. As 3E–H), inhibition or
silencing
shownofineither
(FigurePDE1C
3E–H),orinhibition
EPAC1 did or not significantly
silencing of eitherimpact
PDE1Cthe ornumber
EPAC1 did of HASMCs on the upper
not significantly
surface
impactof the FluoroBlok
the number TM transwell
of HASMCs on thein our studies.
upper surface of the FluoroBlokTM transwell in our studies.
Figure 3. Cont.Cells 2019, 8, 1473 8 of 12
Cells 2019, 8, x FOR PEER REVIEW 9 of 13
Figure 3. EPAC1 and PDE1C cooperate to allow HASMC LEP formation. (A) Representative
Figure 3. EPAC1 and PDE1C cooperate to allow HASMC LEP formation. (A) Representative images,
images, obtained
obtained at 10xatmagnification,
10x magnification, of actin-stained
of actin-stained LEPs detected
LEPs detected on the loweron the lower
levels levels (bottom)
(bottom) of
of FluoroBlok TM transwell (3-µm pores) following a 4 h exposure of HASMCs to an FBS gradient
FluoroBlok transwell (3-μm pores) following a 4 h exposure of HASMCs to an FBS gradient in the
TM
in the presence
presence of vehicle
of vehicle (0.1% (0.1%
DMSODMSO v/v)same
v/v) or this or this same concentration
concentration of DMSOC-33
of DMSO containing containing
(1 μM) orC-33 (1
or PF-04827736
µM)PF-04827736 (1 µM). Prior to exposure of these cells to the FBS gradient,
(1 μM). Prior to exposure of these cells to the FBS gradient, the cells had been transfectedthe cells had been
either with a control siRNA (siCtrl), an EPAC1-targeting siRNA, or a
transfected either with a control siRNA (siCtrl), an EPAC1-targeting siRNA, or a PDE1C-targeting PDE1C-targeting siRNA
(siPDE1C) for 48 h. Actin (red) and nuclei (blue) were visualized by incubating fixed
siRNA (siPDE1C) for 48 h. Actin (red) and nuclei (blue) were visualized by incubating fixed cells with cells with TRITC-
conjugated phalloidin
TRITC-conjugated or DAPI,
phalloidin orrespectively (scaling bars,
DAPI, respectively 50 μm).bars,
(scaling Note:50 Since
µm).3 μm pores
Note: precluded
Since 3 µm pores
migration of HASMCs to the lower level of these transwells, no DAPI (blue) staining is present in
precluded migration of HASMCs to the lower level of these transwells, no DAPI (blue) staining is
these images. (B) Quantification in the density of LEPs in siCtrl or siEPAC1 transfected cells treated
present in these images. (B) Quantification in the density of LEPs in siCtrl or siEPAC1 transfected
as above. Data from n = 3 independent experiments were normalized to appropriate controls and
cells treated as above. Data from n = 3 independent experiments were normalized to appropriate
significance was calculated using a two-way ANOVA and the Tukey’s post-hoc analysis, *** p < 0.001,
controls
**** p and significance
< 0.0001. was calculated
(C) Quantification of LEPusing
density a two-way
in HASMCs ANOVA
treated and
with the
DMSOTukey’s
(0.1%post-hoc
v/v) or this analysis,
< 0.001,
*** psame p <
concentration of DMSO containing C-33 (1 μM) in the presence or absence of CE3F4 (20 μM). (0.1%
**** 0.0001. (C) Quantification of LEP density in HASMCs treated with DMSO
v/v)Data
or this
fromsame
n = 3concentration
experiments were of DMSO containing
normalized C-33 (1
to the vehicle µM)and
DMSO in the presencewas
significance or absence
determined of CE3F4
(20 with
µM).aData fromANOVA
two-way n = 3 experiments
and the Tukey’swere post-hoc
normalized to the
analysis, ***vehicle DMSO
p < 0.001, **** and significance
p < 0.0001. (D) was
determined with of
Quantification a two-way
LEP density ANOVA
in siCtrland the Tukey’s
or siPDE1C post-hoc
HASMCs analysis,
treated *** pCells 2019, 8, 1473 9 of 12
p < 0.05, ** p < 0.01, **** p < 0.0001. (E–H) The impact of transfecting HASMCs with either control
siRNA, EPAC1, or PDE1C-targeting siRNAs, or incubating these cells with either PDE1 or EPAC1
inhibitors, either alone or together, on the density of HASMC on the upper levels of the FluoroBlokTM
transwells was measured. (E) Representative images, obtained at 10× magnification, of HASMCs on
the upper levels (top) of FluoroBlokTM transwells (3-µm pores) following a 4 h exposure of siCtrl or
siEPAC1 transfected HASMCs to an FBS gradient in the presence of vehicle (0.1% DMSO v/v) or this
same concentration of DMSO containing either C33 (1 µM) or PF-04827736 (1 µM). Staining for actin
(red) and nuclei (blue) was carried out by incubating fixed cells with TRITC-conjugated phalloidin
or DAPI, respectively (scaling bars, 50 µm). In each siCtrl and siEPAC1 transfected cell images, the
top row shows both actin and nuclei while the lower row of images shows only the nuclei. (F–H)
Quantification of the number of nuclei in a series of images obtained from transwells used in n = 3
independent experiments.
Table 4. LEP formation in siRNA-treated HASMCs +/- the PDE1 inhibitor (C33).
Density of LEPs on Bottom of Transwells (% of Control)
Treatment
DMSO C33 1 µM
siCtrl 100 ± 7.1 175 ± 17 1,2
si1C 196 ± 11 1,2 192 ± 15 1,2
Values are means of n = 3 independent experiments ± SEM. 1 p < 0.001 compared with vehicle-treated HASMC LEP
formation, as determined by a two-way ANOVA and Tukey’s multiple comparisons test. 2 p > 0.05; means are not
significant between siCtrl (C33) and si1C (DMSO) or si1C in the presence or absence of (C33).
4. Discussion
Herein we show that silencing or inhibiting HASMC EPAC1 decreased the ability of these cells to
generate LEPs in response to a chemotactic gradient. In addition, we show that this EPAC1 dependence
for the generation of these actin-based leading-edge structures is regulated selectively by a source of
intracellular cAMP that is regulated by PDE1C activity, but not by PDE3 or PDE4 activities. These
data add to our understanding of the known dichotomous actions of cAMP, and its effectors, PKA and
EPAC1, in the control of HASMC migration-associated activities. Specifically, these data show that
EPAC1, like PKA, positively influences the formation of HASMC LEPs in the presence of a gradient
and identify a potentially important role for PDE1C in these effects.
Previous work has shown that modulating EPAC1 activity could either increase or decrease ASMC
migration. Indeed, these earlier studies showed that EPAC1 activation with 8-CPT-20 -O-Me-cAMP
promoted rat aortic SMC migration and facilitated ASMC accumulation into neointimal lesions formed
following damage to murine femoral arteries [26]. Consistent with this, mice deficient in EPAC1 had
reduced neointimal hyperplasia and ASMC migration under similar experimental conditions [26,27].
Interestingly, when SMCs isolated from human saphenous vein samples were used in experiments,
EPAC1 activation negatively regulated their PDGF-induced migratory responses [28]. In this context,
our work has begun to “unpack” these more global effects of EPAC1 in ASMCs and show that inhibiting
EPAC1 activity, or markedly reducing its expression, inhibited LEP formation by migrating HASMCs.
Our findings under conditions in which we pharmacologically activated EPAC1 were consistent
with the idea that subjecting HASMC to a chemotactic gradient maximally activated EPAC1. Of
course, further studies will be required to determine if this is the case, and more importantly, whether
subjecting these cells to an FBS gradient selectively activates the fraction of EPAC1 localized at the
leading edge of these cells. In addition, methodological differences between our study and others may
also account for the differences which we observed. For instance, it was recently reported that EPAC1
could regulate SMC migration in a time- and concentration-dependent manner. Thus, it was reported
that while high concentrations of the EPAC1 activator 8-CPT-20 -O-Me-cAMP (30–50 µM) significantlyCells 2019, 8, 1473 10 of 12
increased SMC migration compared to control untreated SMCs for up to 6 h, these effects were lost and
replaced with inhibitory effects at longer time points [29].
With regards to the mechanism by which PDE1C regulates LEP formation in HASMCs, our data
suggest that PDE1C regulates a distinct pool of cAMP than those regulated by PDE3 or PDE4. While
some of our earlier and ongoing studies have shown that PDE1C is likely important in regulating the
ability of PKA to impact LEP formation via effects on the store-operated calcium entry (SOCE) system
in HASMCs [30], significant further work will be required in order to determine how PDE1C regulates
EPAC1-mediated effects in these cells. In this context, previous work by others showed that the impact
of SOCE in mediating cellular migration is influenced by the relative adhesive strength properties of the
matrix and the cells [31]. Thus, it may be that PDE1C and EPAC1 will interact to regulate LEP formation
differently when different matrix proteins are used. Indeed, EPAC1 may facilitate SMC LEP formation
by interacting with different integrins based on the ECM protein tested [32]. In addition, it is likely that
EPAC1 may impact SMC LEP formation by interacting with agents that control microtubule stability,
since EPAC1 has been shown to regulate microtubule elongation [33]. For example, the low molecular
weight GTPase Rap1, an EPAC1 effector, was shown to be activated at the leading edge of migrating
vascular endothelial cells, and this was shown to accompany microtubule extension [34]. Furthermore,
the importance of EPAC1 in regulating cell migration and microtubule stability was also previously
reported, when inhibition of EPAC1 disrupted microtubule organization [35]. Another recent study
identified the importance of graded cAMP signaling in mediating axonal guidance by promoting
microtubule growth and membrane protrusion [36]. Therefore, future studies will be required to
determine the impact of EPAC1 on microtubule stability in mediating ASMC protrusion and migration,
and perhaps in other systems as well. Given the importance of Ca2+ signaling in guiding directed cell
migration in processes, such as mesodermal sheet migration and gastrulation, axonal growth cone
steering in developing neurons, and metastasis [36–38], the PDE1C/EPAC1 axis supports a connection
by which Ca2+ and cAMP signaling systems may interact with one another locally to guide these
physiological and pathological processes. In the context of HASMC LEP formation, PDE1C is known
to be induced in migratory and proliferative vascular SMCs [21,39,40], thus this signaling axis provides
a potential molecular target to mitigate vascular diseases where SMC migration is dysregulated, such
as atherosclerosis and restenosis.
Author Contributions: P.B. and D.H.M. conceptualized, analyzed, and co-wrote this manuscript.
Funding: This work was supported by the Canadian Institutes of Health Research to D.H.M. (PJT 156283,
Compartmented cAMP Signaling Regulates Human Arterial Endothelial Cell Inflammatory and Angiogenic
Responses; MOP 57699, Vascular Endothelial Cell Activators and Shear Stresses in Health and Disease).
Acknowledgments: We thank Dr. Guy Breitenbucher, Dart Neurosciences, for Compound 33 (C33).
Conflicts of Interest: The authors declare no conflict of interest.
References
1. Palmer, D.; Tsoi, K.; Maurice, D.H. Synergistic inhibition of vascular smooth muscle cell migration by
phosphodiesterase 3 and phosphodiesterase 4 inhibitors. Circ. Res. 1998, 82, 852–861. [CrossRef] [PubMed]
2. Lehrke, M.; Kahles, F.; Makowska, A.; Tilstam, P.V.; Diebold, S.; Marx, J.; Stohr, R.; Hess, K.; Endorf, E.B.;
Bruemmer, D.; et al. PDE4 inhibition reduces neointima formation and inhibits VCAM-1 expression and
histone methylation in an Epac-dependent manner. J. Mol. Cell Cardiol. 2015, 81, 23–33. [CrossRef] [PubMed]
3. Maurice, D.H.; Ke, H.; Ahmad, F.; Wang, Y.; Chung, J.; Manganiello, V.C. Advances in targeting cyclic
nucleotide phosphodiesterases. Nat. Rev. Drug Discov. 2014, 13, 290–314. [CrossRef] [PubMed]
4. Howe, A.K. Regulation of actin-based cell migration by cAMP/PKA. Biochim. Biophys. Acta 2004, 1692,
159–174. [CrossRef] [PubMed]
5. Sinha, C.; Ren, A.; Arora, K.; Moon, C.S.; Yarlagadda, S.; Woodrooffe, K.; Lin, S.; Schuetz, J.D.; Ziady, A.G.;
Naren, A.P. PKA and actin play critical roles as downstream effectors in MRP4-mediated regulation of
fibroblast migration. Cell Signal. 2015, 27, 1345–1355. [CrossRef]Cells 2019, 8, 1473 11 of 12
6. Benz, P.M.; Ding, Y.; Stingl, H.; Loot, A.E.; Zink, J.; Wittig, I.; Popp, R.; Fleming, I. AKAP12 deficiency impairs
VEGF-induced endothelial cell migration and sprouting. Acta Physiol. 2019, e13325. [CrossRef]
7. Sinha, C.; Ren, A.; Arora, K.; Moon, C.S.; Yarlagadda, S.; Zhang, W.; Cheepala, S.B.; Schuetz, J.D.; Naren, A.P.
Multi-drug resistance protein 4 (MRP4)-mediated regulation of fibroblast cell migration reflects a dichotomous
role of intracellular cyclic nucleotides. J. Biol. Chem. 2013, 288, 3786–3794. [CrossRef]
8. Howe, A.K.; Baldor, L.C.; Hogan, B.P. Spatial regulation of the cAMP-dependent protein kinase during
chemotactic cell migration. Proc. Natl. Acad. Sci. USA 2005, 102, 14320–14325. [CrossRef]
9. Raymond, D.R.; Carter, R.L.; Ward, C.A.; Maurice, D.H. Distinct phosphodiesterase-4D variants integrate
into protein kinase A-based signaling complexes in cardiac and vascular myocytes. Am. J. Physiol. Heart Circ.
Physiol. 2009, 296, H263–H271. [CrossRef]
10. Baillie, G.S.; Tejeda, G.S.; Kelly, M.P. Therapeutic targeting of 3’,5’-cyclic nucleotide phosphodiesterases:
Inhibition and beyond. Nat. Rev. Drug Discov. 2019. [CrossRef]
11. Bobin, P.; Belacel-Ouari, M.; Bedioune, I.; Zhang, L.; Leroy, J.; Leblais, V.; Fischmeister, R.; Vandecasteele, G.
Cyclic nucleotide phosphodiesterases in heart and vessels: A therapeutic perspective. Arch. Cardiovasc. Dis.
2016, 109, 431–443. [CrossRef] [PubMed]
12. Halls, M.L.; Cooper, D.M.F. Adenylyl cyclase signalling complexes - Pharmacological challenges and
opportunities. Pharmacol. Ther. 2017, 172, 171–180. [CrossRef] [PubMed]
13. Roberts, O.L.; Dart, C. cAMP signalling in the vasculature: The role of Epac (exchange protein directly
activated by cAMP). Biochem. Soc. Trans. 2014, 42, 89–97. [CrossRef] [PubMed]
14. Metrich, M.; Berthouze, M.; Morel, E.; Crozatier, B.; Gomez, A.M.; Lezoualc’h, F. Role of the cAMP-binding
protein Epac in cardiovascular physiology and pathophysiology. Pflugers Arch. 2010, 459, 535–546. [CrossRef]
15. Afewerki, T.; Ahmed, S.; Warren, D. Emerging regulators of vascular smooth muscle cell migration. J. Muscle
Res. Cell Motil. 2019. [CrossRef]
16. Moss, S.C.; Bates, M.; Parrino, P.E.; Woods, T.C. Isolation of endothelial cells and vascular smooth muscle
cells from internal mammary artery tissue. Ochsner J. 2007, 7, 133–136.
17. Cho, S.Y.; Klemke, R.L. Purification of pseudopodia from polarized cells reveals redistribution and activation
of Rac through assembly of a CAS/Crk scaffold. J. Cell Biol. 2002, 156, 725–736. [CrossRef]
18. Schmidt, M.; Dekker, F.J.; Maarsingh, H. Exchange protein directly activated by cAMP (epac): A multidomain
cAMP mediator in the regulation of diverse biological functions. Pharmacol. Rev. 2013, 65, 670–709. [CrossRef]
19. Rampersad, S.N.; Freitag, S.I.; Hubert, F.; Brzezinska, P.; Butler, N.; Umana, M.B.; Wudwud, A.R.; Maurice, D.H.
EPAC1 promotes adaptive responses in human arterial endothelial cells subjected to low levels of laminar
fluid shear stress: Implications in flow-related endothelial dysfunction. Cell Signal. 2016, 28, 606–619.
[CrossRef]
20. MacKeil, J.L.; Brzezinska, P.; Burke-Kleinman, J.; Craig, A.W.; Nicol, C.J.B.; Maurice, D.H. A PKA/cdc42
Signaling Axis Restricts Angiogenic Sprouting by Regulating Podosome Rosette Biogenesis and Matrix
Remodeling. Sci. Rep. 2019, 9, 2385. [CrossRef]
21. Cai, Y.; Nagel, D.J.; Zhou, Q.; Cygnar, K.D.; Zhao, H.; Li, F.; Pi, X.; Knight, P.A.; Yan, C. Role of
cAMP-phosphodiesterase 1C signaling in regulating growth factor receptor stability, vascular smooth
muscle cell growth, migration, and neointimal hyperplasia. Circ. Res. 2015, 116, 1120–1132. [CrossRef]
[PubMed]
22. Rose, R.J.; Liu, H.; Palmer, D.; Maurice, D.H. Cyclic AMP-mediated regulation of vascular smooth muscle
cell cyclic AMP phosphodiesterase activity. Br. J. Pharmacol. 1997, 122, 233–240. [CrossRef] [PubMed]
23. Ahn, H.S.; Bercovici, A.; Boykow, G.; Bronnenkant, A.; Chackalamannil, S.; Chow, J.; Cleven, R.; Cook, J.;
Czarniecki, M.; Domalski, C.; et al. Potent tetracyclic guanine inhibitors of PDE1 and PDE5 cyclic guanosine
monophosphate phosphodiesterases with oral antihypertensive activity. J. Med. Chem. 1997, 40, 2196–2210.
[CrossRef] [PubMed]
24. Dyck, B.; Branstetter, B.; Gharbaoui, T.; Hudson, A.R.; Breitenbucher, J.G.; Gomez, L.; Botrous, I.; Marrone, T.;
Barido, R.; Allerston, C.K.; et al. Discovery of Selective Phosphodiesterase 1 Inhibitors with Memory
Enhancing Properties. J. Med. Chem. 2017, 60, 3472–3483. [CrossRef]
25. Humphrey, J.M.; Movsesian, M.; Am Ende, C.W.; Becker, S.L.; Chappie, T.A.; Jenkinson, S.; Liras, J.L.; Liras, S.;
Orozco, C.; Pandit, J.; et al. Discovery of Potent and Selective Periphery-Restricted Quinazoline Inhibitors of
the Cyclic Nucleotide Phosphodiesterase PDE1. J. Med. Chem. 2018, 61, 4635–4640. [CrossRef]Cells 2019, 8, 1473 12 of 12
26. Yokoyama, U.; Minamisawa, S.; Quan, H.; Akaike, T.; Jin, M.; Otsu, K.; Ulucan, C.; Wang, X.; Baljinnyam, E.;
Takaoka, M.; et al. Epac1 is upregulated during neointima formation and promotes vascular smooth muscle
cell migration. Am. J. Physiol. Heart Circ. Physiol. 2008, 295, H1547–H1555. [CrossRef]
27. Kato, Y.; Yokoyama, U.; Yanai, C.; Ishige, R.; Kurotaki, D.; Umemura, M.; Fujita, T.; Kubota, T.; Okumura, S.;
Sata, M.; et al. Epac1 Deficiency Attenuated Vascular Smooth Muscle Cell Migration and Neointimal
Formation. Arterioscler. Thromb. Vasc. Biol. 2015, 35, 2617–2625. [CrossRef]
28. McKean, J.S.; Murray, F.; Gibson, G.; Shewan, D.A.; Tucker, S.J.; Nixon, G.F. The cAMP-producing agonist
beraprost inhibits human vascular smooth muscle cell migration via exchange protein directly activated by
cAMP. Cardiovasc. Res. 2015, 107, 546–555. [CrossRef]
29. Adderley, S.P.; Martin, D.N.; Tulis, D.A. Exchange protein activated by cAMP (EPAC) controls migration of
vascular smooth muscle cells in concentration- and timedependent manner. Arch. Physiol. 2015, 2. [CrossRef]
30. Brzezinska, P.; Payne, D.; Rampersad, S.; MacKeil, J.; Burke-Kleinman, J.; Maurice, D. PDE1C regulates the
dynamics of actin-based structures in migrating human arterial smooth muscle cells. FASEB J. 2017, 31, 826.
31. Tsai, F.C.; Seki, A.; Yang, H.W.; Hayer, A.; Carrasco, S.; Malmersjo, S.; Meyer, T. A polarized Ca2+,
diacylglycerol and STIM1 signalling system regulates directed cell migration. Nat. Cell Biol. 2014, 16, 133–144.
[CrossRef] [PubMed]
32. Eid, A.H. cAMP induces adhesion of microvascular smooth muscle cells to fibronectin via an Epac-mediated
but PKA-independent mechanism. Cell Physiol. Biochem. 2012, 30, 247–258. [CrossRef] [PubMed]
33. Sehrawat, S.; Ernandez, T.; Cullere, X.; Takahashi, M.; Ono, Y.; Komarova, Y.; Mayadas, T.N. AKAP9
regulation of microtubule dynamics promotes Epac1-induced endothelial barrier properties. Blood 2011, 117,
708–718. [CrossRef] [PubMed]
34. Fujita, H.; Fukuhara, S.; Sakurai, A.; Yamagishi, A.; Kamioka, Y.; Nakaoka, Y.; Masuda, M.; Mochizuki, N.
Local activation of Rap1 contributes to directional vascular endothelial cell migration accompanied by
extension of microtubules on which RAPL, a Rap1-associating molecule, localizes. J. Biol. Chem. 2005, 280,
5022–5031. [CrossRef] [PubMed]
35. Kumar, N.; Gupta, S.; Dabral, S.; Singh, S.; Sehrawat, S. Role of exchange protein directly activated by cAMP
(EPAC1) in breast cancer cell migration and apoptosis. Mol. Cell Biochem. 2017, 430, 115–125. [CrossRef]
[PubMed]
36. Akiyama, H.; Fukuda, T.; Tojima, T.; Nikolaev, V.O.; Kamiguchi, H. Cyclic Nucleotide Control of Microtubule
Dynamics for Axon Guidance. J. Neurosci. 2016, 36, 5636–5649. [CrossRef]
37. Hayashi, K.; Yamamoto, T.S.; Ueno, N. Intracellular calcium signal at the leading edge regulates mesodermal
sheet migration during Xenopus gastrulation. Sci. Rep. 2018, 8, 2433. [CrossRef]
38. Tsai, F.C.; Kuo, G.H.; Chang, S.W.; Tsai, P.J. Ca2+ signaling in cytoskeletal reorganization, cell migration, and
cancer metastasis. Biomed. Res. Int. 2015, 2015, 409245. [CrossRef]
39. Rybalkin, S.D.; Bornfeldt, K.E.; Sonnenburg, W.K.; Rybalkina, I.G.; Kwak, K.S.; Hanson, K.; Krebs, E.G.;
Beavo, J.A. Calmodulin-stimulated cyclic nucleotide phosphodiesterase (PDE1C) is induced in human
arterial smooth muscle cells of the synthetic, proliferative phenotype. J. Clin. Invest. 1997, 100, 2611–2621.
[CrossRef]
40. Rybalkin, S.D.; Rybalkina, I.; Beavo, J.A.; Bornfeldt, K.E. Cyclic nucleotide phosphodiesterase 1C promotes
human arterial smooth muscle cell proliferation. Circ. Res. 2002, 90, 151–157. [CrossRef]
© 2019 by the authors. Licensee MDPI, Basel, Switzerland. This article is an open access
article distributed under the terms and conditions of the Creative Commons Attribution
(CC BY) license (http://creativecommons.org/licenses/by/4.0/).You can also read