SATELLITE SYMPOSIUM DISCLOSURE - MSVIRTUAL2020 INDUSTRY SUPPORTED

Page created by Michelle Frank
 
CONTINUE READING
SATELLITE SYMPOSIUM DISCLOSURE - MSVIRTUAL2020 INDUSTRY SUPPORTED
MSVirtual2020 Industry Supported
         Satellite Symposium Disclosure
                           This activity is an independently supported
                    Satellite Symposium not included in the MSVirtual2020
                      accredited program. CME certification provided by
                                Penn State College of Medicine.

                     Please note by viewing the symposium, you agree to
                     share contact details with the symposium organizer.

     PRESENTED AT                      Disclosure slide is property of MSVirtual2020. Permission required for reuse.
#MSVirtual2020
SATELLITE SYMPOSIUM DISCLOSURE - MSVIRTUAL2020 INDUSTRY SUPPORTED
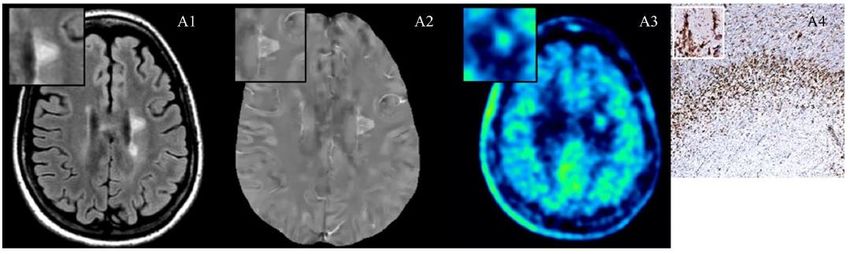
What’s New in Relapsing MS?
Expert Perspectives on Pathogenesis,
 Targeting B Cells for Treatment, and
Advances in Disease-State Monitoring
SATELLITE SYMPOSIUM DISCLOSURE - MSVIRTUAL2020 INDUSTRY SUPPORTED
Disclosures

  Xavier Montalban, MD, PhD, FEAN, FAAN, has a financial interest/relationship or affiliation in
  the form of:
  Consultant and/or Advisor for Actelion Pharmaceuticals Ltd; Alexion Pharmaceuticals, Inc.; Biogen;
  Celgene Corporation; EMD Serono, Inc.; F. Hoffman-La Roche Ltd.; Genzyme Corporation; Immunic,
  Inc.; MedDay Pharmaceuticals; Merck & Co., Inc.; Mylan Inc.; NervGen Pharma Corp.; Sanofi; Teva
  Pharmaceutical Industries Ltd.; and TG Therapeutics.
  Grant/Research Support from Actelion Pharmaceuticals Ltd; Alexion Pharmaceuticals, Inc.; Biogen;
  Celgene Corporation; EMD Serono, Inc.; F. Hoffman-La Roche Ltd.; Genzyme Corporation; Immunic,
  Inc.; MedDay Pharmaceuticals; Merck & Co., Inc.; Mylan Inc.; NervGen Pharma Corp.; Sanofi; Teva
  Pharmaceutical Industries Ltd.; and TG Therapeutics.

This CME activity is jointly provided by Penn State College of Medicine and PVI, PeerView Institute for Medical Education.
This activity is supported by an educational grant from EMD Serono, Inc.
SATELLITE SYMPOSIUM DISCLOSURE - MSVIRTUAL2020 INDUSTRY SUPPORTED
Disclosures
  Prof. Dr. med. Dr. h. c. mult. Ludwig Kappos has a financial interest/relationship or affiliation in
  the form of:
  Consultant and/or Advisor for Actelion Pharmaceuticals Ltd.; Allergan plc; Almirall, S.A; Baxalta; Bayer
  AG; Biogen; Celgene Corporation/Receptos; CSL Behring; Desitin Arzneimittel GmbH; EXECMED;
  Eisai Co., Ltd.; F. Hoffmann-La Roche Ltd.; Genzyme Corporation; JT International SA; Minoryx
  Therapeutics SL; Merck & Co., Inc.; Novartis AG; Pfizer AG; Sanofi; Santhera Pharmaceuticals; and
  Teva Pharmaceutical Industries Ltd.
  Grant/Research Support from Bayer AG; Biogen; The European Union; Novartis AG; Inno-Suisse;
  Roche Research Foundations; The Swiss MS Society; and The Swiss National Research Foundation.
  Other Financial or Material Support from steering committees for Actelion Pharmaceuticals Ltd.;
  Allergan plc; Almirall, S.A; Baxalta; Bayer AG; Biogen; Celgene Corporation/Receptos; CSL Behring;
  Desitin Arzneimittel GmbH; EXECMED; Eisai Co., Ltd.; F. Hoffmann-La Roche Ltd.; Genzyme
  Corporation; JT International SA; Minoryx Therapeutics SL; Merck & Co., Inc.; Novartis AG; Pfizer AG;
  Sanofi; Santhera Pharmaceuticals; and Teva Pharmaceutical Industries Ltd. License fees for
  Neurostatus-UHB products.

This CME activity is jointly provided by Penn State College of Medicine and PVI, PeerView Institute for Medical Education.
This activity is supported by an educational grant from EMD Serono, Inc.
SATELLITE SYMPOSIUM DISCLOSURE - MSVIRTUAL2020 INDUSTRY SUPPORTED
Disclosures

   Amit Bar-Or, MD, FRCPC, has a financial interest/relationship or affiliation in the form of:
   Consultant and/or Advisor for Atara Biotherapeutics, Inc.; Biogen; Celgene Corporation/Receptos Inc.;
   F. Hoffmann-La Roche Ltd/Genentech, Inc.; Janssen Pharmaceuticals, Inc./Actelion Pharmaceuticals
   Ltd; Merck & Co., Inc./EMD Serono, Inc.; Novartis Pharmaceuticals Corporation; and sanofi-aventis U.S.
   LLC/Genzyme Corporation.
   Grant/Research Support from Biogen; EMD Serono, Inc.; F. Hoffmann-La Roche Ltd/Genentech, Inc.;
   and Novartis Pharmaceuticals Corporation.

This CME activity is jointly provided by Penn State College of Medicine and PVI, PeerView Institute for Medical Education.
This activity is supported by an educational grant from EMD Serono, Inc.
SATELLITE SYMPOSIUM DISCLOSURE - MSVIRTUAL2020 INDUSTRY SUPPORTED
Visit us at
PeerView.com/MSLive2020
• Rewatch this afternoon’s web broadcast online (available within
  the next 24 hours) or watch for the onDemand version in the
  coming weeks
• Download the slides and Practice Aids                 Join the
                                                        conversation on
• Apply for CME credit                                  Twitter @PeerView
                        Need more information?
                   Send an email to live@PeerView.com
SATELLITE SYMPOSIUM DISCLOSURE - MSVIRTUAL2020 INDUSTRY SUPPORTED
MS Clinical Characteristics and
 Patterns of Disease Progression
                 Xavier Montalban, MD, PhD, FEAN, FAAN
                                       Chairman and Director
Neurology-Neuroimmunology Department & Neurorehabilitation
              Multiple Sclerosis Centre of Catalonia (Cemcat)
                    Vall d’Hebron Barcelona Hospital Campus
                                             Barcelona, Spain
SATELLITE SYMPOSIUM DISCLOSURE - MSVIRTUAL2020 INDUSTRY SUPPORTED
MS Phenotype Descriptions for Disease Courses1

    Relapsing Disease                                                                                        Progressive Disease
                                                                                         Progressive accumulation
       Clinically                         Not activea                                     of disability from onset
        isolated                                                                                                                                    Activea and with progressionc
       syndrome                              Activea,b
          (CIS)                                                                              (Primary Progressive)
                                                                                                                                                   Active but without progression
                                                                                             Progressive Disease                                  Not active but with progression

       Relapsing-                         Not activea                                     (Secondary Progressive)                                       Not active and without
        remitting                                                                                                                                    progression (stable disease)
         disease                                                                         Progressive accumulation
         (RRMS)                               Activea                                        of disability after
                                                                                             relapsing course
a Activity determined by clinical relapses and/or MRI activity (contrast-enhancing lesions; new or unequivocally enlarging T2 lesions assessed at least annually); if
assessments are not available, activity is “indeterminate.” b CIS, if subsequently clinically active and fulfilling current multiple sclerosis (MS) diagnostic criteria, becomes
relapsing-remitting MS (RRMS). c Progression measured by clinical evaluation, assessed at least annually. If assessments are not available, activity and progression
are “indeterminate.”
1. Lublin FD et al. Neurology. 2014;83:278-286.
SATELLITE SYMPOSIUM DISCLOSURE - MSVIRTUAL2020 INDUSTRY SUPPORTED
MS Clinical Courses1,2

                                RRMS                                                           SPMS                                                   PPMS
Disability

                                                                  Disability

                                                                                                                         Disability
                              Time                                                             Time                                                  Time
             Relapse                                                           RRMS
                                                                                                                                      Active (relapse or new MRI activity)
             Active without worsening                                          Active (relapse or new MRI activity)                   with progression
                                                                               with progression
             Worsening                                                                                                                Not active without progression (stable)
             (incomplete recovery from relapse)                                Active (relapse or MRI activity)
                                                                               without progression                                    Not active with progression
             Stable without activity
                                                                               Not active with progression                            Active without progression
             New MRI activity
                                                                               Not active without progression (stable)                New MRI activity

                                                                               New MRI activity

  1. Lublin FD et al. Neurology. 2014;83:278-286. 2. https://www.nationalmssociety.org/What-is-MS/Types-of-MS.
SATELLITE SYMPOSIUM DISCLOSURE - MSVIRTUAL2020 INDUSTRY SUPPORTED
2020 Clarification: Recommended Terms and Time Frames1

                                                                                                             Recommended
   Term                                                       Definition
                                                                                                        Time Frame for Evaluation
   Active disease                      Clinical: relapses, acute or subacute episodes of new or       Annually (but can be another time
                                     increasing neurologic dysfunction, followed by full or partial    frame, as long as it is specified)
                                             recovery, in the absence of fever or infection

                                                                 and/or

                                            Imaging: gadolinium-enhancing lesions or new or           Annually (but can be another time
                                                  unequivocally enlarging T2 lesions                   frame, as long as it is specified)
   Progressing                         Accrual of disability, independent of any relapse activity,     Annually by clinical assessment
   disease or disease                   during the progressive phase of MS (PPMS or SPMS)              (but can be another time frame,
   progression                                                                                            as long as it is specified)
   Worsening disease                     Any increase in impairment/disability irrespective of
                                       whether it has resulted from residual deficits following a
                                                                                                                 Not required
                                       relapse or (increasing) progressive disability during the
                                                   progressive phase of the illness

1. Lublin FD et al. Neurology. 2020;94:1088-1092.
Research Needed to Better Understand
                                      and Define Phenotypes (2013)1
    • Longitudinal studies to better associate imaging with phenotypes and transitions
      between subtypes over time
    • Imaging studies of correlation between phenotypes and measures of tissue damage
    • Clinical and imaging assessment of RIS to speed MS diagnosis
    • Identification of optimal assessment time frames
    • Cohort studies
         – Importance of clinical and imaging activity in mid- and long-term outcomes
         – Impact of degree of acute relapse recovery on outcomes and phenotype
           descriptions
         – Potential fluid-borne markers
    • Exploration of electrophysiologic assessments and patient-reported outcomes relative
      to clinical course
1. Lublin FD et al. Neurology. 2014;83:278-286.
Imaging That!
Imaging Techniques
 for MS Assessment
Prof. Dr. med. Dr. h. c. mult. Ludwig Kappos
                               Chair Neurology
        Departments of Medicine, Biomedicine,
Clinical Research and Biomedical Engineering
                      University Hospital Basel
                            Basel, Switzerland
MRI Provides More Information for MS Management1

    MRI Roles in MS Assessment1                                                                                          Deeper Information With MRI2
    • Diagnostic component

                                                                                                Detectable/measurable
                                                                                                 in real-world setting
    • Staging and disease progression                                                                                               Relapses
                                                                                                                                    Disability
                                                                                                                                                          Clinical assessments

              – Baseline tissue damage and                                                                                   New or enlarged T2 lesions
                                                                                                                               Gd-enhancing lesions       Conventional MRI
                subsequent repair                                                                                                   Black holes

              – Lesion burden                                                                                                    Cortical lesions
                                                                                                                                  Brain volume
                                                                                                                                                          Advanced MRI
                                                                                                                                     NAWM

              – Assessment of prognosis/long-                                                                                         NAGM

                                                                                                                                 Neurofilaments
                term disability risk                                                                                               Cytokines              CSF/serum
                                                                                                                                 No metabolites           biomarkers

    • Monitoring of treatment response
                                                                                                                               Neurotrophic factors

1. Wattjes MP et al. Nat Rev Neurol. 2015;11:597-606. 2. Gasperini C et al. Neurology. 2019;92:180-192.
2017 McDonald Diagnostic Criteria1

                                                                                                         • DIS by MRI: ≥1 T2 hyperintense lesions in
                                                                                                           ≥2 of 4 areas (periventricular, cortical or
                                                                Data Needed                                juxtacortical, infratentorial, and spinal
    Attacks                       Lesions                                                                  cord)
                                                                for Diagnosis
          ≥2                            ≥2                                None                           • DIT by MRI: simultaneous GAD-
                                                                                                           enhancing and nonenhancing lesions or
          ≥2               1 + historical                                 None                             new lesion on follow-up
                          evidence of DIS
                                                                                                         MRI updates versus 2010
          ≥2                              1                               DISa                           • Inclusion of symptomatic, as well as
            1                           ≥2                                 DITb                            asymptomatic, lesions in determining DIS
                                                                                                           and DIT
            1                             1                     DISa and DITb
                                                                                                         • Inclusion of cortical, as well as
                                                                                                           juxtacortical, lesions in determining DIS
                                                                                                         • DIS with OB+ are also diagnostic
aDemonstrated by attack at implicating a different site or MRI. b Demonstrated by attack implicating a different site, MRI or OCB.
1. Thompson AJ et al. Lancet. 2018;17:162-173.
Conventional MRI for Monitoring
                                      Disease State and Treatment Effects1
    • Conventional MRI
         – T2-weighted sequences
         – Contrast-enhanced T1-weighted sequences
    • Active MRI lesions are detected more frequently than clinical relapses
         – 5- to 10-fold more
         – Especially in RRMS
    • MRI lesions suggest insufficient biological effect of treatment

1. Gasperini C et al. Neurology. 2019;92:180-192.
Recent MAGNIMS Position Paper:
                                               Monitoring Treatment Response1
                  Clinical Axis                                                 Clinical Axis                                           Clinical Axis
                                        Neurodegeneration                                         Neurodegeneration                                          Neurodegeneration
                       Disability did
                        not worsen

                                                                                                                                            Disability did
                                                                                                                                             not worsen
                                                                                  Disability

                                                                                   worsen
                                                                                   did not
                                                                                                                                                                    CSF/Serum
                                                                                                                                                                      Axis

         No MRI                                    MRI               No MRI                        No loss of         MRI
                  NEDA-3                                                         NEDA-4
         activity                                  Axis              activity                     brain volume        Axis                                                  MRI
                                                                                                                             No MRI       NEDA-5              No loss of
                                                                                                                             activity                        brain volume   Axis
                          No Relapse

                                                                                     No Relapse

                                                                                                                                            Relapse
                                                                                                                                              No
          Inflammation                                                 Inflammation                                                 Inflammation

              Recommendations and future directions
              • Adopt NEDA for future clinical trials
              • Consider expanding NEDA with other activity indicators
              • For real-world applicability, consider MEDA (eg,
Recent MAGNIMS Consensus Statement:
Recommendations for Atrophy Measures in Clinical Practice1
            Defining and Predicting                                     Monitoring
                                                                                                    Clinical Implementation
                  MS Severity                                        Therapeutic Effect
    • Measurement of global brain                             • Whole brain atrophy over ≥12    • Appropriate management of
      volume to gauge disease                                   months as a clinical trial        scanner-related factors to
      burden                                                    endpoint                          ensure reliability
    • Measurement of cervical cord                            • Gray matter volume loss as an   • Appropriate management of
      area loss                                                 outcome measure (expected)        physiological and MS-related
                                                                                                  factors
    • Further research: relevance of                          • Re-baseline at 6 to 12 months   • Use of software approved as a
      gray matter volume changes,                               to limit pseudoatrophy impact     medical device and evaluated in
      including thalami, basal ganglia,                                                           MS—further validation of
      and specific cortical areas                                                                 existing software
                                                              • Further research: association
                                                                between treatment effects on
                                                                brain atrophy and disability;
                                                                spinal cord atrophy
1. Sastre-Garriga J et al. Nat Rev Neurol. 2020;16:171-182.
Association of Deep Gray Matter and Thalamic Volume Loss
              With Disability Progression in MS1
 • Longitudinal study
      – 6 years
      – Participants: RRMS (n = 179), SMPS (n = 50)
 • Thalamus and striatum volumes were associated with EDSS at baseline
 • Only thalamic volume loss was associated with EDSS change at follow-up (anterior
   nucleus, pulvinar, ventral anterior nuclei)
 • MS phenotype and annual rates of volume loss (thalamus, bentral lateral nucleus)
   predicted worsening disability

1. Magon S et al. J Neurol. 2020;267:1536-1546.
Emerging MRI Approaches1

   Normal-appearing WM:                                                          Leptomeningeal infiltrates
   1H-MRS; TSC;                                                                  (ELFS): high and ultra-high
   DWI/NODDI; MT imaging                                                         field MRI (post-contrast 3D
   (eg, qMT, ihMT); MWI                                                          T2-FLAIR)

   WM lesion: peripheral rim                                                     Cortical lesions: expanded
   (susceptibility weighted                                                      inclusion criteria (McDonald
   imaging/iron deposits),                                                       criteria); networks
   SELs; CVS                                                                     approaches; fMRI

                                                                                 Normal-appearing GM:
                                                                                 registration techniques for
                                                                                 PBVCs; spatiotemporal
                                                                                 pattern/advanced MRI
                                                                                 sequences

1. Cortese R et al. Ther Adv Neurol Disord. 2019;12:1-15.
Central Vein Sign (CVS): MS Diagnosis

   • Criteria for use of CVS in MS diagnosis                                                                           CVS in Patient With MS
     have been proposed (eg, >40% of
     lesions)1,2
   • Proportion of lesions with CVS3
       − RRMS: 50%
       − CIS: 60%
       − NMSOD: 0%
       − SLE: 16%
       − Migraine/cluster headache: 9%
   • Potential for MS diagnosis in CIS, RIS, or
     atypical neurological presentations, but
     more trials are needed1,2
                                                                                                                                                  3D

1. Sorensen PS et al. Brain. 2020 July 24 [Epub ahead of print]. 2. Vattoth S et al. Curr Probl Diagn Radiol. 2020 June 29 [Epub ahead of print]. 3.
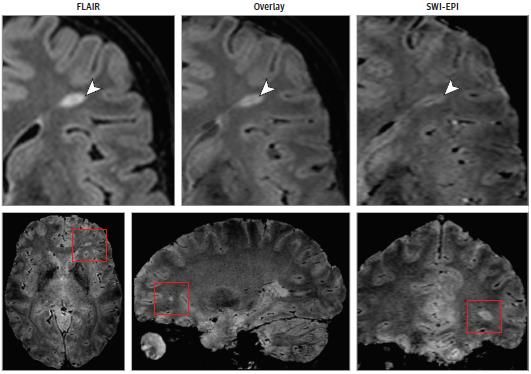
Sinnecker T et al. JAMA Neurol. 2020;76:1446-1456.
Peripheral Rim (Susceptibility-Weighted Imaging and
                    Paramagnetic Rims): MS Progression
    • Chronic active lesions detected
      using susceptibility-based MRI1-4
    • Non-gadolinium enhancing, with
      paramagnetic rim1-3                                                       Imaging of Lesion With Paramagnetic Rim4
         − Indicate demyelination
           (edge), remyelination failure,
           and axonal degeneration
         − Rims have iron-containing,
           activated macrophages,
           and microglia
         − Correlate with disability
         − More common in PMS
           than RRMS

1. Sorensen PS et al. Brain. 2020 July 24 [Epub ahead of print]. 2. Absinta M et al. JAMA Neurol. 2019;76:1474-1483. 3. Matthews PM. Nat Rev
Neurol. 2019;15:582-593. 4. Bagnato F et al. J Neuroimaging. 2020;30:251-266.
Leptomeningeal Enhancement (LME)
        Ectopic lymphoid follicle-like structures (ELFs), identified through LME, are associated more with cortical
               atrophy and disability, and have been considered to be more prevalent in progressive MS1

    7T MRI Cerebral LME in RRMS2                                                                        ELFs in Progressive MS3
    • Gadolinium-enhanced 3D MP2RAGE and                                                                • Autopsy tissue (UK MS Tissue Bank); 11 PPMS,
      FLAIR (Fig: pre- and post-contrast)                                                                 22 SPMS, 2 Parkinson’s disease, 15 healthy
    • LME identified in 20/30 individuals with RRMS                                                       control

    • Associated with longer disease duration,                                                          • More ELFs in SPMS samples (Fig)
      increased cortical and thalamic lesion number                                                     • B cells and lack of regulatory T cells identified in
      and volume                                                                                          the ELFs                       P = .032
                                                                                                                                                          100                      Score 1
                                                                                                                                                              80                   Score 2

                                                                                                                                                 Percentage
                                                                                                                                                                                   Score 3
                                                                                                               Higher score                                   60
                                                                                                              indicates more                                  40
                                                                                                               lymphocytes                                    20

                                                                                                                                                               0
                                                                                                                                                                   SP PP SP PP -MS
                                                                                                                                                                   Brain Spinal Cord

1. Cortese R et al. Ther Adv Neurol Disord. 2019;12:1-15. 2. Zurawski J et al. Mult Scler. 2020;26:177-187. 3. Bell L et al. Front Immunol. 2020;10:3090.
Case-Based Discussion

   Assessment of
  MS Disease Status
Clinical Case

 33-year-old male
 Born in Venezuela; living in Barcelona for the last 1.5 years
 Smoker
 Ex-alcoholic
 Major depressive syndrome with several suicide attempts
 Gastric bypass for morbid obesity
 He was admitted in our hospital for an important gait problem,
  and bradyphrenia
Clinical Case Continued

                     OB +

                     Ab. Anti AQ4 negative

                     Ab. Anti MOG negative
Clinical Case Continued

             10
                                                    RM cerebral 07/19
             9                               ↑ Volumen lesional, patrón tipo Baló
             8
             7
EDSS Score

                    PLEX
             6
             5
                  IVMP
             4
             3
             2
             1
                   06/2019 07/2019 08/2019 09/2019 10/2019 11/2019 12/2019 01/2020 02/2020 03/2020 04/2020
Clinical Case Discussion

• What MRI features could have informed the diagnosis and treatment?
• How would identification of these features affect treatment?
Current Perspectives
                   on MS Pathogenesis
                                              Amit Bar-Or, MD, FRCPC
                   Melissa and Paul Anderson Distinguished Professor
Director, Center for Neuroinflammation and Experimental Therapeutics
            Chief, Multiple Sclerosis Division, Department of Neurology
                      Perelman Center for Advanced Medicine (PCAM)
                                              University of Pennsylvania
                  President, International Society for Neuroimmunology
                                              Philadelphia, Pennsylvania
Overview of Current Perspectives on MS Pathogenesis

• Historical perspectives: T cells as main mediators of MS pathogenesis
Overview of Current Perspectives on MS Pathogenesis

• Historical perspectives: T cells as main mediators of MS pathogenesis
• Emerging concepts in MS immune pathogenesis (evolving landscape)
  – Updated understanding of roles of pathogenic elements
     Cell types: B cells, T cells, myeloid cells; microglia, astrocytes
     Cell interactions: through cytokines, receptors
  – Distinguish roles of these elements in relapsing and progressive MS
• Implications to patient care and future therapeutics
Simplified Model of MS Immunopathogenesis

  Periphery

              BBB
                    CNS
Simplified Model of MS Immunopathogenesis

   1. Activation
                    B cell

            Th

  Periphery

                   BBB
                             CNS
Simplified Model of MS Immunopathogenesis

   1. Activation
                      B cell

            Th

        2. Adhesion

  Periphery

                   BBB
                               CNS
Simplified Model of MS Immunopathogenesis

   1. Activation
                      B cell

                               3. Attraction
            Th

        2. Adhesion

  Periphery

                   BBB
                                 CNS
Simplified Model of MS Immunopathogenesis

   1. Activation                               4. Invasion
                      B cell

                               3. Attraction
            Th

        2. Adhesion

  Periphery

                   BBB
                                 CNS
Simplified Model of MS Immunopathogenesis

   1. Activation                                4. Invasion
                      B cell

                               3. Attraction
            Th

                                                                       B cell

        2. Adhesion
                                                            5. Reactivation

                                          6. Neural/glial
                                            responses
  Periphery

                   BBB
                                 CNS
T Cells as Main Mediators of MS Immune Pathogenesis

       1. Activation                                4. Invasion
                          B cell

                                   3. Attraction
                Th

                                                                           B cell

            2. Adhesion
                                                                5. Reactivation

                                              6. Neural/glial
                                                responses
      Periphery

                       BBB
                                     CNS
Cellular Interactions Drive MS Immune Pathogenesis

      1. Activation                                4. Invasion
                         B cell

                                  3. Attraction
               Th

                                                                          B cell

           2. Adhesion
                                                               5. Reactivation

                                             6. Neural/glial
                                               responses
     Periphery

                      BBB
                                    CNS
Cellular Interactions Drive MS Immune Pathogenesis

             1. Activation                                4. Invasion
                                B cell

                                         3. Attraction
                      Th

                                                                                 B cell

Relapsing         2. Adhesion
                                                                      5. Reactivation
 biology
                                                    6. Neural/glial
                                                      responses
            Periphery

                             BBB
                                           CNS
Cellular Interactions Drive MS Immune Pathogenesis

             1. Activation                                4. Invasion
                                B cell

                                         3. Attraction
                      Th

                                                                                 B cell

Relapsing         2. Adhesion
                                                                      5. Reactivation
 biology
                                                    6. Neural/glial
                                                      responses
            Periphery

                             BBB
                                                                                   Progressive
                                           CNS
                                                                                     biology
Cellular Interactions Drive MS Immune Pathogenesis

             1. Activation                                4. Invasion
                                B cell

                                         3. Attraction
                      Th

                                                                                 B cell

Relapsing         2. Adhesion
                                                                      5. Reactivation
 biology
                                                    6. Neural/glial                       Infiltrating
                                                      responses                         immune cells;
            Periphery                                                                microglia, astrocytes

                             BBB
                                                                                   Progressive
                                           CNS
                                                                                     biology
Overview of Current Perspectives on MS Pathogenesis

• Historical perspectives: T cells as main mediators of MS pathogenesis
• Emerging concepts in MS immune pathogenesis (evolving landscape)
  – Updated understanding of roles of pathogenic elements
     Cell types: B cells, T cells, myeloid cells; microglia, astrocytes
     Cell interactions: through cytokines, receptors
  – Distinguish roles of these elements in relapsing and progressive MS
• Implications to patient care and future therapeutics
Cellular Immunology of Multiple Sclerosis:
                               Major Checkpoints Regulating Disease1

                                                            T cells
                                                               CD4+ Teff: ThIL-17; Th IL-17/IFNg; Th GM-CSF
                                                               CD8+ Teff: Conventional CD8; MAIT cells
                                                               Treg: nTreg; iTreg; CD8-suppressors

                                                CNS-Directed
                                                 ANTIGEN-
                                                 SPECIFIC
                                                 RESPONSE

1. Li R et al. Nat Immunol. 2018;19:696-707.
Cellular Immunology of Multiple Sclerosis:
                               Major Checkpoints Regulating Disease1

                                                            T cells
                                                               CD4+ Teff: ThIL-17; Th IL-17/IFNg; Th GM-CSF
                                                               CD8+ Teff: Conventional CD8; MAIT cells
                                                               Treg: nTreg; iTreg; CD8-suppressors

                                                CNS-Directed
                                                 ANTIGEN-
                                                 SPECIFIC
                                                 RESPONSE

                                                                   Myeloid cells
                                                                    ‘M2’: IL-10 (M2a-c)
                                                                    ‘M1’: IL-12 / IL-23

1. Li R et al. Nat Immunol. 2018;19:696-707.
Cellular Immunology of Multiple Sclerosis:
                               Major Checkpoints Regulating Disease1

                                                                     T cells
                                                                        CD4+ Teff: ThIL-17; Th IL-17/IFNg; Th GM-CSF
                                                                        CD8+ Teff: Conventional CD8; MAIT cells
                                                                        Treg: nTreg; iTreg; CD8-suppressors

                                                ?        CNS-Directed
                                                          ANTIGEN-
                                                          SPECIFIC
                                                          RESPONSE

                                               B cells                      Myeloid cells
                                                                             ‘M2’: IL-10 (M2a-c)
                                                                             ‘M1’: IL-12 / IL-23

1. Li R et al. Nat Immunol. 2018;19:696-707.
Cellular Immunology of Multiple Sclerosis:
                               Major Checkpoints Regulating Disease1

                                                                     T cells
                                                                        CD4+ Teff: ThIL-17; Th IL-17/IFNg; Th GM-CSF
                                  Traditional                           CD8+ Teff: Conventional CD8; MAIT cells
                                                                        Treg: nTreg; iTreg; CD8-suppressors
                                     View
                                                         CNS-Directed
                                                          ANTIGEN-
                                                          SPECIFIC
                                                          RESPONSE

                                               B cells                      Myeloid cells
                                                                             ‘M2’: IL-10 (M2a-c)
                                                                             ‘M1’: IL-12 / IL-23

1. Li R et al. Nat Immunol. 2018;19:696-707.
Cellular Immunology of Multiple Sclerosis:
                               Major Checkpoints Regulating Disease1

                                                                            T cells
                                                                               CD4+ Teff: ThIL-17; Th IL-17/IFNg; Th GM-CSF
                                  Traditional                                  CD8+ Teff: Conventional CD8; MAIT cells
                                                                               Treg: nTreg; iTreg; CD8-suppressors
                                     View
                                                                CNS-Directed
                                                                 ANTIGEN-
                                                                 SPECIFIC
                                                                 RESPONSE

                                               B cells                             Myeloid cells
                                                         MS: Abnormal CNS           ‘M2’: IL-10 (M2a-c)
                                                         antibody production        ‘M1’: IL-12 / IL-23
                                                         and deposition, OCB

1. Li R et al. Nat Immunol. 2018;19:696-707.
Cellular Immunology of Multiple Sclerosis:
                               Major Checkpoints Regulating Disease1

                                                                                  T cells
                                                                                     CD4+ Teff: ThIL-17; Th IL-17/IFNg; Th GM-CSF
                                                                                     CD8+ Teff: Conventional CD8; MAIT cells
                                                                                     Treg: nTreg; iTreg; CD8-suppressors

                                                                      CNS-Directed
                                                                       ANTIGEN-
                                                                       SPECIFIC
                                                                       RESPONSE

                                               B cells, PB/PC                            Myeloid cells
                                                Breg: IL-10 / IL-35                       ‘M2’: IL-10 (M2a-c)
                                                Beff: LT / TNFa                           ‘M1’: IL-12 / IL-23
                                                      IL-6 / GM-CSF

1. Li R et al. Nat Immunol. 2018;19:696-707.
Cellular Immunology of Multiple Sclerosis:
                               Major Checkpoints Regulating Disease1

                                                                                  T cells
                                                                                     CD4+ Teff: ThIL-17; Th IL-17/IFNg; Th GM-CSF
                                                                                     CD8+ Teff: Conventional CD8; MAIT cells
                                                                                     Treg: nTreg; iTreg; CD8-suppressors

                                                                      CNS-Directed
                                                                       ANTIGEN-
                                                                       SPECIFIC
                                                                       RESPONSE

      Anti-CD20
                                               B cells, PB/PC                            Myeloid cells
                                                Breg: IL-10 / IL-35                       ‘M2’: IL-10 (M2a-c)
                                                Beff: LT / TNFa                           ‘M1’: IL-12 / IL-23
                                                      IL-6 / GM-CSF

1. Li R et al. Nat Immunol. 2018;19:696-707.
Cellular Immunology of Multiple Sclerosis:
                               Major Checkpoints Regulating Disease1

                                                                                  T cells
                                                                                     CD4+ Teff: ThIL-17; Th IL-17/IFNg; Th GM-CSF
                                                                                     CD8+ Teff: Conventional CD8; MAIT cells
                                                                                     Treg: nTreg; iTreg; CD8-suppressors

                                                                      CNS-Directed
                                                                       ANTIGEN-
                                                                       SPECIFIC
                                                                       RESPONSE

               BTKi                                                                                                          BTKi
                                               B cells, PB/PC                            Myeloid cells
                                                Breg: IL-10 / IL-35                       ‘M2’: IL-10 (M2a-c)
                                                Beff: LT / TNFa                           ‘M1’: IL-12 / IL-23
                                                      IL-6 / GM-CSF

1. Li R et al. Nat Immunol. 2018;19:696-707.
Targeting B Cells as an Emerging
   Approach for MS Treatment
                 Xavier Montalban, MD, PhD, FEAN, FAAN
                                       Chairman and Director
Neurology-Neuroimmunology Department & Neurorehabilitation
              Multiple Sclerosis Centre of Catalonia (Cemcat)
                    Vall d’Hebron Barcelona Hospital Campus
                                             Barcelona, Spain
Growing Evidence Supports Multiple Roles
                                for B Cells in MS Pathophysiology1-7

                             Autoantibody                      T-Cell Activation                          Cytokine                 Formation of Ectopic
                              Production                         B cells are highly                      Production                    Follicle-Like
                           B-cell clones produce              efficient at presenting                B cells from patients              Structures
                           antibodies in the CSF                  antigen to and                   with MS have abnormal           Ectopic B-cell follicles are
                                  and CNS                        activating T cells                proinflammatory profiles        found in the meninges of
                                                                                                                                       patients with MS
1. Colombo M et al. J Immunol. 2000;164:2782-2789. 2. Qin Y et al. J Clin Invest. 1998;102:1045-1050. 3. Constant SL. J Immunol.
1999;162:5695-5703. 4. Crawford A et al. J Immunol. 2006;176(6):3498-3506. 5. Bar-Or A et al. Ann Neurol. 2010;67:452-461.
6. Lisak RP et al. J Neuroimmunol. 2012;246:85-95. 7. Uccelli A et al. Trends Immunol. 2005;26(5):254-259.
Anti-CD20 Antibodies in Multiple Sclerosis1

                               Rituximab (RTX)                Ocrelizumab (OCR)      Ofatumumab (OFA)        Ubilituximab (UTX)

Structure                                   Chimeric IgG1            Humanized              Recombinant                     Glycoengineered
                                            (65% human)              IgG1 (>90%             fully human                     chimeric IgG1
                                                                     human)                 IgG1

Regimen                                     1 g IV                   300 mg IV             20 mg sc                         450 mg IV
                                            d 1 & d 15,              d 1 & d 15,           every 4 w                        d 1 & d 15,
                                            followed                 followed by                                            followed by
                                            by 1 g                   600 mg                                                 450 mg IV
                                            every 24 wk              every 24 wk                                            every 24 wk

Primary                                     CDC                      ADCC                   CDC                             ADCC
mechanism
                             Mouse                          Mouse                                         Mouse
of action
                             Human                          Human                  Human                  Human
Generation                                  First                    Second                 Third                           Third
                                                                                                          Glycoengineered
Immunogenicity                              +++                      ++                     +             Fc                ++

1. Ancau M et al. Expert Opin Biol Ther. 2019;19:829-843.
Ocrelizumab: Phase 3 OPERA I and OPERA II
                                           Pooled Study Design1,2

                                                                                                  Open-Label Extension Screening
                                            Double-Blind Treatment                                                                           Open-Label Extension

                                            Ocrelizumab                                                                                  Ocrelizumab
                     Screening

                                            Dose 1: 300 mg × 2                                                                           Dose 5: 300 mg × 2
                                            Dose 2 to 4: 600 mg × 1                                                                      Dose 6 to N: 600 mg × 1

                                            Interferon β-1a                                                                              Ocrelizumab
                                                    3x weekly                                                                            Dose 5: 300 mg x 2
                                                                                                                                         Dose 6 to N: 600 mg x 1

                     Dose              1               2            3              4                                                     5           6             7             N
                     Visit
                     Week        0/2   12      24      36   48     60      72      84     96                                       0/2   12 22, 24       46, 48        70, 72    N-2, N

                                                Safety Follow-Up                                                                                         B-Cell Monitoring
                                                Duration at least 48 weeks from the date of the last infusion                                            Duration as required
                                                Visits every 12 weeks from the date of the last visit.                                                   Visits every 24 weeks

1. https://www.ncbi.nlm.nih.gov/books/NBK534377. 2. https://commons.wikimedia.org/wiki/File:Monthly_multiple_sclerosis_anim_bg.gif.
OPERA I and OPERA II: Clinical Benefit of Ocrelizumab in
                               RRMS After 5 Years of Treatment1
                                     ARR Over 5 Years: DBP and Years 1 to 3 of the OLE                                               Proportion of Patients With CDP During the DBP and OLE Periods
                                                                                                                                                                           25                IFN β-1a/OCR 600 mg (n = 829)

                                                                                                                                      Proportion of Patients With CDP, %
                                                          Patients receiving IFN β-1a 44 mcg during the DBP
               0.4                                        Patients receiving OCR 600 mg during the DBP and continuing OCR into OLE                                                           OCR 600mg/OCR 600 mg (n = 872)
                                                          Patients switching from IFN β-1a to OCR at OLE baseline
                        P = .001                                                                                                                                           20
Adjusted ARR

               0.3    0.274
                                           P = .001
                                                                                                                                                                           15         DBP: HR = 0.60; P = .003
                                          0.203
               0.2
                              0.14
                                                                  P = .8                                                                                                   10
                                                  0.125                                  P = .97                   P = .7
                                                               0.098 0.103
                                                                                        0.081 0.081                                                                                                                    Start of OLE: All patients treated with OCR
               0.1                                                                                               0.072 0.065                                               5
                                                                                                                                                                                                                        Δ = 4.31           Δ = 5.44           Δ = 4.21       Δ = 5.20
                                                                                                                                                                                                                        (1.27, 7.35)       (1.97, 8.91)       (0.35, 8.08)   (1.05, 9.35)
                                                                                                                                                                                                                        P = .005           P = .002           P = .032       P = .014
               0.0                                                                                                                                                         0
                                          713     765           623    702              594     665              570     639                                               Baseline    24       48       72        96        120     144      168     192      216     240
                n=    829     827
                                                                                                                                                                                                                 Year 2             Year 3           Year 4           Year 5
                         Year 1             Year 2                Year 3                  Year 4                  Year 5                                                                                      (OLE baseline)     (OLE year 1)     (OLE year 2)     (OLE year 3)
                                                              (OLE year 1)             (OLE year 2)             (OLE year 3)
                                                                                                                                                                                                                 Time to onset of CDP, wk

               • At the start of the OLE period, patients who completed the DBP either continued ocrelizumab
                 (OCR-OCR) or were switched from IFNβ-1a to ocrelizumab (IFN-OCR)
               • Switching from IFNβ-1a to ocrelizumab was associated with a reduction in ARR; patients in both groups
                 maintained a reduction in ARR through 4 years of follow-up
               • After 6 years of follow-up, the proportion of patients with CDP at 24 weeks remained lower in those who were
                 initiated to ocrelizumab earlier compared with patients who received IFNβ-1a and also showed that the
                 benefit of early initiated ocrelizumab was maintained compared with patients switching from IFNβ-1a
  1. Hauser SL et al. Neurology. 2020 July 20 [Epub ahead of print].
OPERA I and OPERA II: Total Number of T1 and T2 Lesions
                    in the DBP and OLE1
                                                                                                                       Patients receiving IFN β-1a 44 mcg during the DBP
                                                            T1 Gd-Enhancing Lesions
                                                                                                    P = .001           Patients receiving OCR 600 mg during the DBP and continuing OCR into OLE
                                                            0.6
                                                                                                                       Patients switching from IFN β-1a to OCR at OLE baseline

                               Gd-Enhancing Lesions per
                                                                                                  0.491
                                                            0.5                     P = .001
                                                                    P = .001
                                  Total Number of T1        0.4   0.335           0.342

                                      MRI Scana,b           0.3

                                                            0.2

                                                            0.1           0.029                                   0.007 0.005
                                                                                          0.011           0.017                        0.004 0.017          0.004 0.006
                                                             0
                                                            n=    744 767         691 750         646 718          576 641             531 595              500 544
                                                                  Week 24         Week 48         Week 96          Week 142            Week 190             Week 238
                                                                                   Year 1          Year 2            Year 3             Year ~4              Year ~5
                                                                                                                  (OLE year 1)        (OLE year 2)         (OLE year 3)
                                                            New or Enlarging T2 Lesions
                                                                                                     P = .001
                                                              3                                   2.583
                                                                     P = .001
                                 Enlarging T2 Lesions per
                                 Total Number of New or

                                                            2.5
                                                                   2.06
                                                              2
                                        MRI Scana,b

                                                                                    P = .001
                                                            1.5                   1.154
                                                                          0.931                                        P = .001
                                                              1
                                                                                                                   0.371
                                                            0.5                                                            0.091                             0.038 0.031
                                                                                          0.061           0.063                        0.063 0.08
                                                              0
                                                             n=     747 772        694 754         650 720         580 646             536 599               505 550
                                                                   Weeks 0- 24    Weeks 24-48     Weeks 48-96     Weeks 96-142        Week 142-190         Week 190-238
                                                                                    Year 1          Year 2           Year 3             Year ~4               Year ~5
                                                                                                                  (OLE year 1)        (OLE year 2)         (OLE year 3)
a DBP Week 24, DBP Year 1 and DBP Year 2 data include the ITT population; Year 3 (OLE Year 1), Year 4 (OLE Year 2), and Year 5 (OLE Year 3) data include
the OLE ITT population; clinical cut-off date: February 5, 2018. b Unadjusted rate.
1. Hauser SL et al. Neurology. 2020 July 20 [Epub ahead of print].
Ofatumumab: Phase 3 ASCLEPIOS I and II Study Design1

     • Double-blind, double-dummy, active comparator, controlled trial

                                                          Ofatumumab 20 mg SC once every
     • Ages 18 to 55 y
                                                          4 wka plus placebo oral once daily
     • Confirmed RRMS or SPMS                                   ASCLEPIOS I (n = 465)
       with activity                                           ASCLEPIOS II (n = 481)
     • EDSS score 0 to 5.5                                                                      Open label
     • ≥2 relapses within 2 y before                  R                                         extension
       screening OR ≥1 relapse within                                                           study ≤5 y
                                                          Teriflunomide 14 mg oral once daily
       1 y before screening OR
                                                           plus placebo SC once every 4 wk
       T1 Gd+ lesion during year
                                                                 ASCLEPIOS I (n = 462)
       before randomization
                                                                 ASCLEPIOS II (n = 474)

     • Primary endpoint: ARR
     • Secondary endpoints
       − Clinical: 3-mo and 6-mo CDW, 6-mo CDI
       − MRI and biomarker: Gd+ T1 lesions, new or enlarging T2 lesions, BVL, serum NfL levels
       − Safety
aLoading dose: 3 weekly doses, 20 mg SC.
1. Hauser SL et al. N Engl J Med. 2020;383:546-557.
ASCLEPIOS I and II:
                                                                      Efficacy of Ofatumumab in RRMS1
               • ASCLEPIOS I and II compared subcutaneous ofatumumab with oral teriflunomide
                                                                 ARR                                                                              Confirmed Disability Worsening at 3 and 6 Months
                      0.30          ASCLEPIOS I                               ASCLEPIOS II

                                                                                                                  Cumulative Event Rate, %
                                                                                                                  Kaplan-Meier Estimate of

                                                                                                                                                                                                 Cumulative Event Rate, %
                                                                                                                                                                  3-Month CDW
      Adjusted ARRa

                                                                                                                                                                                                 Kaplan-Meier Estimate of
                                                                                                                                                                                                                            20                 6-Month CDW
                      0.25                  50.5%                                               58.5%                                        24
                                                                                                                                             22                                                                             18
                                                                                0.25                                                                       Ofatumumab                                                                     Ofatumumab
                      0.20                          relative                                  relative                                       20
                                                                                                                                                           Teriflunomide
                                                                                                                                                                                                                            16            Teriflunomide
                                    0.22                                                                                                     18                                15.0%                                        14
                                                   reduction;                                reduction;                                      16                                                                                                               12.0%
                      0.15                                                                                                                   14                                                                             12
                                                    P < .001                                  P < .001                                       12                                10.9%                                        10                                8.1%
                      0.10                                                                                                                   10                                                                              8
                                                                                                                                              8
                                                    0.11                                        0.10                                          6                            Risk reductionb                                   6
                                                                                                                                                                                                                                                           Risk reductionb
                      0.05                                                                                                                    4                                                                              4
                                                                                                                                              2                            34.4%; P = .002                                   2                            32.5%; P = .012
                      0.00                                                                                                                    0                                                                              0
                               Teriflunomide    Ofatumumab                 Teriflunomide    Ofatumumab                                            0    3   6   9 12 15 18 21 24 27 30 33                                         0    3    6   9 12 15 18 21 24 27 30 33
                                 (n = 452)        (n = 454)                  (n = 469)        (n = 469)         No. at Risk                   Study Month                                                                   No. at Risk       Study Month
                             ARR ratio: 0.495 (95% CI, 0.374-0.654)    ARR ratio: 0.415 (95% CI, 0.308-0.559)   Ofatumumab 944 908 878 844 810 784 534 319 176 49                      1     0                              944 908 878 845 815 791 544 324 180 50    1   0
                                                                                                                Teriflunomide 932 901 841 804 756 718 478 298 146 41                   1     0                              932 902 849 812 769 734 487 305 151 43    1   0
                                               Gadolinium T1 Lesions                                                                                  HR = 0.656 (95% CI, 0.499-0.862)                                               HR = 0.675 (95% CI, 0.498-0.916)
                      0.60         ASCLEPIOS I                                 ASCLEPIOS II
                                                                                                                • Ofatumumab led to significant reductions in relapse
    Gd+ T1 Lesionsa

                      0.50
                      0.40        0.4523
                                                    97.5%                   0.5141             93.8%            • ARR average approximately one relapse every 10 years
                                                   relative                                  relative
                      0.30                        reduction;                                reduction;          • Key secondary endpoints also showed benefit in patients
                                                   P < .001                                  P < .001
                      0.20                                                                                        with RRMS
                      0.10
                                                  0.0115                                    0.0317              • MRI data indicated >95% reduction in focal gadolinium
                      0.00
                               Teriflunomide Ofatumumab
                                 (n = 422)     (n = 432)
                                                                          Teriflunomide Ofatumumab
                                                                            (n = 434)     (n = 439)
                                                                                                                  lesions with ofatumumab and a similar reduction in rates
                         Rate ratio: 0.025 (95% CI, 0.013-0.049)      Rate ratio: 0.062 (95% CI, 0.037-0.101)     of new or enlarging T2 lesions
aNegative binomial regression model. b Cox regression model.
1. Hauser SL et al. N Engl J Med. 2020;383:546-557.
Ublituximab: Phase 2 Multicenter Study Design1

    Participants
    • Had completed RDBPC
                                                                                            Infusion Schedule and Assessmentsa
      52-wk study (TG-1101
      RMS 201), which
      assessed a range of                                   UTX            UTX                      UTX                    UTX                              UTX
      UTX IV infusion speeds,
      frequencies, and doses;
      had received
      ≥3 UTX infusions
      and completed all                               Baseline              Week 12
                                                       OLE                                                            Week 48
      assessments in TG-                                                        MRI
                                                                     Week 4                                            EDSS                                Week 72   Week 96
      1101 RMS 201; and                                                                                                 MRI
                                                                      B-cell        Week 24                                                                 EDSS      EDSS
      were in good health with                                                a
                                                                    depletion        MRI                                                                     MRI       MRI
      stable disease
    • 45 of 48 entered OLE
                                                        •      Primary efficacy endpoint: responder rate (ie, median B cell depletion >95%)
    • Mean age: 40 ± 10 y

a B cells and labs were assessed at weeks 0, 1, 2, 3, 4, 8,12,16, 20, 24, 28, 32, 36, 40, 44, 48, 60, 72, 84, 96; clinical assessment included EDSS and,
in addition to times noted on figure, was also assessed at 36, 60, and 80 weeks.
1. Fox E et al. Mult Scler. 2020 Apr 30 [Epub ahead of print].
Ublituximab Phase 2 Study Results1

             T2-Weighted Lesion Volume Change                                                              ARR at Baseline and Week 48         Proportion of Patients With
                                                -7.3%                -10.6%
                                                                                                                                                 no Evidence of Disease
                            16,000   15,410 (P = .006)                                                      1.50     1.45      95% Reduction       Activity at Week 48

                                                                                 Annualized Relapse Rate
                                                                    (P = .002)
 Mean T2 Lesion Vol (mm3)

                            15,000                           -3.6%                                          1.25                                              No
                                                           (P = .019)
                                                                                                            1.00                                  No      Evidence      No 24-wk
                            14,000                                                                                                             Relapses
                                                                                                            0.75                                          of Clinical     CDP
                            13,000                                                                                                               93%       Disease        93%
                                                                                                            0.50                                             87%
                             1,000                                                                          0.25                   0.07
                                 0                                                                          0.00                                            NEDA
                                                                                                                    Baseline     Week 48                    74%
                                     Baseline    Week 24     Week 48

                                                                                                                                                            No
                                                                                                                                                                   No New/
                                                                                                                                               No T1 Gd+ Evidence
                                                                                                                                                                   Enlarging
                                                                                                                                                Lesions   of MRI
                                                                                                                                                                  T2 Lesions
                                                                                                                                                 100%    Disease
                                                                                                                                                                     83%
                                                                                                                                                           83%

1. Fox E et al. Mult Scler. 2020 Apr 30 [Epub ahead of print].
Ublituximab: Phase 3 ULTIMATE 1 and 2 Study Design1-3
     • Phase 3, double-blind, active-control studies to assess safety and efficacy of ublituximab vs teriflunomide
       in patients with RMS

     • Ages 18 to 55 y                                                                 Ublituximab 450 mg
     • Diagnosis of RRMS or SPMS                                                          in 1-h infusion
       with activity                                                                  q 24 wk + oral placebo
     • EDSS score 0 to 5.5                                                                                              Recruitment completed
     • ≥1 relapses within 1 y of                                           R                                            Ultimate 1: N = 549
       screening OR ≥2 relapses within                                                                                  ULTIMATE 2: N = 545
       2 y of screening OR 1 Gd+                                                    Teriflunomide 14 mg oral
       lesion during year before                                                     once daily + IV placebo
       randomization                                                                         q 24 wk

     • Primary endpoint: ARR
     • Secondary endpoints
       − GD+ lesions, no.; NEDA, %; 3-mo CDW, %; patients with relapse, %; time to first confirmed relapse
1. Steinman L et al. European Committee for Treatment and Research in Multiple Sclerosis (ECTRIMS 2019). Poster P991.
2. https://clinicaltrials.gov/ct2/show/NCT03277261?term=NCT03277261&draw=2&rank=1.
3. https://clinicaltrials.gov/ct2/show/NCT03277248?term=NCT03277248&draw=2&rank=1.
Rationale of BTK Inhibition in MS1-5
                                           B Cells                                                                       CNS Microglia
                              BCR activation                                                              Immune complex activation

               Lyn                                                                                   Lyn
                               P           BTK                                                                       P           BTK
                                   Syk            Plcγ                                                                   Syk            Plcγ
                               P                                                                                     P

                                           DAG            IP3     Ca2+                                                            DAG            IP3     Ca2+

          •     B-cell maturation
          •     Proliferation (NF-κB)                                                               •      Microglial activation
          •     Autoantibody production                                                             •      Pro-inflammatory cytokine secretion
          •     Cytokine secretion                                                                         (eg, TNFα, IL-1β, IL-6)
1. Lang C et al. Eur J Med Chem. 2018;151:315-326. 2. Keaney J et al. J Neuroimmune Pharmacol. 2019;14:448-461. 3. Weber A et al. Front Immunol. 2017;8:1454.
4.Gabhann JN et al. PLoS One. 2014;8:e85834. 5. Hendricks RW et al. Nature Chem Biol. 2011;7:4-5. Figure adapted from Hendricks RW et al. Nature Chem Biol.
2011;7:4-5.
Evobrutinib: Phase 2 Study Design1
                                                      Placebo (n = 54)                      Evobrutinib 25 mg qd

                                                                    Evobrutinib 25 mg qd (n = 52)

       Patients
                                                                    Evobrutinib 75 mg qd (n = 53)
      with RMS             R                                                                                                 Evobrutinib
      (1:1:1:1:1)                                                                                                            75 mg qd
                                                                    Evobrutinib 75 mg bid (n = 54)

                                                            Active control (dimethyl fumarate) (n = 54)

                                                                                                                            Safety
                           Screening                                                                                        follow    Open label
                            4 weeks               Blinded treatment 24 weeks              Blinded extension 24 weeks         up 4     extension
                                                                                                                            weeks

    Visits (Week) -4                   0      4        8     12     16     20    24                  36                48            52

     Endpoint           MRI scan            Blood test     MRI Endpoints: Number of Gd+ T1 lesions (primary), number of T2
                                                           lesions; volume of Gd+ T1 lesions. Clinical Endpoints: ARR EDSS
1. Montalban X et al. NEJM. 2019;380:2406-2417.
Results From a Phase 2 Study: Efficacy and Safety of
                           Evobrutinib in Relapsing Forms of MS1
    Patients with relapsing MS were randomized to evobrutinib 25 mg once daily, 75 mg once daily,
                             75 mg twice daily, placebo, or open-label DMF
                8

                7                                                                                        • A trend towards a reduction in ARR was seen
                                                                                                           in patients on evobrutinib, with evidence of
                6
                                                                                 4.78 (22.05)              dose response (P = .03)
    Mean (SD)

                5                  4.06 (8.02)
                                                                                                         • Rates of TEAEs, including grade 3 and serious
                     3.85 (5.44)
                4                                                                                          TEAEs, were comparable with evobrutinib
                3                                                                                          25 and 75 mg once daily and placebo but higher
                                                 1.69 (4.69)                                               with evobrutinib 75 mg twice daily (driven by
                2                                              1.15 (3.70)
                                                                                                           asymptomatic increases in liver transaminases)
                1
                                                                                                         • Evobrutinib 75 mg once daily and twice daily
                0                                                                                          significantly reduced T1 gadolinium-enhancing
                      Placebo      Evobrutinib Evobrutinib Evobrutinib               DMFa
                                   25 mg QDa 75 mg QD 75 mg BID                                            lesions per scan versus placebo
Lesion rate ratiob (95% CI)
                                       1.45        0.30        0.44                                        – Evidence of a dose-response relationship was
                                   (0.72-2.91) (0.14-0.63) (0.21-0.93)
P                                    .2947          .0015        .0313
                                                                                                              observed (trend test; P = .0001)
a Two patients (evobrutinib 25 mg, n = 1; dimethyl fumarate, n = 1) were considered T1 Gd+ outliers. b Based on a negative binomial model for total lesion count
(summed over available scans through week 24) that adjusts for baseline lesion activity. Scans collected within 3 weeks of high-dose corticosteroid use are considered
missing. Subjects missing all post-baseline scans have total lesion count imputed.
1. Montalban X et al. NEJM. 2019;380:2406-2417.
Evobrutinib Phase 2 Study: ARR at Week 24 and Week 481

                                                    Placebo         Evobrutinib 25 mg QD            Evobrutinib 75 mg QD          Evobrutinib 75 mg BID
                                                                     Placebo/evobrutinib 25 mg QD (switch)            Dimethyl fumarate

                                                        0.57
                                0.6                 (0.30-0.97)                                                               0.52
      Unadjusted ARR (95% CI)

                                                                                                                          (0.33-0.78)
                                0.5
                                          0.37                                                                  0.37
                                0.4   (0.17-0.70)                                                           (0.21-0.59)
                                                                                                                                            0.25
                                0.3                                                               0.20                                  (0.12-0.44)
                                                                      0.13                    (0.06-0.47)                                                               0.14
                                0.2                                                                                                                       0.11      (0.06-0.29)
                                                                  (0.03-0.38)       0.08                                                              (0.04-0.25)
                                0.1                                             (0.01-0.30)

                                 0
                                                                   Wk 0 - 24                                                             Wk 0 - 48

1. Montalban X et al. NEJM. 2019;380:2406-2417.
Evobrutinib:
                 Phase 3 Evolution RMS1 and RMS2 Study Design1,2

    • Ages 18 to 55 y                                                                                       Evobrutinib plus
    • RRMS or SPMS with activity                                                                          placebo comparator
    • ≥1 relapse within 2 y before screening
      with 1 relapse within                                                                                                     Open label
      1 y before randomization OR ≥1 T1 Gd+
                                                                                            R                                   extension
      lesion within 6 mo before randomization
    • EDSS score 0 to 5.5                                                                            Placebo evobrutinib plus
    • EDSS score ≤2 if disease duration ≤10 y                                                           active comparatora

    • Primary endpoint: ARR at week 96
    • Secondary endpoints
      − Time to first 12-wk and 24-wk CDP                                              EVOLUTION RMS 1 scheduled completion: October 2026
      − T1 Gd+ lesions;                                                                 EVOLUTION RMS 2 scheduled completion: June 2023
      − New or enlarging T2 lesions
      − PROMIS MS scores at 96 wk
      − AEs
Since the clinical trial was designed, the active comparator has been changed from interferon to teriflunomide.
1. https://clinicaltrials.gov/ct2/show/NCT04032158?term=NCT04032158&draw=2&rank=1.
2. https://clinicaltrials.gov/ct2/show/NCT04032171?term=NCT04032171&draw=2&rank=1.
SAR442168: Phase 2 Study Design1

                                        Primary Endpoint                                             Primary Endpoint
                                                                         SAR442168 (12 wk)
                                     Placebo run-in
                                        (4 weeks)
                                                                          5 mg d (n = 15)                                                      •   SAR442168 is an
                                                                          15 mg d (n = 15)
                                          N = 60                                                                                                   irreversible covalent, oral
                      Cohort 2

                                                                          30 mg d (n = 15)

                                                                                                                    End of core study
                                                                          60 mg d (n = 15)
                                                                                                                                                   small-molecule BTK
                                                                                Primary Endpoint
      S                          R                                                                                                                 inhibitor
                                                    SAR442168 (12 wk)
                                                                                                                                               •   Designed to access the
                      Cohort 1

                                                                                                Placebo run-in
                                                      5 mg d (n = 15)
                                                      15 mg d (n = 15)
                                                                                                   (4 weeks)
                                                                                                     N = 60
                                                                                                                                                   brain and spinal cord by
                                                      30 mg d (n = 15)
                                                      60 mg d (n = 15)                                                                             crossing the blood–brain
                                                                                                                                        LTSS
                                                                                                                                                   barrier

                           Wk 0                    Wk 4                  Wk 8                Wk 12               Wk 16

Images courtesy of https://commons.wikimedia.org/wiki/File:Monthly_multiple_sclerosis_anim_bg.gif.
1. https://clinicaltrials.gov/ct2/show/NCT03889639?term=NCT03889639&draw=2&rank=1.
Efficacy of SAR442168 at Week 121

              Primary Endpoint: Number of New Gd-Enhancing Lesions                                                                               Secondary Endpoint: Number of New or Enlarging T2 Lesions

      Relative change                                                                                                      Relative change
           vs placebo                                  56%            63%            -13%           -85%                        vs placebo                          -10%          -37%          -39%          -89%
               95% CI                              (-17%, 194%)   (-42%, 356%)   (-67%, 126%)   (-97%, -28%)                        95% CI                      (-57%, 86%)   (-71%, 38%)   (-76%, 57%)   (-96%, -68%)
      Number of Lesions, Mean (SD)

                                                                                                                  Number of Lesions, Mean (SD)
                                     5                                                           P = .0178                                       9                                                         P = .0001

                                     4
                                                                                                                                                 6
                                     3

                                     2
                                                                                                                                                 3
                                     1                 1.39
                                          1.03                                                                                                         2.12        1.90                                          0.23
                                                                      0.77             0.76              0.13                                                                    1.32             1.30
                                     0                                                                                                           0
                                         Placebo       5 mg          15 mg          30 mg          60 mg                                              Placebo      5 mg         15 mg         30 mg          60 mg

                                                                           SAR442168                                                                                                  SAR442168
                                                              Analysis Group                                                                                              Analysis Group
   Number of                                                                                                    Number of
                                           59           31             31              33           31                                                  59          31            31               33          31
   patients                                                                                                     patients

1. https://clinicaltrials.gov/ct2/show/NCT03889639?term=NCT03889639&draw=2&rank=1.
SAR442168 Phase 3 Trial1

 • Global, randomized, double-blind trial comparing SAR442168 to teriflunomide
 • N = 900 participants with relapsing forms of MS
 • Primary outcome: efficacy of daily SAR442168 compared to a daily dose of
   14 mg teriflunomide measured by ARR
 • Secondary outcomes: efficacy of SAR442168 compared to teriflunomide on
   disability progression, MRI lesions, cognitive performance and quality of life

1. https://www.globenewswire.com/news-release/2020/06/23/2051690/0/en/Principia-Announces-First-Patient-Enrolled-in-Sanofi-s-Phase-3-Trial-of-SAR442168-in-
Relapsing-Multiple-Sclerosis.html.
Case-Based Discussion

   The Clinical Potential
of Targeting B Cells in MS
Clinical Case Revisited

 33-year-old male
 Born in Venezuela; living in Barcelona for the last 1.5 years
 Smoker
 Ex-alcoholic
 Major depressive syndrome with several suicide attempts
 Gastric bypass for morbid obesity
 He was admitted in our hospital for an important gait problem,
  and bradyphrenia
Clinical Case Continued

             10
                                                    RM cerebral 07/19
             9                               ↑ Volumen lesional, patrón tipo Baló
             8
             7
EDSS Score

                     PLEX
             6
             5
                  IVMP
             4
             3
             2
             1
                   06/2019 07/2019 08/2019 09/2019 10/2019 11/2019 12/2019 01/2020 02/2020 03/2020 04/2020
Clinical Case Continued

             10
             9
             8                    OCR 300mg
                                     IVMP                          MR 11/2019
             7
EDSS Score

                     PLEX                                           ↓ Burden
             6                           OCR 300mg              0 new / no active
             5
                  IVMP
             4
                                                                                            OCR
             3                                                                              600mg

             2
             1
                   06/2019 07/2019 08/2019 09/2019 10/2019 11/2019 12/2019 01/2020 02/2020 03/2020 04/2020
Clinical Case Discussion

Possible Candidates for BTK Inhibitor therapy

   • Active naïve patients

   • Switching from first line for inefficacy/intolerance

   • Switching from second line for safety issues

   • After anti-CD 20 treatment in stable patients

   • Others
Key Takeaways for Your
   Clinical Practice
Remember to complete and submit your Post-Test and
Evaluation at PeerView.com/MSLive2020-Credit for CME credit.
                     Missed anything?

Visit us at: PeerView.com/MSLive2020
  • Download slides and Practice Aids
  • Watch for the onDemand version of this symposium
  • Join the conversation on Twitter @PeerView
                 Thank you and good day.
Abbreviations

ADCC: antibody dependent cellular cytotoxicity         CVS: central vein sign
ARR: annualized relapse rate                           DAG: diacylglycerol
BBB: blood-brain barrier                               DBP: double-blind phase
BCR: B-cell receptor                                   DIS: dissemination in space
Beff: effector B cell                                  DIT: dissemination in time
BID: twice daily                                       DMF: dimethyl fumarate
Breg: regulatory B cell                                DWI: diffusion weighted imaging
BTK: Bruton tyrosine kinase                            EDSS: expanded disability status scale
BTKi: Bruton tyrosine kinase inhibitor                 ELFS: ectopic lymphoid follicles
BVL: brain volume loss                                 GAD: gadolinium
CD: cluster of differentiation                         Gd: gadolinium
CDC: complement-dependent cytotoxicity                 GM-CSF: granulocyte-macrophage colony-stimulating factor
CDI: confirmed disability improvement                  IFN: interferon
CDP: confirmed disability progression                  IFNγ: interferon gamma
CDW: confirmed disability worsening                    ihMT: inhomogeneous magnetization transfer
Abbreviations

IL-10: interleukin 10                                       MT: magnetization transfer
IL-12: interleukin 12                                       MWI: myelin water imaging
IL-17: interleukin 17                                       NAGM: normal-appearing gray matter
IL-1β: interleukin 1 β                                      NAWM: normal-appearing white matter
IL-23: interleukin 23                                       NEDA: no evidence of disease activity
IL-35: interleukin 35                                       NfL: neurofilament light chain
IL-6: interleukin 6                                         NF-κB: nuclear factor kappa-light-chain-enhancer of activated B
                                                            cells
IP3: inositol 1,4,5-trisphosphate
                                                            NMSOD: neuromyelitis optica spectrum disorder
iTreg: induced regulatory T cell
                                                            NODDI: neurite orientation dispersion and density imaging
IVMP: intravenous methylprednisolone
                                                            nTreg: natural regulatory T cell
LTSS: long-term safety study
                                                            OB: oligoclonal band
MAGNIMS: magnetic resonance imaging in multiple sclerosis
                                                            OCB: oligoclonal band
MAIT: mucosal-associated invariant T cell
                                                            OCR: ocrelizumab
MEDA: minimal evident disease activity
                                                            OLE: open-label extension
MRS: magnetic resonance spectroscopy
                                                            PB: plasma blast
Abbreviations

PBVC: percentage brain volume change                       SPMS: secondary progressive multiple sclerosis
PC: plasma cell                                            T2-FLAIR: T2-weighted-fluid-attenuated inversion recovery
Plcγ: phospholipase gamma                                  TEAE: treatment-emergent adverse event
PLEX: plasma exchange                                      Teff: effector T cell
PPMS: primary progressive multiple sclerosis               Th: T-helper cell
PROMIS: Patient-Reported Outcomes Measurement Information TNFα: tumor necrosis factor alpha
System
                                                          Treg: regulatory T cell
QD: once daily                                            TSC: tuberous sclerosis complex
qMT: quantitative magnetization transfer                   UTX: ublituximab
RDBPC: randomized, double-blind, and placebo-controlled    WM: white matter
RIS: radiologically isolated syndrome
RMS: relapsing multiple sclerosis
SEL: slowly evolving lesion
SLE: systemic lupus erythematosus
You can also read