Mesocosm study of microalgae in different weather conditions. Estudio del mesocosmos de microalgas en diferentes condiciones climáticas
←
→
Page content transcription
If your browser does not render page correctly, please read the page content below
Sustainability, Agri, Food and Environmental Research, (ISSN: 0719-3726), 8(X), 2020:
http://dx.doi.org/10.7770/safer-V0N0-art2156

   Mesocosm study of microalgae in different weather conditions.

 Estudio del mesocosmos de microalgas en diferentes condiciones
                                          climáticas

 Munay Abdulqadir Alteerah*, Mohammad Noor Amal Azmai, Hishamuddin Omar and Ahmad
                                              Ismail

Department of Biology, Faculty of Science, University Putra Malaysia, 43400, UPM Serdang,
Selangor Darul Ehsan, Malaysia.

* Correspondent author: munay.abdulqadir@uob.edu.ly

                                                ABSTRACT

       Microalgae have valuable contributions in carbon dioxide sequestration. There are no
much investigations about motivation of mix microalgae productivity in outdoor cultures. This
study aims to evaluate microalgae biomass production in outdoor mesocosms under different
weather conditions. The experiment was done in Tilapia pond in the hatchery of fisheries of
Universiti Putra Malaysia. Weather parameters were recorded daily. Microalgae seeds were
obtained from Tilapia pond effluent and added to eight floating aerated mesocosms.
Mesocosms were divided into four treatments. Two g triple supper phosphate: 20g Urea were
used as fertilizers. Physical and chemical conditions, microalgae primary productivity and
biomass, and species composition were measured every two days. Three cycles were
categorized as mix, wet and dry cycles based on weather recording scores. Water quality
parameters in treatments and controls cultures showed significant variations. Primary
production variables were higher in the fertilized non-sheltered mesocosms (treatment 1).
Productivity variables were lower in the dry cycle and higher in the mix cycle. The highest
value of fixed CO2 was (3.2) mg/L/d in treatment 1 in the mix cycle, while the lowest value
was (0.11) mg/L/d in treatment 3 and control 1 in dry cycle. Changes in weather patterns are
seen in the light and temperature values. Microalgae biomass was lower in dry weather
conditions because of effect of high air temperature. Weather conditions and different
treatments significantly influenced microalgae species composition, due to the sensitivity in
some of them to different light intensities. Chlorophytes were the most abundant due to their
ability to adapt with different culture conditions.
Sustainability, Agri, Food and Environmental Research, (ISSN: 0719-3726), 8(X), 2020:
http://dx.doi.org/10.7770/safer-V0N0-art2156
Key words: Primary productivity, Mesocosms, Climate change, Microalgae biomass, Weather
change, Chlorophytes dominance.
RESUMEN
Las microalgas tienen contribuciones valiosas en el secuestro de dióxido de carbono.
No hay muchas investigaciones sobre la motivación de mezclar la productividad de
microalgas en cultivos al aire libre. Este estudio tiene como objetivo evaluar la producción de
biomasa de microalgas en mesocosmos exteriores bajo diferentes condiciones climáticas. El
experimento se realizó en un estanque de tilapia en el criadero de pesquerías de Universiti
Putra Malaysia. Los parámetros meteorológicos se registraron diariamente. Se obtuvieron
semillas de microalgas del efluente del estanque de tilapia y se agregaron a ocho
mesocosmos aireados flotantes. Los mesocosmos se dividieron en cuatro tratamientos. Dos g
de fosfato triple cena: 20 g de urea se utilizaron como fertilizantes. Cada dos días se
midieron las condiciones físicas y químicas, la biomasa y productividad primaria de
microalgas y la composición de especies. Tres ciclos se clasificaron como ciclos mixtos,
húmedos y secos según las puntuaciones de los registros meteorológicos. Los parámetros de
calidad del agua en los cultivos de tratamientos y controles mostraron variaciones
significativas. Las variables de producción primaria fueron mayores en los mesocosmos
fertilizados no abrigados (tratamiento 1). Las variables de productividad fueron menores en
el ciclo seco y mayores en el ciclo de mezcla. El valor más alto de CO2 fijo fue (3.2) mg / L /
d en el tratamiento 1 en el ciclo de mezcla, mientras que el valor más bajo fue (0.11) mg / L
/ d en el tratamiento 3 y el control 1 en el ciclo seco. Los cambios en los patrones climáticos
se ven en los valores de luz y temperatura. La biomasa de microalgas fue menor en
condiciones de clima seco debido al efecto de la alta temperatura del aire. Las condiciones
climáticas y los diferentes tratamientos influyeron significativamente en la composición de las
especies de microalgas, debido a la sensibilidad de algunas de ellas a diferentes intensidades
de luz. Las clorofitas fueron las más abundantes debido a su capacidad para adaptarse a
diferentes condiciones de cultivo.
Palabras clave: Productividad primaria, Mesocosmos, Cambio climático, Biomasa de
microalgas, Cambio climático, Dominio de clorofitas.
INTRODUCTION
World economies, human health, weather patterns were affected negatively by global
warming (Adio-Moses & Aladejana, 2016; Damari et al., 2016; Murray & Lopez, 2013).Sustainability, Agri, Food and Environmental Research, (ISSN: 0719-3726), 8(X), 2020:
http://dx.doi.org/10.7770/safer-V0N0-art2156
Carbon dioxide capture and sequestration is one of the most serious challenges nowadays for
global warming reduction ( Fernández et al., 2012). Microalgae as large consumer of CO 2 can
sequester carbon dioxide from gases emission in atmosphere (Ma & Gao, 2014;Saharan et
al., 2013;Singh & Ahluwalia, 2013), however, the cost of CO2 sequestration depends on the
microalga biomass and productivity (Farrelly et al., 2013). The high photosynthesis rate and
the rapid growth rate are the main characters of CO 2 fixation by microalgae (Wu et al.,
2012).
Cultivation methods and conditions influence microalgae biomass production. A
combination of light intensity, temperature and nutrient level have profound effect on
microalgae growth (Choi, 2014; Fagiri et al., 2013; Khalili et al., 2015). The higher growth
rate of microalgae reflects the high light intensity and durations (Harun et al., 2014). The
influence of temperature on algal cell structure ranged broadly between algae species,
because there is a high correlation between temperature and cell volume (Agrawal, 2009; He
et al., 2013; Yu et al., 2014). Temperature impacts significantly on the cellular chemical
composition, nutrients uptake, CO2 assimilation and consequently impacts the growth rates
for each species of microalgae. Temperature fluctuation controlled the high rate of microalgae
outdoor production (Ras et al., 2013). In addition, the distribution of carbon dioxide and
availability can be changed because of pH. The extreme pH levels can alter the availability of
essential nutrients, and led to direct physiological effects ( Costache et al., 2013; Razzak et
al., 2015; Shen et al., 2014). Microalgae growth depends on nutrient level in culture medium,
phosphorus and nitrogen are the main important nutrient that enquired for growth (
Brito et al., 2013; Kim et al., 2014; Procházková et al., 2014).
Microalgae produced on a larger scale are either grown in open ponds or in photo
bioreactors. Using mesocosms for microalgae cultivation and biomass production is also
interesting and can give valuable achievements ( Hernando et al., 2006; Petersen et al.,
1997; Sommer, 2009; Sutherland et al., 2016; Vidoudez et al., 2011). So, the main
objectives of current study are record growth and species composition of microalgae in
mesocosms in semi-controlled condition under variable weather conditions.
MATERIAL AND METHODS
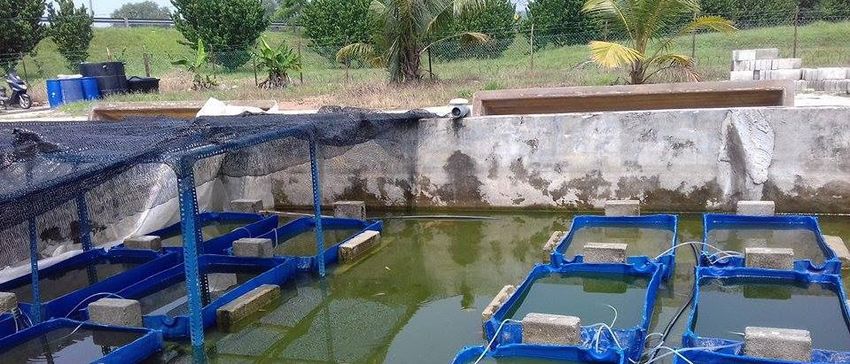
Experimental design and algal culture techniques: The experimental was done in
Tilapia pond (TPU) in the hatchery of fisheries of Universiti Putra Malaysia (UPM) from March
to May 2016. Ten litres of microalgae seeds (10% of culture volume) were added to eight
(110 L) capacity floating mesocosms as four treatments, treatment 1: non- sheltered with
fertilizers, treatments 2: non- sheltered without fertilizers, treatment 3: sheltered with
fertilizers, treatment 4: sheltered without fertilizers. The sheltered mesocosms covered by
shelter with black orchid plastic netting of 50% light transmission. Microalgae seeds were
obtained from Tilapia pond effluent. Two g triple supper phosphate: 20g Urea were used asSustainability, Agri, Food and Environmental Research, (ISSN: 0719-3726), 8(X), 2020:
http://dx.doi.org/10.7770/safer-V0N0-art2156
fertilizers (personal communication with Dr. Hishamuddin Omar). Aeration (2 hours on/ 2
hours off) throughout the day was performed. Sample collection was done in alternative
days; one cycle period was 10 days.
Figure 1: The floating mesocosms filled by microalgae culture in fish pond.
Weather conditions recording: Air temperature (Bing weather free application), light
intensity by using light meter Licor model (L1-250), and weather state (rainy, cloudy, sunny,
haze) were recorded daily three times a day at 8-9 am, 12-1pm, and 4-5 pm. Currently
weather data of Bing online weather application comes from multiple providers such as
Weather.com, Foreca and AccuWeather.com.
Physical and chemical conditions: The pH was measured by pH meter, water
temperature and dissolved oxygen measured by dissolved oxygen meter (YSI MODEL 58).
Light intensity measured by light meter Licor model (L1-250), conductivity measured by AST
meter. Alkalinity was measured by titration of 100 ml of sample with 0.02 N sulphuric acid
using few drops of mixed reagent (methyl red and bromocresol green) as an indicator to
determine the end of the titration, the colour change from blue to colourless (VL Snoeyink &
D Jenkins, 1980). Total nitrogen and Nitrate-nitrogen analyses were carried out according to
Kitamura et al., (1982). Ammonium concentration was analysed based on phenol
hypochlorite method described by Weatherburn (1967). Phosphate-phosphorus (PO4-P) was
determined according to the ascorbic acid method (Ademoroti, 1996). Total phosphorus was
measured according to Parsons et al. (1984).
Quantifying algal biomass: Water samples were measured immediately by Hitachi UC-
1900 UV visible spectrophotometer at 680 nm three times for each sample and the average
was taken to determine optical density. For dry weight measuring, 50 ml of water sample
was filtered by predried Sartorius glass filter paper in oven dried at 60°C for 24h
(Borowitzka et al., 1991). To measure Chlorophyll a, 30 ml of water sample from each bottle
was filtered by MS® cellulose acetate membrane filter (0.45 µm). Chlorophyll a wasSustainability, Agri, Food and Environmental Research, (ISSN: 0719-3726), 8(X), 2020:
http://dx.doi.org/10.7770/safer-V0N0-art2156
extracted with 5ml (90%) acetone overnight at 4°C. The extraction was homogenized by
driller. After centrifugation, the absorbance of the supernatant was measured by
spectrophotometer (Hitachi UC-1900) (Gertraud Hötzel & Roger Croome, 1999). Chlorophyll a
was calculated by the equation of Jeffrey and Humphrey (Jeffrey & Humphrey, 1975):
[Chl. a] extract = 11.85A664 - 1.54A647 - 0.08A630
Microalgae primary productivity: Primary productivity measured for each mesocosm in
day 6 and day 10 of each cycle by incubation of one light bottle and one dark bottle for two
hours, then dissolved oxygen measured using the Azide modification method by titration
(Ademoroti, 1996). Initial dissolved oxygen measured immediately by portable probe. Gross
primary productivity, net primary productivity and fixed carbon were calculated by the
following equations:
Community respiration (R) = initial - dark
Gross primary productivity (GPP) = Light – dark
Net primary productivity (NPP) = GPP-R
Carbon fixed= NPP*0.375
Since (0.375) is the factor comes from differences in atomic mass (12/32)
Microalgae Productivity in (g/L/d)
Productivity was calculated using the following equation according to (Eliane Dalva Godoy
Danesi et al., 2011):
Px = (Xm – Xi)(Tc)-1
where: Px = productivity (g/L/ day)
Xi = initial biomass concentration (g/ L)
Xm = maximum biomass concentration (g/ L)
Tc = cultivation time related to the maximum biomass concentration (days)
Cell density and species composition study: One hundred ml water samples collected
from each mesocosms, and then two drops of glutaraldehyde were added for microalgae
preservation. Settlement and counting methods (Edler &Elbrächter, 2010).
Statistical analysis: Factorial ANOVA statistical analysis from SPSS version 21 was
used to indicate the significant of variance among microalgae culture treatments, weather
conditions and days of microalgae growth. Daily air temperatures and light intensities were
analysed statistically by one way ANOVA SPSS version 21.Sustainability, Agri, Food and Environmental Research, (ISSN: 0719-3726), 8(X), 2020:
http://dx.doi.org/10.7770/safer-V0N0-art2156
RESULTS
Weather conditions scoring and categories: Weather conditions in Malaysia is a very
complicated event because it considers about daily fluctuation of sunlight, cloud cover, haze
and rainfall. Thus, it is important to classify the interpreted weather conditions. Weather
conditions during current study period have been scored and categories, since each
cultivation cycle was under one type of weather conditions, mix, wet and dry. Each culture
cycle is for 10 days. Weather conditions during the mix characterized by dense cloud cover,
mix cloudy sky, heavy haze, light rains. In the wet cycle, weather conditions characterized by
heavy rains many times a day or daily, and cloud cover. In the dry cycle, weather conditions
characterized by sunny sky, no rains or light rain.
Table 1: Summary of weather scoring and categories for three microalgae cultivation cycles
: 1 to 4 indicate to wet weather conditions, 5 to 7 indicate to mix weather conditions, 8 to 10
indicate to dry weather.
Days of Cycle 1 Cycle 2 Cycle 3
cycle
D1 5 10 1
D2 6 10 3
D3 5 9 4
D4 4 8 2
D5 6 9 3
D6 5 7 4
D7 7 7 1
D8 4 10 3
D9 5 8 4
D10 6 9 2
Average 5.3 8.7 2.7
category Mix Wet Dry
Table 2: Mean ±SE of air temperature and light intensity at three times a day (n= 30) and
rain fall gauging. letter in bold indicate to a significant difference (p< 0.05) within rows.
Parameters
Cycles in different weather conditions
Mix cycle Wet cycle Dry cycle
Air temperature (C°) 29.2 ±0.52 a 28.8±0.23 a 30.9±0.38 b
Light intensity (μmolm-²s-1) 349.2±68.1a 452.9±40.6 b 461.1±58.6 b
*Rain fall (mm) 178 ±42.7 384 ±20.4 69.0 ±23.0
* pH of Rain water 6.0 ± 0.31 6.51±0.17 5.67±0.58
* Nitrate (NO3) of Rain water mg/L 0.60± 0.02a 0.27± 0.00b 0.89± 0.01a
Physico-chemical parameters: Water quality parameters in all treatments were
monitored over 10 days for three cycles and showed significant variations among the
variables.Sustainability, Agri, Food and Environmental Research, (ISSN: 0719-3726), 8(X), 2020:
http://dx.doi.org/10.7770/safer-V0N0-art2156
Water temperature changed in the three cycles. There was significant difference in
water temperature between different cycles, and between treatments (p< 0.05), while there
was no significant different within cultivation days. The highest value was 32.7°C recorded
during dry cycle for treatment 1, while the lowest value was 28.1°C also recorded during dry
cycle for treatment 3.
Electric conductivity of the treatments fluctuated within cultivation days. There were
no significant differences within cycles and within treatments, while there were significant
differences within cultivation days. Values of pH in three cycles were continually on the
alkaline side and ranged from 7.2 to 10.05. pH values increased obviously with culture time.
There were significant differences in pH values within treatments and cultivation days (p <
0.05), while there were no significant differences in pH values between cycles.
Dissolved oxygen fluctuated clearly by weather conditions, there was significant differences
between cycles and cultivation days (p < 0.05), while there was no significant difference
between treatments.
There was wide range of difference in light intensity between the shaded and non-
shaded treatments. The range of light intensity in treatment 1 was (377.5 - 781) μmol/m²/s,
in treatment 2 was (406 - 765) μmol/m²/s, in treatment 3 was (56 - 291) μmol/m²/s, in
treatment 4 was (87.5-323) μmol/m²/s respectively. There were significant differences
between treatments (pSustainability, Agri, Food and Environmental Research, (ISSN: 0719-3726), 8(X), 2020:
http://dx.doi.org/10.7770/safer-V0N0-art2156
Total nitrogen decreased gradually in all treatments and in all cycles. The ranged was
between (0.06 – 2.75) mg/L in treatment 1, (0.03 – 1.64) mg/L in treatment 2, (0.08 –
1.72) mg/L in treatment 3, and (0.05 – 1.43) mg/L in treatment 4. There were significant
differences in TN within culture days and within weather conditions (pSustainability, Agri, Food and Environmental Research, (ISSN: 0719-3726), 8(X), 2020:
http://dx.doi.org/10.7770/safer-V0N0-art2156
Figure 2: Growth performance of microalgae in controls and treatments in Mix, Wet and Dry
cycles categorized based on weather conditions.
Microalgae Productivity in (g/L/d)- Microalgae Productivity in (g/L/d) is showen in Table 3.
Table 3: Mean ±SE of Productivity (g/L/d) of mix microalgae in all treatments in different
weather conditions, (n=6), letter in bold indicate to a significant difference (p< 0.05) within
colums.
Culture cycles in different weather conditions
Treatments
Mix cycle Dry cycle Wet get cycle
Treatment 1 1.259±0.06 c 0.690±0.03 a 1.079±0.02 b
Treatment 2 0.855±0.06 ab 0.569 ±0.01 a 0.556±0.01 a
Treatment 3 0.763±0.01 b 0.683±0.06 a 0.603±0.07 a
Treatment 4 0.053±0.02 a 0.557±0.03 a 0.423±0.02 aSustainability, Agri, Food and Environmental Research, (ISSN: 0719-3726), 8(X), 2020:
http://dx.doi.org/10.7770/safer-V0N0-art2156
Primary productivity and carbon fixation: Community respiration, gross production,
net production, CO2 fixation recorded in the 6 th day and the 10th day of each cycle. Primary
production variables were higher in the fertilized non-sheltered mesocosms (treatment 1). In
general, productivity variables were lower in the dry cycle and higher in the mix cycle as can
be seen in Table (4) & Figure (3). The highest value of fixed CO 2 was 3.2 mg/L/d in
treatment 1 in the 6th day of the mix cycle, while the lowest value was 0.11 mg/L/d in
treatment 3 in the 6th day and treatment 2 in the 10th of the dry cycle. There were no
significant differences in CO2 values between treatment 3, treatment 2 & treatment 4, while
treatment 1 was significantly different in CO2 with other treatments. Net production and
gross production were no significantly different between treatment 2, treatment 3 and
treatment 4 (p> 0.05), while treatment 1 was significantly different with other treatments,
also they were no significantly different between mix and wet cycles, while dry cycle was
significantly different with the other cycles (p< 0.05). Community respiration values were
very varied during cultivation days in all cycles. They were lowest in the 10 th day than the 6th
day for each cycle. There was no a significant difference between treatments in community
respiration (p> 0.05), while their values were significantly different between cycles (p<
0.05).
6
6 a b b
5
5 b
4 4
b b
3 b b 3
a
2 c a a
b 2 a b
ab b a a a
1 a a a a a
1 a a a a a
0
MIX WET DRY 0
Cycles in different weather conditions CONTROL1 CONTROL2 TREATMENT 1 TREATMENT2
R GPP NPP CO2 R GPP
Figure 3: Mean ±SE of Community respiration, gross primary production, Net primary
production, and fixed carbon dioxide in different weather conditions. a: between weather
conditions, b: between treatments. Different letters indicated to significant at (p < 0.05).Sustainability, Agri, Food and Environmental Research, (ISSN: 0719-3726), 8(X), 2020:
http://dx.doi.org/10.7770/safer-V0N0-art2156
Table 4: Mean ±SE of Primary productivity parameters for treatments and controls in the 6 th
day and the 10th day of all cycles in different weather conditions.
Parameters Treatments Mix cycle Wet cycle Dry cycle
D6 D10 D6 D10 D6 D10
Community Control 1 2.1±0.8 0.5±0.0 1.0±0.1 0.6±0.1 1.0±0.1 0.4±0.1
respiration
Treatment 1 1.3±0.0 0.5±0.1 0.3±0.0 1.3±0.7 1.1±0.1 0.2±0.0
Control 2 2.0±0.4 0.2±0.1 0.9±0.0 0.2±0.0 0.2±0.0 0.2±0.0
Treatment 2 0.8±0.1 0.7±0.0 1.0±0.1 0.3±0.1 0.5±0.1 0.6±0.2
Gross Control 1 1.8±0.6 1.4±0.5 1.6±0.1 1.9±0.2 1.6±0.0 1.1±0.1
Primary
Treatment 1 8.3±1.0 6.4±1.2 6.5±1.4 5.0±0.3 2.9±0.2 0.9±0.1
Production
Control 2 2.3±0.5 1.2±0.1 2.2±0.1 1.8±0.0 1.5±0.0 0.9±0.1
Treatment 2 1.1±0.1 2.6±0.2 2.3±0.4 2.6±0.2 1.2±0.1 2.0±0.0
Net Control 1 0.7±0.1 1.0±0.4 0.6±0.0 1.3±0.2 0.5±0.1 0.7±0.2
Primary
Treatment 1 7.0±0.9 6.0±1.2 6.1±1.3 3.8±0.9 1.9±0.4 0.8±0.1
Production
Control 2 0.4±0.0 1.0±0.4 1.4±0.1 1.6±0.1 1.3±0.1 0.9±0.1
Treatment 2 0.8±0.0 1.9±0.2 1.3±0.5 2.4±0.3 0.7±0.2 0.5±0.2
Fixed Control 1 0.3±0.0 0.4±0.1 0.2±0.0 0.5±0.1 0.2±0.0 0.3±0.1
carbon
Treatment 1 2.6±0.3 2.2±0.5 1.7±0.5 1.4±0.4 0.7±0.1 0.3±0.0
dioxide
Control 2 0.1±0.0 0.4±0.0 0.5±0.0 0.6±0.0 0.5±0.0 0.3±0.0
Treatment 2 1.1±0.5 0.7±0.1 0.5±0.2 0.9±0.1 0.3±0.1 0.2±0.1
Species composition and cell density: The mix microalgae were not much divers in the
culture. Twenty-six species were recorded in mix cycle, 6 species were dominant, 29 species
were recorded in dry cycle, 8 species were dominant, and 26 species were recorded in wet
cycle, 8 species were dominant. Chlorophyta was the main dominant group during all cycles,
it formed 80%, 83%, and 85% during mix, dry and wet cycles respectively, while Cyanophyta
formed 12%, 10%, and 7.6% during mix, dry and wet cycles respectively. Bacillariophyta
formed only 8%, 6%, and 7.6% during mix, dry and wet cycles respectively. Cell density was
significantly higher during mix cycle (p< 0.05). There was a clear obvious variation of
microalgae population among the different treatments. During mix cycle, MonoraphidiumSustainability, Agri, Food and Environmental Research, (ISSN: 0719-3726), 8(X), 2020:
http://dx.doi.org/10.7770/safer-V0N0-art2156
contortum was the most dominant species with the highest cell densities. It cell density
reached (1224.4 × 103 cell/ L) in treatment 1 (non-sheltered with fertilizer) in the 10 th day of
the mix cycle, on the other hand, its lowest density was (0) recorded at control 2 in the 8 th
day of the same cycle. Chlorella vulgaris (20× 103), Chlamydomonas reinhardtii (18× 103),
Oocystis borgei (17.8× 10³) and Monoraphidium griffithii (12.8× 10³) were the most
dominant with the highest cell densities (cell/L) in treatment 3 in the 10 th day respectively.
Ulothrix aequalis cell density reached to (51 x 103) cell/L in treatment 3 in the 6th day.
During dry cycle, the highest cell density was for Merismopedia punctata (115.5x10³ cell/ L)
in treatment 1 followed by Coelastrum microporum (105x10 3
cell/ L) in treatment 4,
Golenkinia radiata (15.1 x10³ cell/ L) in treatment 1 and Oocystis borgei (11.6 x10³ cell/ L) in
treatment 4 in the 10th day respectively. While the highest density of Monoraphidium griffithii
in the dry cycle was (61.5x 10³) cell/ L in the treatment 1 in the 2nd day and Ulothrix aequalis
(18.75x10³cell/L) in treatment 2 in the D0. During the wet cycle, the highest cell densities
was also for Coelastrum microporum (20.3 x 10³ cell/L) in treatment 1 in the 10th, followed
by Monoraphidium contortum, Scenedesmus quadricauda, Scenedesmus acuminatus, and
Merismopedia punctata.
The highest cell density of Chlamydomonas reinhardatii was generally in the sheltered
mesocosms (Treatment 3 & Treatment 4). The highest cell density was (18 x 10 3) cell/ L in
the treatment 2 in the 10th day of the mix cycle, (13.1x10 3) cell/L in treatment 3 in the 2nd
day of the dry cycle, (7x10³) cell/L in the treatment 4 in the 8th day of the wet cycle. The
highest density of Chlorella vulgaris was (20.4 x10³) in the treatment 3 in the 10th day of the
mix cycle, (19 x 103) cell/L in treatment 3 in the 2 nd day of the dry cycle, and (5.4 x10 3) cell
/L in treatment 1 in the 4th day of the wet cycle. Scenedesmus genus was the more divers
with 8 species. Scenedesmus quadricauda was not abundant during the mix cycle, while it
had high cell density (17.8 x10³) cell/L in treatment 1 in the 4th day of the wet cycle, and
(3.6 x 10³) cell/L in treatment 1 in the 10 th day of the dry cycle. The highest density of
Golenkinia radiata was (15.1 x10³) cell/L in treatment 1 in the 10 th day of the dry cycle, and
(1.8 x 10³) cell/L in treatment 4 in the 10th day of the wet cycle. The highest density of
Oocystis borgei was (17.8 x 10³) cell/L in treatment 3 in the 10 th day of the mix cycle, and
(8.9 x 10³) cell/L in control 1 in the 6th day of the wet cycle.Sustainability, Agri, Food and Environmental Research, (ISSN: 0719-3726), 8(X), 2020:
http://dx.doi.org/10.7770/safer-V0N0-art2156
Table 5: Microalgae species recorded in all mesocosms in different weather conditions.
Division Species order in
Figure 4
Chlorophyta Coelastrum microporum Nägeli 1
Monoraphidium contortum Komárková-Legnerová 2
Monoraphidium griffithii M Komárková-Legnerová 3
Oocystis borgei J.W. Snow 4
Pandorina morum Bory 5
Scenedesmus quadricauda Brébisson 6
Scenedesmus ellipticus Corda 7
Scenedesmus opoliensis P. Richter 8
Scenedesmus dimorphus Kützing 9
Scenedesmus acuminatus Chodat 10
Scenedesmus subspicatus Chodat 11
Chlamydomonas reinhardatii P.A. Dangeard 12
Scenedesmus abundans (O. Kirchner) Chodat 13
Golenkinia radiata Chodat 14
Scenedesmus apiculatus (West & G.S. West) Chodat 15
Pediastrum duplex Meyen 16
Chlorella vulgaris Beyerinck 17
Zosterocarpus oedogonium (Meneghini) Bornet 18
Tetraëdron minimum Hansgirg 19
Ulothrix aequalis Kützing 20
Dictyosphaerium pulchellum H.C. Wood 21
Lagerheimia ciliate Chodat 22
Kirchneriella obesa West & G.S. West 23
Cyanophyta Merismopedia punctata Meyen 24
Microcystis aeruginosa Kützing 25
Chroococcus turgidus Nägeli 26
Bacillariophyta Navicula rhynchocephala Kützing 27
Cyclotella meneghiniana Kützing 28
Synedra ulna (Nitzsch) Ehrenber 29Sustainability, Agri, Food and Environmental Research, (ISSN: 0719-3726), 8(X), 2020:
http://dx.doi.org/10.7770/safer-V0N0-art2156
Figure 4: Microalgae species cultivated in all treatments in different weather conditions. The
scientific names mentioned with their affiliation in (Table 5).
DISCUSSION
During the three outdoor culture cycles, the changes in weather patterns are seen in
the light, temperature and rain fall values in (Table 1). The mass culture of microalgae in
various production systems is primarily concerned with maximising daily yield of microalgal
biomass in the conditions of light limitation. To achieve an ideal condition for microalgae
production, two main aspects are generally considered, the physicochemical environmental
factors such as temperature, light intensity, pH and aeration, and the other is selection of a
suitable nutrient medium (Esra Imamoglu et al., 2007).Sustainability, Agri, Food and Environmental Research, (ISSN: 0719-3726), 8(X), 2020:
http://dx.doi.org/10.7770/safer-V0N0-art2156
Mix microalgae cultures can withstand and tolerate a wide range of variations in
physical and chemical parameters. Dissolved oxygen, light intensity, and temperature are the
factors that can impact microalgae growth and morphological features
(Vamadevaiah, 2010). Light and nutrients are most vital environmental factors that affect
photosynthesis in photosynthetic organisms such microalgae and plants. From this term, the
experiment was designed to test the influence of these parameters on productivity of
microalgae. In case of Malaysia, the daily light intensity fluctuated accordance to the sky
status and weather condition. Light plays an important role in growth rate of microalgae. The
growth rate of microalgae can vary under different light exposures, durations and exposure
frequencies. In non-sheltered mesocosms (Treatment 1& Treatment 2) the growth of
microalgae was better than the sheltered mesocosms (Treatment 3&Treatment 4).
pH is an important factor that effects on microalgal biomass production. pH increased
with increasing of culture growth because photosynthesis can cause pH rising in algal culture
(García et al., 2006). Since the initial pH was around (7.5 to 8.0). Meanwhile, alkaline pH
indicated to higher algal biomass productivity. Microalgae are sensitive to acidic conditions
due to inhibition of cellular enzymes and biological processes in low pH conditions (Skjånes et
al., 2013). Consequently, the optimal pH of most of the algal species has been found in the
range of (7 to 9). In addition, CO 2 fixation depends on pH values, because availability of
bicarbonate and carbonate materials that resulted from CO 2 dissolving in culture water to
microalgal cells depends on the pH of the culture. Increasing pH in treatment 1 and
treatment 3 can be also due to presence of nitrogen sources (Urea) in the medium, because
consumption of nitrate from the medium helps in increase of alkalinity (Horn, 2008).
Majority of microalgae require nitrogen in a soluble form, since urea being the best source
(Bejarano et al., 2011). According to (Boyd &Tucker, 2012), 45% of urea is nitrogen, and 19
– 24 % of triple superphosphate is phosphorus. The augmented amount of nitrogen in the
culture medium leads to increase microalgae growth. Temperature and pH influence
Hydrolysis of urea to ammonia and carbon dioxide in the culture medium. Nutrients uptake
has gone in the opposite direction with increasing of biomass. Nitrogen is most important
nutrient after carbon to microalgae. Nitrogen occurs in several forms, and the most nitrogen
compounds are assimilated by microalgae are ammonium (NH 4+) and nitrate (NO3–) (Oliver &
Ganf, 2000). Optimal phosphorus concentration that is favourable to growth of microalgae is
not less than 0.045mg/L and not higher than 1.65 mg/L according to (Ren, 2014), this
agreed with current result, however, he stated that when TP equals to 0.02mg/L, microalgae
can grow well, but the concentration of phosphorus has no promotion to growth rate of algae
when TP ≥ 0.2mg/L, while (Becker, 1994) stated that the tolerant range of microalgae to
phosphorus is from 0.05 to 20 mg/L. Phosphate (PO-4) is the major required form of
phosphorus by microalgae.Sustainability, Agri, Food and Environmental Research, (ISSN: 0719-3726), 8(X), 2020:
http://dx.doi.org/10.7770/safer-V0N0-art2156
Optimization of mix microalgae biomass production involves an understanding how it
can be affected by various factors individually and also their multiple interactions in the whole
complex process. Growth performance was influenced significantly by the different light
exposition and fertilizer addition. The highest growth rate was in treatment 1 because of the
light availability in comparison with treatment 3.
Microalgae biomass was lower in dry weather conditions because of effect of high air
temperature that was clear especially for non-fertilized treatments (Treatment 2 & Treatment
4). Meanwhile, temperature led to an effect on the physiological characters of microalgae in
the mesocosms because of the small volumes of culture medium. Water temperature
correlated negatively with axis 1 which represented biomass and productivity variables.
Temperature has a strong impact on the cell chemical structure, nutrients and CO2 uptake,
and the growth rates for every species of microalgae. Cell density, pH, and ammonium
(NH4+) concentrations correlated positively with biomass and productivity variables.
Phosphate (PO4-), Nitrate (NO3-), and total phosphorus correlated positively with axis 2 and
negatively with optical density, cell density and dissolved oxygen.
Species existence along an environmental gradient often follows Shelford's law of
tolerance (Braak &Verdonschot, 1995), each species grows in optimal way at a particular
value of environmental parameters and cannot flourish when the value increases or decrease
from this range. So, this limited correlation between the species and the variable is called
species niche, however, some species may prefer extreme environmental conditions or their
optima may fall outside the environmental region.
In the present study, the weather conditions and different treatments (Sheltered &
non- sheltered) significantly influenced microalgae species composition, probably due to the
sensitivity in some of them to different light intensities. Chlorophytes were the most
abundant due to their ability to adapt with different culture conditions.
Species distributed based on their high cell densities in treatments that are located
near them. Some species tended to be most present and abundant the non-sheltered
mesocosms (Treatment 1& Treatment 2), while others leant to be abundant in the sheltered
mesocosms (Treatment 3 & Treatment 4). Chlorophytes have a maximum growth in a wide
range of light intensity from (129 to 773.8 μmolm -²s-1). The Chrysophytes (Navicula
rhynchocephala and Cyclotella meneghiniana) had their optimal growth at light intensity
values 49.50 & 184.6 μmolm-²s-1 respectively. This result agreed with (Fadel et al., 2015),
since diatoms prefer low light intensities. Monoraphidium contortum is commonly found in
meso to eutrophic environment. It was considered by (Bogen et al., 2013) as promising algae
for liquid biofuel production, because of its high biomass productivity. (Latala, 1991) stated
that Monoraphidium griffithii grows best at (150 -270 µE m-2 s-1), same with the current
result, this robust species withstood with medium nature light intensities (152 µE m -2 s -1
).
Chlorella vulgaris is very common in fresh waters, show great adaptability to variousSustainability, Agri, Food and Environmental Research, (ISSN: 0719-3726), 8(X), 2020:
http://dx.doi.org/10.7770/safer-V0N0-art2156
environmental conditions, grow and divided faster when CO 2 and nutrient are available (Singh
&Singh, 2015). It is a commonly cultivated for its high dry weight production and it is
commercially cultivated worldwide for nutritional, cosmetic purposes. Chlamydomonas
reinhardtii can be cultivated photoautotrophicaly and heterotrophically as well (Kliphuis et al.,
2012), in aerobic and anaerobic medium. It has been cultivated worldwide for industrial
purpose specially hydrogen production in anaerobic conditions. Species belonging to the
genus Oocystis are relatively common in different freshwater water bodies and predominant
in small lakes and ponds. (Stoyneva et al., 2007) mentioned that Oocystis sp. contributed
significantly in microalgae biomass in Tanganyika lake. Microcystis aeruginosa was flourished
with high water temperature (30 ºC) and low nutrient concentrations, same findings were
achieved by (Parrish, 2014).
In Conclusion, reduced light intensity may have impacted microalgae populations. The
amount of available light is closely correlated to survival and growth, and too much light can
lead to light inhibition for the surface layer of microalgae. There was a significant decline in
abundance of species cell density, and a corresponding change in species composition in all
treatments during the dry cycle due to the high air temperature during the dry weather
conditions. Mesocosm cultures indicated that some species can adapt well to large scale
production.
ACKNOWLEDGMENTS
The author is very grateful to Dr. Hishamuddin Omar for his valuable comments and
his step by step revision of the manuscript.
REFERENCES
Ademoroti, C. (1996). Standard method for water and effluent analysis, March prints and
Consultancy Foludex press Ltd. Ibadan.
Adio-Moses, R. O., & Aladejana, J. (2016). Assessment of knowledge and awareness of global
warming among inhabitants of industrial areas of an urban community in Nigeria.
International Journal of Business and Economic Development (IJBED), 4(1).
Agrawal, S. (2009). Factors affecting spore germination in algae—review. Folia
microbiologica, 54(4): 273-302.
Becker, E. W. (1994). Microalgae: biotechnology and microbiology (10). Cambridge
University Press.
Bogen, C., Klassen, V., Wichmann, J., La Russa, M., Doebbe, A., Grundmann, M., Mussgnug,
J. H. (2013). Identification of Monoraphidium contortum as a promising species for
liquid biofuel production. Bioresource technology, 133: 622-626.Sustainability, Agri, Food and Environmental Research, (ISSN: 0719-3726), 8(X), 2020:
http://dx.doi.org/10.7770/safer-V0N0-art2156
Borowitzka, M. A., Huisman, J. M., & Osborn, A. (1991). Culture of the astaxanthin-producing
green algaHaematococcus pluvialis 1. Effects of nutrients on growth and cell type.
Journal of Applied Phycology, 3(4): 295-304.
Boyd, C. E., & Tucker, C. S. (2012). Pond aquaculture water quality management: Springer
Science & Business Media.
Brito, D., Castro, A., Guevara, M., Gómez, E., Ramos-Villarroel, A., & Aron, N. M. (2013).
Biomass and pigments production of the mixed culture of microalgae (Hyaloraphidium
contortum and Chlorella vulgaris) by cultivation in media based on commercial fertilizer.
The Annals of the University of Dunarea de Jos of Galati. Fascicle VI. Food Technology,
37(1): 85.
Casal Bejarano, C., Cuaresma Franco, M., Vílchez Lobato, C., & Vega Piqueres, J. M. (2011).
Enhanced productivity of a lutein-enriched novel acidophile microalgae grown on urea.
Choi, H.-J. (2014). Effect of optical panel distance in a photobioreactor for nutrient removal
and cultivation of microalgae. World Journal of Microbiology and Biotechnology, 30(7):
2015-2023.
Costache, T., Fernández, F. G. A., Morales, M., Fernández-Sevilla, J., Stamatin, I., & Molina,
E. (2013). Comprehensive model of microalgae photosynthesis rate as a function of
culture conditions in photobioreactors. Applied microbiology and biotechnology, 97(17):
7627-7637.
Damari, B., Hajian, M., Minaee, F., & Riazi-Isfahani, S. (2016). The Impact of Future World
Events on Iranians’ Social Health: A Qualitative Futurology. Iranian Journal of Public
Health, 45(6): 795.
Danesi, E. D. G., Rangel-Yagui, C. O., Sato, S., & Carvalho, J. C. M. d. (2011). Growth and
content of Spirulina platensis biomass chlorophyll cultivated at different values of light
intensity and temperature using different nitrogen sources. Brazilian Journal of
Microbiology, 42(1): 362-373.
Edler, L., & Elbrächter, M. (2010). The Utermöhl method for quantitative phytoplankton
analysis. Microscopic and molecular methods for quantitative phytoplankton analysis,
110.
Fadel, A., Atoui, A., Lemaire, B. J., Vinçon-Leite, B., & Slim, K. (2015). Environmental factors
associated with phytoplankton succession in a Mediterranean reservoir with a highly
fluctuating water level. Environmental Monitoring and Assessment, 187(10): 633.
Fagiri, Y. M. A., Salleh, A., & El-Nagerabi, S. A. F. (2013). Impact of physico-chemical
parameters on the physiological growth of Arthrospira (Spirulina platensis) exogenous
strain UTEXLB2340. African Journal of Biotechnology, 12(35).
Farrelly, D. J., Everard, C. D., Fagan, C. C., & McDonnell, K. P. (2013). Carbon sequestration
and the role of biological carbon mitigation: a review. Renewable and sustainable
energy reviews, 21: 712-727.Sustainability, Agri, Food and Environmental Research, (ISSN: 0719-3726), 8(X), 2020:
http://dx.doi.org/10.7770/safer-V0N0-art2156
Fernández, F. G. A., González-López, C., Sevilla, J. F., & Grima, E. M. (2012). Conversion of
CO2 into biomass by microalgae: how realistic a contribution may it be to significant
CO2 removal? Applied microbiology and biotechnology, 96(3): 577-586.
García, J., Green, B., Lundquist, T., Mujeriego, R., Hernández-Mariné, M., & Oswald, W.
(2006). Long term diurnal variations in contaminant removal in high rate ponds treating
urban wastewater. Bioresource technology, 97(14): 1709-1715.
Goldstein, M. (2002). The complete idiot's guide to weather: Penguin.
Harun, S., Dambul, R., Abdullah, M. H., & Mohamed, M. (2014). Spatial and seasonal
variations in surface water quality of the Lower Kinabatangan River Catchment, Sabah,
Malaysia. Journal of Tropical Biology & Conservation (JTBC), 11.
He, Q., Bertness, M. D., & Altieri, A. H. (2013). Global shifts towards positive species
interactions with increasing environmental stress. Ecology letters, 16(5): 695-706.
Hernando, M., Schloss, I., Roy, S., & Ferreyra, G. (2006). Photoacclimation to Long‐Term
Ultraviolet Radiation Exposure of Natural Sub‐Antarctic Phytoplankton Communities:
Fixed Surface Incubations Versus Mixed Mesocosms. Photochemistry and photobiology,
82(4): 923-935.
Horn, K. J. (2008). The effect of nitrates, pH, and dissolved inorganic carbon concentrations
on the extracellular polysaccharide of three strains of cyanobacteria belonging to the
family Nostocaceae. Virginia Tech.
Hötzel, G., & Croome, R. (1999). A phytoplankton methods manual for Australian
freshwaters.
Imamoglu, E., Sukan, F. V., & Dalay, M. C. (2007). Effect of different culture media and light
intensities on growth of Haematococcus pluvialis. International journal of natural and
engineering sciences, 1(3): 5-9.
Jeffrey, S. t., & Humphrey, G. (1975). New spectrophotometric equations for determining
chlorophylls a, b, c1 and c2 in higher plants, algae and natural phytoplankton. Biochem
Physiol Pflanz BPP.
Khalili, A., Najafpour, G. D., Amini, G., & Samkhaniyani, F. (2015). Influence of nutrients and
LED light intensities on biomass production of microalgae Chlorella vulgaris.
Biotechnology and Bioprocess Engineering, 20(2): 284-290.
Kim, H.-C., Choi, W. J., Ryu, J. H., Maeng, S. K., Kim, H. S., Lee, B.-C., & Song, K. G.
(2014). Optimizing cultivation strategies for robust algal growth and consequent
removal of inorganic nutrients in pretreated livestock effluent. Applied Biochemistry and
Biotechnology, 174(4): 1668-1682.
Kitamura, H., Ishitani, H., Kuge, Y., & Nakamoto, M. (1982). Determination of nitrate in
freshwater and seawater by a hydrazine reduction method. Japan Journal of Water
Pollution Research, 5: 35-42.Sustainability, Agri, Food and Environmental Research, (ISSN: 0719-3726), 8(X), 2020:
http://dx.doi.org/10.7770/safer-V0N0-art2156
Kliphuis, A. M., Klok, A. J., Martens, D. E., Lamers, P. P., Janssen, M., & Wijffels, R. H.
(2012). Metabolic modeling of Chlamydomonas reinhardtii: energy requirements for
photoautotrophic growth and maintenance. Journal of Applied Phycology, 24(2): 253-
266.
Latala, A. (1991). Effects of salinity, temperature and light on the growth and morphology of
green planktonic algae. Oceanologia(31).
Ma, Z., & Gao, K. (2014). Carbon limitation enhances CO2 concentrating mechanism but
reduces trichome size in Arthrospira platensis (cyanobacterium). Journal of Applied
Phycology, 26(3): 1465-1472.
Murray, C. J., & Lopez, A. D. (2013). Measuring the global burden of disease. New England
Journal of Medicine, 369(5): 448-457.
Oliver, R. L., & Ganf, G. G. (2000). Freshwater blooms: The ecology of cyanobacteria.
Springer, pp. 149-194.
Parrish, J. (2014). The Role of Nitrogen and Phosphorus in the Growth, Toxicity, and
Distribution of the Toxic Cyanobacteria, Microcystis aeruginosa. Master's Projects and
Capstones, University of San Francisco.
Parsons, T., Malta, Y., & Lalli, C. (1984). A Manual of Chemical and Biological Methods for
Seawater Analysis. Pergamon Press, New York.
Petersen, J. E., Chen, C.-C., & Kemp, W. M. (1997). Scaling Aquatic Primary Productivity:
Experiments Under Nutrient‐and Light‐Limited Conditions. Ecology, 78(8): 2326-2338.
Procházková, G., Brányiková, I., Zachleder, V., & Brányik, T. (2014). Effect of nutrient supply
status on biomass composition of eukaryotic green microalgae. Journal of Applied
Phycology, 26(3): 1359-1377.
Ras, M., Steyer, J.-P., & Bernard, O. (2013). Temperature effect on microalgae: a crucial
factor for outdoor production. Reviews in Environmental Science and Bio/Technology,
12(2): 153-164.
Razzak, S. A., Ilyas, M., Ali, S. A. M., & Hossain, M. M. (2015). Effects of CO2 concentration
and pH on mixotrophic growth of Nannochloropsis oculata. Applied Biochemistry and
Biotechnology, 176(5): 1290-1302.
Ren, T. (2014). Primary factors affecting growth of microalgae optimal light exposure
duration and frequency. Citeseer.
Saharan, B. S., Sharma, D., Sahu, R., Sahin, O., & Warren, A. (2013). Towards algal biofuel
production: a concept of green bio energy development. Innovative Romanian Food
Biotechnology, 12: 1.
Shen, Y., Xu, X., Zhao, Y., & Lin, X. (2014). Influence of algae species, substrata and culture
conditions on attached microalgal culture. Bioprocess and biosystems engineering,
37(3): 441-450.Sustainability, Agri, Food and Environmental Research, (ISSN: 0719-3726), 8(X), 2020:
http://dx.doi.org/10.7770/safer-V0N0-art2156
Singh, S., & Singh, P. (2015). Effect of temperature and light on the growth of algae species:
a review. Renewable and sustainable energy reviews, 50:431-444.
Singh, U. B., & Ahluwalia, A. (2013). Microalgae: a promising tool for carbon sequestration.
Mitigation and Adaptation Strategies for Global Change, 18(1): 73-95.
Skjånes, K., Rebours, C., & Lindblad, P. (2013). Potential for green microalgae to produce
hydrogen, pharmaceuticals and other high value products in a combined process.
Critical reviews in biotechnology, 33(2):172-215.
Snoeyink, V., & Jenkins, D. (1980). Precipitation and dissolution. Water chemistry, John
Wiley & Sons, New York, 243-315.
Sommer, U. (2009). Copepod growth and diatoms: insensitivity of Acartia tonsa to the
composition of semi-natural plankton mixtures manipulated by silicon: nitrogen ratios in
mesocosms. Oecologia, 159(1): 207-215.
Stoyneva, M., Cocquyt, C., Gärtner, G., & Vyverman, W. (2007). Oocystis lacustris
CHOD.(Chlorophyta, Trebouxiophyceae) in Lake Tanganyika (Africa). Linzer. Biol. Beitr,
39: 571-632.
Sutherland, D. L., Montemezzani, V., Mehrabadi, A., & Craggs, R. J. (2016). Winter-time CO
2 addition in high rate algal mesocosms for enhanced microalgal performance. Water
research, 89: 301-308.
Ter Braak, C. J., & Verdonschot, P. F. (1995). Canonical correspondence analysis and related
multivariate methods in aquatic ecology. Aquatic sciences, 57(3): 255-289.
Vamadevaiah, H. (2010). In Vitro Screening for Salt Tolerance in Cotton. UAS, Dharwad.
Vidoudez, C., Nejstgaard, J. C., Jakobsen, H. H., & Pohnert, G. (2011). Dynamics of dissolved
and particulate polyunsaturated aldehydes in mesocosms inoculated with different
densities of the diatom Skeletonema marinoi. Marine drugs, 9(3): 345-358.
Weatherburn, M. (1967). Phenol-hypochlorite reaction for determination of ammonia.
Analytical chemistry, 39(8): 971-974.
Wu, X. D., Liu, Y. H., Ruan, R. S., Wan, Y. Q., Zhang, J. S., & Peng, H. (2012). Prospect
analysis of the coupling system of low-quality biomass treatment and microalgae biofuel
production. Paper presented at the Applied Mechanics and Materials.
Yu, J., Wang, C., Su, Z., Xiong, P., & Liu, J. (2014). Response of Microalgae Growth and Cell
Characteristics to Various Temperatures. Asian Journal of Chemistry, 26(11): 3366.
Received: 23th March 2020; Accepted: 17th June 2020; First published: 17th
September 2020You can also read