LCK as a Potential Therapeutic Target for Acute Rejection after Kidney Transplantation: A Bioinformatics Clue
←
→
Page content transcription
If your browser does not render page correctly, please read the page content below
Hindawi
Journal of Immunology Research
Volume 2018, Article ID 6451298, 9 pages
https://doi.org/10.1155/2018/6451298

Research Article
LCK as a Potential Therapeutic Target for Acute Rejection after
Kidney Transplantation: A Bioinformatics Clue

          Linpei Jia ,1 Rufu Jia ,2 Yinping Li,1 Xiaoxia Li,1 Qiang Jia,1 and Hongliang Zhang                                          3

          1
            Department of Nephrology, Xuanwu Hospital of Capital Medical University, Changchun Street 45#, Beijing 100053, China
          2
            Central Hospital of Cangzhou, Xinhua Middle Street 201#, Cangzhou, Hebei Province 061001, China
          3
            Department of Life Sciences, The National Natural Science Foundation of China, Shuangqing Road 83#, Beijing 100085, China

          Correspondence should be addressed to Linpei Jia; anny_069@163.com, Rufu Jia; zxyy5688@126.com,
          and Hongliang Zhang; drzhl@hotmail.com

          Received 22 November 2017; Revised 12 March 2018; Accepted 10 April 2018; Published 7 June 2018

          Academic Editor: Nejat K. Egilmez

          Copyright © 2018 Linpei Jia et al. This is an open access article distributed under the Creative Commons Attribution License, which
          permits unrestricted use, distribution, and reproduction in any medium, provided the original work is properly cited.

          Objectives. We aim to identify the key biomarker of acute rejection (AR) after kidney transplantation via bioinformatics methods.
          Methods. The gene expression data GSE75693 of 30 samples with stable kidney transplantation recipients and 15 AR samples were
          downloaded and analyzed by the limma package to identify differentially expressed genes (DEGs). Then, Gene Ontology (GO)
          functional enrichment analysis and Kyoto Encyclopedia of Genes and Genomes (KEGG) pathway analysis were done to explore
          the biological functions and potential important pathways of DEGs. Finally, protein-protein interactions (PPIs) and literature
          mining were applied to construct the cocitation network and to select the hub protein. Results. A total of 437 upregulated genes
          and 353 downregulated genes were selected according to P < 0 01 and log2 f old change > 1 0. DEGs of AR are mainly located
          on membranes and impact the activation of receptors in immune responses. In the PPI network, Src kinase, lymphocyte kinase
          (LCK), CD3G, B2M, interferon-γ, CD3D, tumor necrosis factor, VAV1, and CD3E in the T cell receptor signaling pathway were
          selected as important factors, and LCK was identified as the hub protein. Conclusion. LCK, via acting on T-cell receptor, might
          be a potential therapeutic target for AR after kidney transplantation.

1. Introduction                                                         local cytokine release are two possible causes [6]. By contrast,
                                                                        AMR is caused by circulating antibodies of recipients, which
Kidney transplantation is widely accepted as a standard                 are mainly antibodies against donor human leukocyte
life-saving therapy for end-stage chronic kidney disease [1].           antigen (HLA). Then T helper (Th) cell and macrophages
Frequently as the last resort, kidney transplantation may               participate in the immune response to clear allogenic cells
prolong patients’ survival and improve their life quality [2].          and to assist differentiation of B cells [7]. Thus, T cells
Immunosuppressants are routinely prescribed to recipients               play important roles in both TCMR and AMR.
to promote graft survival after transplantation [3]. Despite                Once AR occurs, a short course of intensive immunomo-
the standard use of immunosuppressants, however, acute                  dulation is needed. Pulse steroid therapy, alteration of immu-
rejection (AR) is sometimes inevitable, which usually occurs            nosuppressants, monoclonal antibodies and combinations
days to months after transplantation [4]. The short- and                thereof are common therapies for AR [8]. Among others, a
long-term impacts of AR on graft loss and even morbidity                high dose of steroids and immunosuppressants might lead
have been extensively studied [5].                                      to a high risk of infection and other side effects [9]. In recent
     According to the distinct key players in the pathogenesis,         decades, monoclonal antibodies, such as antilymphocyte
AR is classified into two types, i.e., acute T cell-mediated             globulin, antithymocyte globulin, and T10B9, an monoclonal
rejection (TCMR) and acute antibody-mediated rejection                  antibody against the T cell receptor (TCR) [10], have been
(AMR). Although the precise mechanism of TCMR is still                  applied to deal with AR [9]. However, side effects such as
unclear, cell-mediated cytotoxicity of parenchymal cells and            infection and tumorigenesis may still occur occasionally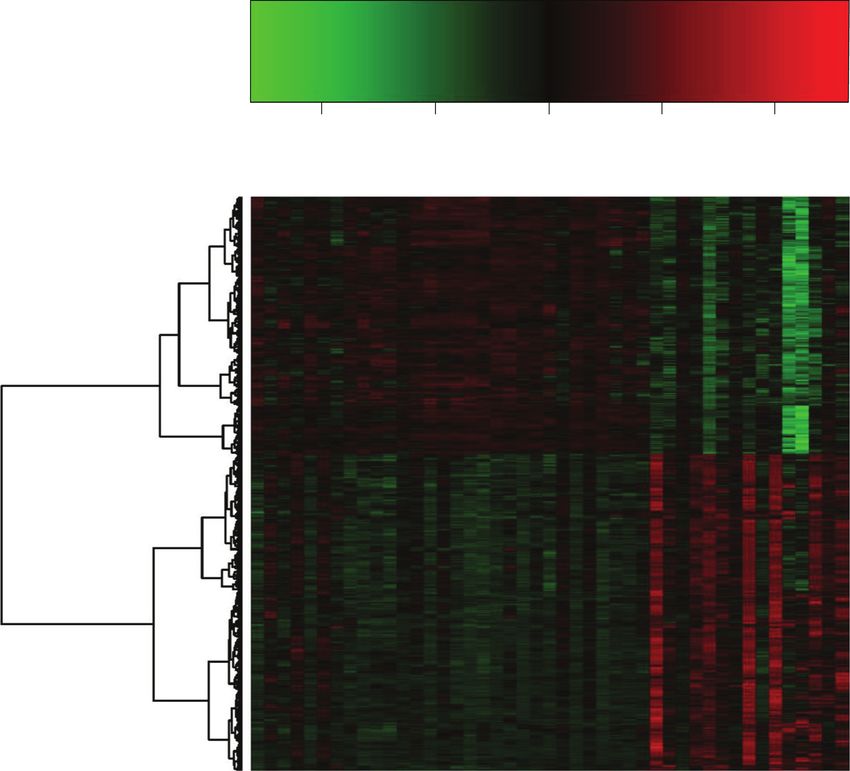
2                                                                                                Journal of Immunology Research

[11]. Webster et al. compared the efficacy between monoclo-            model was used to compare gene expression differences
nal antibodies and steroids; they found that monoclonal anti-        between the two groups. P values were calculated by the
bodies appeared better than steroids for reversing first acute        Bayesian t-test and adjusted by false discovery rate. DEGs
cellular rejection and preventing graft loss, but there was little   were selected based on the threshold P < 0 01 and log2
or no difference in subsequent rejection and the survival rate         f old change > 1 0 [17]. The P value herein was used to
[9]. Thus, further insight into the mechanism of AR and              test if the gene was differentially expressed between the AR
identification of the key step in the pathogenesis may shed           and the stable groups with the f old change > 2 0.
light on the discovery of therapeutic targets for AR [12].
    Gene expression analysis by bioinformatics methods has           2.3. Enrichment Analysis of DEGs. By Gene Ontology (GO)
been widely used in genomics and biomedical studies, which           and the Kyoto Encyclopedia of Genes and Genomes (KEGG)
helps clarify the molecular events underlying human biology          in DEG enrichment analysis, we further investigated the
and diseases [13]. Data mining of the available microarray           potential mechanisms of AR. GO annotated genes by a
could help narrow down the study scope so as to find                  defined, structured, and controlled vocabulary [18], including
research gaps [14]. In this study, we analyzed the public            molecular function (MF), biological process (BP), and
microarray data by using bioinformatics methods, including           cellular components (CC), while KEGG assigns DEGs to
differentially expressed genes (DEGs) analysis, gene enrich-          specific pathways [19]. GO and KEGG can be performed in
ment methods, protein-protein interaction (PPI) analysis,            website of Database for Annotation, Visualization and Inte-
and literature miming, in order to identify the key factors          grated Discovery (DAVID, http://david.abcc.ncifcrf.gov/).
of AR in kidney transplantation recipients and to provide            The potential GO annotation and pathways were selected
new insights into the treatment of AR.                               based on P < 0 01 and count ≥ 5 [20].

2. Materials and Methods                                             2.4. PPI Network Construction. Connections and interaction
                                                                     networks of DEGs mean PPI. We uploaded the DEGs into
2.1. Affymetrix Microarray Data and Sample Selection. First,
                                                                     the website of STRING (Search Tool for the Retrieval of Inter-
we downloaded the microarray dataset GSE75693 from the
                                                                     acting Genes/Proteins, http://string-db.org/), which is the web
public Gene Expression Omnibus (GEO) database (http://
                                                                     source of biological database. According to the official expla-
www.ncbi.nlm.nih.gov/geo/). The dataset GSE75693 consists
                                                                     nation of STRING, the confidence score is the approximate
of the gene expression information of kidney biopsies from
                                                                     probability that a predicted link exists between two proteins
30 stable renal allograft recipients, 15 patients with AR, 15
                                                                     in the same metabolic map in the KEGG database (Getting
with BK virus nephropathy, and 12 with chronic allograft
                                                                     Started in https://string-db.org/cgi/help.pl). Thus, PPIs of
nephropathy. All subjects were pediatric and young adult
                                                                     DEGs were selected with the threshold of score high con
recipients who received transplantation between 2000 and
                                                                     f idence > 0 7 [20]. Then the analysis results were down-
2011 at the Lucile Packard Children’s Hospital of Stanford
                                                                     loaded and modified by Cytoscape (http://www.cytoscape.
University [15]. AR was defined at minimum, as per Banff
                                                                     org/). The proteins with higher degrees of interaction were
schema, a tubulitis score ≥ 1 accompanied with an interstitial
                                                                     considered as hub proteins [19].
inflammation score ≥ 1. Normal allografts were considered
as an absence of significant injury pathology of Banff schema
[15]. Data of the 30 stable renal allograft recipients and the 15    2.5. Literature Mining. According to the analysis of STRING,
patients with AR were used to investigate the potential mech-        hot proteins in the PPI were put into GenCLiP 2.0 (http://ci.
anism of AR. In the original study, AR patients were diag-           smu.edu.cn/GenCLiP2.0/confirm_keywords.php), which is
nosed by professional pathologists and scored by the Banff            an online tool for literature mining of gene functions. In
and Chronic Allograft Damage Index as acute cellular or              the website, biological keywords of hot proteins in previous
humoral rejection with clinical graft dysfunction and tubuli-        literature database were analyzed by Gene Cluster with the
tis and/or vasculitis on histology [15]. Stable renal transplant     Literature Profiles module with the threshold of P ≤ 1 ×
recipients were diagnosed as stable without histological or          10−6 and hits ≥ 6 [19]. And the Literature Mining Gene
clinical graft injury [15].                                          Networks module was used to show the cocitation network
     The array data were based on the platform of GPL570             of hot proteins. After combining the results of literature
Affymetrix Human Gene U133 Plus 2.0 Array (Affymetrix                  mining and KEGG analysis, the primary pathways in AR
Inc., Santa Clara, CA, USA). The raw data were preprocessed          were determined.
by Robust Multiarray Average [16] algorithmin affy package
of Bioconductor (http://www.bioconductor.org/), including            2.6. Hub Protein Selection by CytoNCA. In Cytoscape, the
background correction, normalization, and calculation of             separated proteins from the network were removed. All
gene expressions.                                                    nodes in PPIs were analyzed by CytoNCA. According to
                                                                     degree centrality, betweenness centrality, and subgraph cen-
2.2. DEG Analysis. We used the limma package of Biocon-              trality [16], the hub protein, which interacts most frequently
ductor to analyze DEGs between BKVN and nonallograft                 with other proteins and works like a hub in the network, was
injury patients in R project (Supplementary 1). Linear               selected. Finally, proteins associated with hub proteins at de
models were constructed for gene expression data of AR               gree ≥ 20 were selected to construct the significant network
and stable renal allograft samples, respectively. The contrast       about the mechanism of AR [21].
Journal of Immunology Research                                                                                                     3

                                                                                Color key

                                                 −4                                 0               2                4
                                                                              Row Z-score

                                         Stable_1
                                         Stable_2
                                         Stable_3
                                         Stable_4
                                         Stable_5
                                         Stable_6
                                         Stable_7
                                         Stable_8
                                         Stable_9
                                        Stable_10
                                        Stable_11
                                        Stable_12
                                        Stable_13
                                        Stable_14
                                        Stable_15
                                        Stable_16
                                        Stable_17
                                        Stable_18
                                        Stable_19
                                        Stable_20
                                        Stable_21
                                        Stable_22
                                        Stable_23
                                        Stable_24
                                        Stable_25
                                        Stable_26
                                        Stable_27
                                        Stable_28
                                        Stable_29
                                        Stable_30
                                            AR_1
                                            AR_2
                                            AR_3
                                            AR_4
                                            AR_5
                                            AR_6
                                            AR_7
                                            AR_8
                                            AR_9
                                           AR_10
                                           AR_11
                                           AR_12
                                           AR_13
                                           AR_14
                                           AR_15

Figure 1: Heat map of differentially expressed genes. The row means a gene, and the column means a sample. Samples of stable allograft
recipient are presented as the yellow bar, and samples of acute rejection (AR) patients are presented as the blue bar. Downregulated
genes are shown in color green, while upregulated ones are in red. No difference expressed genes between AR and stable allograft
patients are in black.

3. Results                                                          downregulated genes. The hierarchical cluster analysis was
                                                                    done to show the distribution of DEGs (Figure 1).
3.1. Seven Hundred and Ninety DEGs Were Identified. Micro-
array data in the GSE75693 dataset were downloaded for              3.2. DEGs of AR Mainly Enriched in the Cell Receptor
further analysis. DEGs of AR were identified by the limma            Functions. For further analyzing biological functions of
package following the process of linear model, contrast             DEGs, we uploaded DEGs in DAVID. GO and pathway
model, and DEGs selection. Compared with no-allograft               terms were selected. In MF ontology, DEGs mainly enriched
injury patients, 790 genes are expressed differentially in           in 27 categories (Supplementary 2, Figure 2(a)) including the
AR patients based on the criteria of P < 0 01 and log2 f old        protein homodimerization activity (53 genes), receptor bind-
change > 1 0, including 437 upregulated genes and 353               ing (26 genes), and receptor activity (26 genes). In BP
4 Journal of Immunology Research
negLog10_PValue negLog10_PValue
GO:0042803~protein homodimerization activity 9 GO:0006954~inflammatory response
GO:0004872~receptor activity GO:0045087~innate immune response 25
Count
GO:0030246~carbohydrate binding 10 GO:0050776~regulation of immune response
8
GO:0004888~transmembrane signaling receptor activity 20 GO:0002250~adaptive immune response
GO:0004252~serine~type endopeptidase activity 30 GO:0007166~cell surface receptor signaling pathway 30
GO:0003823~antigen binding 40 7 GO:0006935~chemotaxis
GO:0008201~heparin binding 50 GO:0050853~B cell receptor signaling pathway
GO:0046934~phosphatidylinositol-4,5-bisphosphate 3-kinase
GO:0006968~cellular defense response 20
activity
6 GO:0070098~chemokine~mediated signaling pathway
GO:0008009~chemokine activity
Count
GO:0034987~immunoglobulin receptor binding GO:0031295~T cell costimulation
20
GO:0015026~coreceptor activity GO:0006955~immune response 40 15
5
GO:0004896~cytokine receptor activity GO:0042110~T cell activation 60
GO:0042288~MHC class I protein binding GO:0006911~phagocytosis, engulfment 80
GO:0019864~IgG binding 4 GO:0007588~excretion 10
GO:0016175~superoxide-generating NADPH oxidase activity GO:0006910~phagocytosis, recognition
2 4 6 2.5 5.0 7.5 10.0
(a) (b)
negLog10_PValue negLog10_PValue
GO:0009897~external side of plasma membrane hsa04060:Cytokine-cytokine receptor interaction 13
GO:0009986~cell surface hsa04062:Chemokine signaling pathway
GO:0016021~integral component of membrane hsa04650:Natural killer cell mediated cytotoxicity
Count
GO:0005886~plasma membrane Count hsa04514:Cell adhesion molecules (CAMs) 20
100 11
GO:0070062~extracellular exosome hsa04380:Osteoclast differentiation 30
200
GO:0072562~blood microparticle 20 hsa04145:Phagosome 40
GO:0005764~lysosome hsa04640:Hematopoietic cell lineage
GO:0016020~membrane hsa04660:T cell receptor signaling pathway 9
GO:0005887~integral component of plasma membrane hsa04620:Toll-like receptor signaling pathway
GO:0005576~extracellular region hsa04612:Antigen processing and presentation
GO:0005615~extracellular space hsa05150:Staphylococcus aureus infection
10 7
GO:0001772~immunological synapse hsa05340:Primary immunodeficiency
GO:0042101~T cell receptor complex hsa05332:Graft-versus-host disease
GO:0042571~immunoglobulin complex, circulating hsa05330:Allograft rejection
GO:0043020~NADPH oxidase complex hsa04960:Aldosterone-regulated sodium reabsorption
5
0 10 20 30 2 3 4 5
(c) (d)
Figure 2: Bubble charts of top 15 gene enrichment results in each category. Gene counts and P values of top 15 enrichment terms in molecular
function (MF), biological process (BP), cellular component (CC), and pathway analysis were shown in bubble charts. Gene counts in each
term were displayed as the size of bubbles. Larger in size means larger numbers of genes in this term. The gradual color from red to green
shows the changes of P values from low to high. (a) Results of MF analysis. Most of DEGs clustered in protein homodimerization activity,
while the antigen binding has the greatest statistical significance. (b) Results of BP analysis. The immune response presented the less P
value and the maximum of genes. (c) Results of CC analysis. Most of DEGs located on integral component of membrane, while the
external side of plasma membrane showed the greatest significance in statistics. (d) Results of pathway analysis. Both the maximum of
gene counts and lowest P value appeared in the category of cytokine-cytokine receptor interaction.
ontology, 94 terms were identified, and the majority of DEGs. The presenting data demonstrate that DEGs of AR
enriched categories are the immune response (83 genes), sig- are most likely to be receptors or molecules interacting with
nal transduction (81 genes), and the inflammatory response receptors on the membrane to participate in a variety of
(57 genes), which focused on the immune process (Supple- immune responses.
mentary 3, Figure 2(b)). Distribution of DEGs on cells was
shown in CC ontology. Proteins of DEGs were mostly located 3.3. TCR Signaling Transduction Is the Main Pathway in the
on membranes of cell or organelles, including integral com- Pathogenesis of AR. At first, 790 DEGs were uploaded in
ponent of membranes (275 genes) and plasma membranes STRING website. Then 254 genes with score > 0 7 (high con-
(263 genes) (Supplementary 4, Figure 2(c)). Other important fidence) were selected to construct the PPI network by Cytos-
CC categories are the extracellular exosome (182 genes), cape (Figure 3). Top eight hot genes, including LCK, CD3G,
extracellular region (102 genes), and the extracellular space B2M, IFNG, CD3D, TNF, VAV1, and CD3E, were put into
(83 genes). In KEGG analysis, 23 potential pathways in AR GenCLiP 2.0 for analysis of Gene Cluster with Literature Pro-
are shown in Supplementary 5 and Figure 2(d). DEGs clus- files and Literature Mining Gene Networks. Results of gene
tered in pathways of cytokine-cytokine receptor interaction clustering indicated that keywords of hot genes reported in
(43 genes), chemokine signaling (31 genes), cell adhesion literature were immune response, cell activation, cell differ-
molecules (25 genes), and natural killer cell-mediated cyto- entiation, cell surface, T-cell activation, signal transduction,
toxicity (25 genes). and plasma membrane (Figure 4(a)). Information of the
Enrichment analysis gives us a hint to infer the potential cocitation network was shown in Figure 4(b) and Table 1.
biological functions, locations, and participated pathways of LCK and VAV1 work as links between CD3E and IFNG.
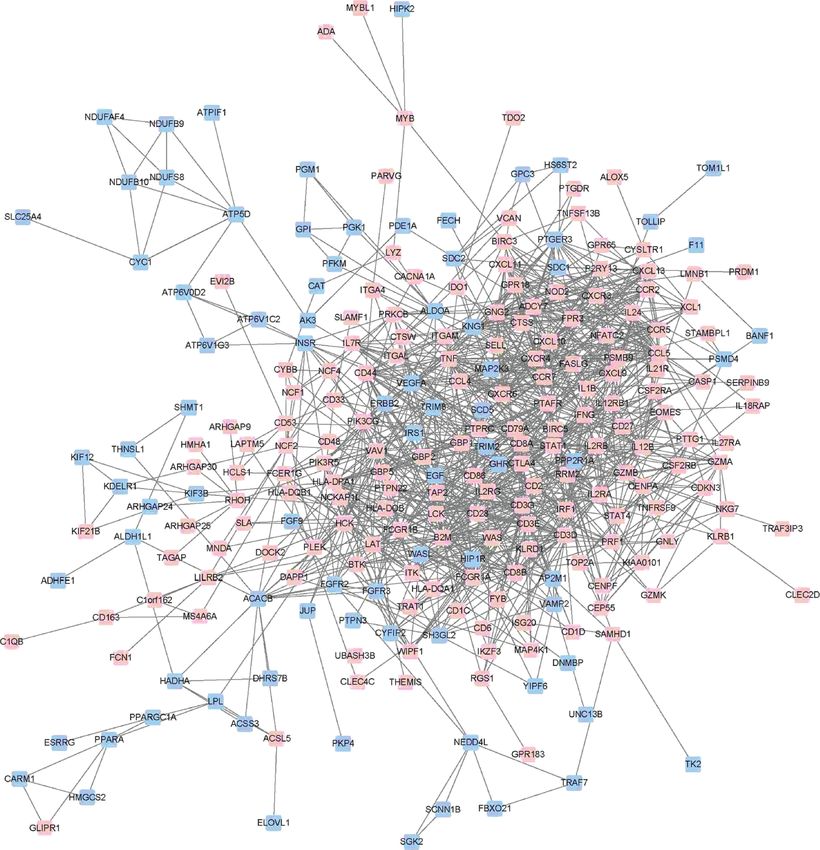
Journal of Immunology Research                                                                                                          5

Figure 3: Protein-protein interaction network constructed with differentially expressed genes. Upregulated genes in AR were colored in red,
while downregulated genes were in blue. A total of 254 DEGs were selected in the protein-protein interaction network, and DEGs were mainly
focused on immune process.

Combined with pathway analyses, 7 hot genes, except for                proteins are CD3G and IFNG. Hub nodes and proteins
B2M, participate in the TCR signaling pathway, and LCK,                directly associated with hubs constructed an interaction
VAV1, IFNG, and TNF participate in the natural killer cell-            network (Figure 5), including 27 upregulated and 1 down-
mediated cytotoxicity pathway.                                         regulated proteins. EGF is the only downregulated protein
                                                                       in the final network.
3.4. LCK Is the Key Factor in AR. Each DEG was evaluated
according to degree centrality, betweenness centrality, and            4. Discussion
subgraph centrality, respectively, in CytoNCA (Table 2).
LCK ranked top 5 in all centralities indicating the important          In the present study, we aimed at investigating potential
role of LCK in the pathogenesis of AR. The other hub                   therapeutic targets for AR after kidney transplantation. First,
6                                                                                                               Journal of Immunology Research

                                                                                         CD3G 120 CD3D

                                                                                               90         96

                                                                                                CD3E

                                                                                                    24

                                   Lymphocyte proliferation

                                   Protein tyrosine kinase
                                   Lymphocyte activation
                                   Intracellular transport
                                   Interleukin 2 receptor
                                                                                                    LCK

                                   T cell differentation
                                   Signal transduction

                                   T cell proliferation
                                   Plasma membrane
                                   Cell differentation

                                   Receptor complex
                                   Immune response
                                   Cell development
                                   Antigen binding

                                   Cell recognition

                                   Immune system
                                   T cell activation
                                   Peptide binding

                                   Cell activation
                                                                                                     46

                                   Cell surface
                                                                                                    VAV1

                                                                                                         6
                                                                               VAV1
                                                                               CD3E
                                                                               CD3G                  IFNG
                                                                               CD3D                             81
                                                                               B2M           13490
                                                                               LCK                                   B2M
                                                                               IFNG      TNF
                                                                               TNF
                                                       (a)                                                (b)

Figure 4: Literature mining results of top 8 differentially expressed proteins in degree. (a) Clustering analysis of LCK, CD3G, B2M, IFNG,
CD3D, TNF, VAV1, and CD3E in previous studies. In the heat map, each row represents a gene, and each column represents a biological
keyword. The color black means that the keyword has not been reported in this gene, and the color light green means that this keyword is
related to this gene. Hot genes are mainly clustered in immune response, cell activation, cell differentiation, cell surface, T-cell activation,
signal transduction, and plasma membrane. (b) Cocitation network of hot genes. In the cocitation network, all of the 8 genes were closely
interacted. The numbers noted on the line indicate the number of studies cocited.

                                                                          mechanism of AR was primarily focused on immune process,
       Table 1: Hub genes identified by literature mining.
                                                                          and this finding is consistent with previous studies [6, 23].
Gene           Cogenes (n)         Cocitations (n)           Total (n)    Then the CC ontology indicated that most of DEGs were
                                                                          membrane structures, such as proteins on integral compo-
IFNG                3                  13,563                 68,347
                                                                          nent of membrane and plasma membrane. Based on previous
CD3E                3                   141                     745       studies, AR may be mediated by cellular and/or humoral
VAV1                2                    52                     822       mechanisms [7]. Approximately 90% of AR is TCMR, which
LCK                 2                    68                    2195       involves CD4+ and CD8+ T cells by activating perforin/gran-
CD3G                2                   145                     327       zyme degranulation pathways [24]. Regardless of the recog-
CD3D                2                   151                     278       nition of antigens in TCMR and AMR or the release of
TNF                 1                  13,490                 91,108      accessory molecules, such as cytokines, signaling molecules,
                                                                          and adhesion molecules, receptors on membrane play impor-
B2M                 1                    81                    6479
                                                                          tant roles [25]. Meanwhile, we also found that a majority of
                                                                          DEGs were involved in protein homodimerization in MF
437 upregulated genes and 353 downregulated genes were                    ontology. This indicated that protein homodimerization
selected as DEGs of AR compared with nonrejection recipi-                 activity is the main structure transformation and activation
ents. According to gene enrichment, DEGs of AR are mainly                 of receptors [26] implicated in the antigen recognition and
located on membranes and participate in the TCR signaling                 signaling transduction pathway in AR.
pathway. We identified LCK as the potential key factor in                       In the cocitation network, CD3D, CD3E, and CD3G,
the pathogenesis of AR.                                                   which are compositions of CD3 complex of TCR, interacted
    By GO annotation in DAVID, we further explored the                    with each other to affect the assembly of TCR membrane
biological functions of DEGs. The results of functional anno-             complex and disturb T-cell responsiveness [27], especially
tations helped us infer the possible effects of DEGs on how                CD3E [28]. After TCR engagement, the phosphorylation of
AR occurs. According to results of BP, CC, and MF ontol-                  CD3 immunoreceptor tyrosine-based activation motifs of
ogies, the majority of DEGs were enriched in functions of                 CD3E in CD3 complex is combined with activated LCK,
membrane receptors in the immune process. AR in kidney                    which is also called Src kinase lymphocyte kinase [29]. LCK
transplantation is generally considered as an alloimmune                  is a member of protein tyrosine kinase involved in TCR sig-
response process involving networks of interacting cells                  nal transduction [30]. In TCR stimulation process, LCK can
throughout the body [22]. Our BP analysis showed that the                 activate VAV GTPase to control the status of ezrin and
Journal of Immunology Research                                                                                                          7

Table 2: Top 5 genes evaluated by degree centrality, betweenness centrality, and subgraph centrality in the protein-protein interaction
network.

Protein           Degree centrality           Protein              Betweenness centrality             Protein         Subgraph centrality
LCK                     41.75                 ACACB                         20,963                      LCK              4,376,067.5
CD3G                    39.52                   TNF                         16,189                    CXCR4               4,266,117
B2M                     36.80                   LCK                         15,414                    CD3G                3,693,030
IFNG                    36.38                   EGF                         15,044                    GNG2               3,554,691.25
CD3D                    35.03                 PIK3CG                        10,487                     IFNG              3,534,239.5

                                                                                             CXCR3
                                                                    GNG2
                                                                                                             CCR5
                                                                                  CXCL10
                                                                                                             CCL5
                                                        TNF                   CXCR4
                                   CD44                                                           CXCL9
                                                                                           IL1B

                                                                                           IFNG
                                PIK3CG                    PTPRC

                                                                           CD8A      STAT1    IL2RB       IL12B
                                      VAV1
                                                 EGF

                        HLA-DPA1                           CD86
                                                                             CD3G             IL2RA

                                                    LCK           IL2RG
                                                                             CD3E
                                                       B2M                            CD3D

Figure 5: Protein-protein interaction (PPI) network of important proteins. Upregulated proteins are in red, and downregulated ones are in
blue. The PPI network consists of 27 upregulated proteins including LCK, CD3G, CD3E, CD3D, IFNG, VAV1, TNF, B2M, CXCR3, CCR5,
CCL5, CXCL9, CXCL10, CXCR4, GNG2, IL1B, IL12B, IL2RB, IL2RA, IL2RG, STAT1, CD8A, CD86, PTPRC, PIK2CG, CD44, and HLA-
DPA1 and 1 downregulated protein EGF. LCK, CD3G, and IFNG are identified as hub proteins.

moesin cytoskeletal protein phosphorylation, which regu-                  microarray analysis [35], even for a small sample size (2–5
lates a series of protein translocation events [31, 32]. A                cases) [36]. Nevertheless, the statistical power cannot be
previous study demonstrated that both AMR and TCMR                        calculated in that the limma method comprises multistep
manifested strong expressions of IFNG [33]. In AR, IFNG                   data processing including both linear models and contrast
cooperated with TNF to increase antigen availability in                   models, as well as Bayesian analysis [37]. The data were
rejection by enhancing HLA expression [34]. However, the                  downloaded from one dataset, and the sample size in
relationship between VAV1 and IFNG has not been reported                  GSE75693 was relatively small. The detailed demographic
in the pathogenesis of AR, which could be further verified in              features of the cohort were unavailable in the published
animal and cellular experiments. Finally, via the PPI network             article. Due to the retrospective and bioinformatics nature
analysis, we revealed that LCK in the TCR signaling pathway               of our study, further laboratory investigations on the cellular
is the hub protein in the interaction network of DEGs, which              and animal levels are necessary to elucidate the pathogenesis
underlies the notion that LCK might be a key link between                 of AR and to find potential therapeutic targets.
antigen recognition and cytotoxicity.
     The strength of our study is the combined use of several             5. Conclusions
bioinformatics methods including DEG analysis, GO, KEGG,
literature mining, STRING, and the PPI analysis. These data               In summary, we revealed the potential important role of LCK
mining methods may corroborate each other and make the                    in the pathogenesis of AR. LCK interacts with other 27
results reliable. However, our study has limitations. The                 proteins and is actively involved in TCR pathway to activate
sample size is relatively small. Different from conventional               the T cells in AR. LCK might be a potential therapeutic target
method, however, the limma method is proven effective in                   for AR.
8                                                                                                      Journal of Immunology Research

Conflicts of Interest                                                    [8] M. D. Denton, C. C. Magee, and M. H. Sayegh, “Immunosup-
                                                                             pressive strategies in transplantation,” The Lancet, vol. 353,
The authors state no conflict of interests.                                   no. 9158, pp. 1083–1091, 1999.
                                                                         [9] A. C. Webster, S. Wu, K. Tallapragada, M. Y. Park, J. R.
Authors’ Contributions                                                       Chapman, and S. J. Carr, “Polyclonal and monoclonal
                                                                             antibodies for treating acute rejection episodes in kidney
Linpei Jia, Rufu Jia, and Hongliang Zhang contributed                        transplant recipients,” Cochrane Database of Systematic
equally to the article as the correspondence authors.                        Reviews, no. 7, article CD004756, 2017.
                                                                        [10] T. H. Waid, J. S. Thompson, M. Siemionow, and S. A. Brown,
Acknowledgments                                                              “T10B9 monoclonal antibody: a short-acting nonstimulating
                                                                             monoclonal antibody that spares γδ T-cells and treats and
The authors would like to thank Sidgel and his colleagues for                prevents cellular rejection,” Drug Design, Development and
uploading their dataset. The authors also thank Ms Wei Ren                   Therapy, vol. 3, pp. 205–212, 2009.
from the Chinese Academy of Sciences for the support of                 [11] G. Zaza, P. Tomei, S. Granata, L. Boschiero, and A. Lupo,
statistical analysis and R codes. The study was supported                    “Monoclonal antibody therapy and renal transplantation:
by grants from Wu Jieping Medical Foundation Clinical                        focus on adverse effects,” Toxins, vol. 6, no. 3, pp. 869–891,
Research Funding (no. 320.6750.16050).                                       2014.
                                                                        [12] P. Erpicum, O. Hanssen, L. Weekers et al., “Non-invasive
                                                                             approaches in the diagnosis of acute rejection in kidney trans-
Supplementary Materials                                                      plant recipients: Part II: omics analyses of urine and blood
                                                                             samples,” Clinical Kidney Journal, vol. 10, no. 1, pp. 106–115,
Supplementary 1: R codes of differentially expressed genes.
                                                                             2017.
Supplementary 2: results of molecular function analysis.
                                                                        [13] A. B. Kimball, R. A. Grant, F. Wang, R. Osborne, and J. P.
Twenty-seven terms were selected according to P < 0 01
                                                                             Tiesman, “Beyond the blot: cutting edge tools for genomics,
and count ≥ 5. Supplementary 3: results of biological process                proteomics and metabolomics analyses and previous suc-
analysis. Ninety-four categories were selected according to                  cesses,” British Journal of Dermatology, vol. 166, pp. 1–8, 2012.
P < 0 01 and count ≥ 5. Supplementary 4: results of cellular
                                                                        [14] M. Mele, P. G. Ferreira, F. Reverter et al., “The human tran-
component analysis. Twenty-one categories were selected                      scriptome across tissues and individuals,” Science, vol. 348,
according to P < 0 01 and count ≥ 5. Supplementary 5: results                no. 6235, pp. 660–665, 2015.
of pathway analysis. Twenty-three pathways were selected                [15] T. K. Sigdel, Y. Gao, J. He et al., “Mining the human urine
according to P < 0 01 and count ≥ 5. (Supplementary Materials)               proteome for monitoring renal transplant injury,” Kidney
                                                                             International, vol. 89, no. 6, pp. 1244–1252, 2016.
References                                                              [16] Z. Lin and Y. Lin, “Identification of potential crucial genes
                                                                             associated with steroid-induced necrosis of femoral head based
 [1] V. R. Mas, T. H. Le, and D. G. Maluf, “Epigenetics in kidney
                                                                             on gene expression profile,” Gene, vol. 627, pp. 322–326, 2017.
     transplantation: current evidence, predictions, and future
     research directions,” Transplantation, vol. 100, no. 1, pp. 23–    [17] A. Wang and G. Zhang, “Differential gene expression analysis
     38, 2016.                                                               in glioblastoma cells and normal human brain cells based on
                                                                             GEO database,” Oncology Letters, vol. 14, no. 5, pp. 6040–
 [2] D. Zimmerman, A. A. House, S. J. Kim et al., “The risk of acute
                                                                             6044, 2017.
     rejection following kidney transplant by 25-hydroxyvitamin D
     and 1,25-dihydroxyvitamin D status: a prospective cohort           [18] M. Ashburner, C. A. Ball, J. A. Blake et al., “Gene ontology: tool
     study,” Canadian Journal of Kidney Health and Disease,                  for the unification of biology,” Nature Genetics, vol. 25, no. 1,
     vol. 4, 2017.                                                           pp. 25–29, 2000.
 [3] C. N. Crowson, R. D. Reed, B. A. Shelton, P. A. MacLennan,         [19] L. Li, G. Wang, N. Li, H. Yu, J. Si, and J. Wang, “Identification
     and J. E. Locke, “Lymphocyte-depleting induction therapy                of key genes and pathways associated with obesity in children,”
     lowers the risk of acute rejection in African American pediatric        Experimental and Therapeutic Medicine, vol. 14, no. 2,
     kidney transplant recipients,” Pediatric Transplantation,               pp. 1065–1073, 2017.
     vol. 21, no. 1, 2017.                                              [20] L. Zhang, Y. Huang, W. Zhuo, Y. Zhu, B. Zhu, and Z. Chen,
 [4] C. R. Dorr, W. S. Oetting, P. A. Jacobson, and A. K. Israni,            “Identification and characterization of biomarkers and their
     “Genetics of acute rejection after kidney transplantation,”             functions for Lapatinib-resistant breast cancer,” Medical
     Transplant International, vol. 31, no. 3, pp. 263–277, 2018.            Oncology, vol. 34, no. 5, p. 89, 2017.
 [5] M. Jalalzadeh, N. Mousavinasab, S. Peyrovi, and M. H.              [21] G. Wang, L. Bi, G. Wang, F. Huang, M. Lu, and K. Zhu,
     Ghadiani, “The impact of acute rejection in kidney transplan-           “Microarray analysis to identify the similarities and differences
     tation on long-term allograft and patient outcome,” Nephro-             of pathogenesis between aortic occlusive disease and abdomi-
     Urology Monthly, vol. 7, no. 1, article e24439, 2015.                   nal aortic aneurysm,” Vascular, vol. 26, no. 3, pp. 301–314,
 [6] K. L. Womer and B. Kaplan, “Recent developments in kidney               2017.
     transplantation—a critical assessment,” American Journal of        [22] R. Spreafico, S. Mitchell, and A. Hoffmann, “Training the 21st
     Transplantation, vol. 9, no. 6, pp. 1265–1271, 2009.                    century immunologist,” Trends in Immunology, vol. 36, no. 5,
 [7] M. D. Parkes, P. F. Halloran, and L. G. Hidalgo, “Mechanistic           pp. 283–285, 2015.
     sharing between NK cells in ABMR and effector T cells in            [23] O. Bestard and P. Cravedi, “Monitoring alloimmune response
     TCMR,” American Journal of Transplantation, vol. 18, no. 1,             in kidney transplantation,” Journal of Nephrology, vol. 30,
     pp. 63–73, 2018.                                                        no. 2, pp. 187–200, 2017.
Journal of Immunology Research                                            9

[24] J. L. Veale, L. W. Liang, Q. Zhang et al., “Noninvasive diagnosis
     of cellular and antibody-mediated rejection by perforin and
     granzyme B in renal allografts,” Human Immunology, vol. 67,
     no. 10, pp. 777–786, 2006.
[25] H. Sa, R. Leal, and M. S. Rosa, “Renal transplant immunology
     in the last 20 years: a revolution towards graft and patient
     survival improvement,” International Reviews of Immunology,
     vol. 36, no. 3, pp. 182–203, 2017.
[26] Y. Yoshioka, T. Suzuki, Y. Matsuo et al., “Protein lysine
     methyltransferase SMYD3 is involved in tumorigenesis
     through regulation of HER2 homodimerization,” Cancer
     Medicine, vol. 6, no. 7, pp. 1665–1672, 2017.
[27] M. Limbach, M. Saare, L. Tserel et al., “Epigenetic profiling in
     CD4+ and CD8+ T cells from Graves’ disease patients reveals
     changes in genes associated with T cell receptor signaling,”
     Journal of Autoimmunity, vol. 67, pp. 46–56, 2016.
[28] O. Ueda, N. A. Wada, Y. Kinoshita et al., “Entire CD3ε, δ, and
     γ humanized mouse to evaluate human CD3–mediated
     therapeutics,” Scientific Reports, vol. 7, article 45839, 2017.
[29] M. T. Pinto, T. M. Malta, E. S. Rodrigues et al., “T cell receptor
     signaling pathway is overexpressed in CD4(+) T cells from
     HAM/TSP individuals,” The Brazilian Journal of Infectious
     Diseases, vol. 19, no. 6, pp. 578–584, 2015.
[30] A. Fischer, C. Picard, K. Chemin, S. Dogniaux, F. le Deist, and
     C. Hivroz, “ZAP70: a master regulator of adaptive immunity,”
     Seminars in Immunopathology, vol. 32, no. 2, pp. 107–116,
     2010.
[31] E. J. Allenspach, P. Cullinan, J. Tong et al., “ERM-dependent
     movement of CD43 defines a novel protein complex distal
     to the immunological synapse,” Immunity, vol. 15, no. 5,
     pp. 739–750, 2001.
[32] A. S. Shaw, “FERMing up the synapse,” Immunity, vol. 15,
     no. 5, pp. 683–686, 2001.
[33] P. F. Halloran, J. M. Venner, and K. S. Famulski, “Compre-
     hensive analysis of transcript changes associated with allo-
     graft rejection: combining universal and selective features,”
     American Journal of Transplantation, vol. 17, no. 7,
     pp. 1754–1769, 2017.
[34] J. S. Pober, M. A. Gimbrone Jr., L. A. Lapierre et al., “Overlap-
     ping patterns of activation of human endothelial cells by inter-
     leukin 1, tumor necrosis factor, and immune interferon,”
     Journal of Immunology, vol. 137, no. 6, pp. 1893–1896, 1986.
[35] P. Baldi and A. D. Long, “A Bayesian framework for the
     analysis of microarray expression data: regularized t-test and
     statistical inferences of gene changes,” Bioinformatics, vol. 17,
     no. 6, pp. 509–519, 2001.
[36] C. Murie, O. Woody, A. Y. Lee, and R. Nadon, “Comparison of
     small n statistical tests of differential expression applied to
     microarrays,” BMC Bioinformatics, vol. 10, no. 1, p. 45, 2009.
[37] R. C. V. J. Gentleman, W. Huber, R. A. Irizarry, and S. Dudoit,
     Eds., “G.K. S. Limma: linear models for microarray data,” in
     Bioinformatics and Computational Biology Solutions Using R
     and Bioconductor. Statistics for Biology and Health, pp. 397–
     420, Springer, New York, NY, USA, 2005.
MEDIATORS         of

                                                                                   INFLAMMATION

The Scientific                                 Gastroenterology                                                              Journal of
World Journal
Hindawi Publishing Corporation
                                               Research and Practice
                                               Hindawi
                                                                                   Hindawi
                                                                                                                             Diabetes Research
                                                                                                                             Hindawi
                                                                                                                                                              Disease Markers
                                                                                                                                                              Hindawi
                                                                                   www.hindawi.com        Volume 2018
http://www.hindawi.com
www.hindawi.com                  Volume 2018
                                        2013   www.hindawi.com   Volume 2018                                                 www.hindawi.com    Volume 2018   www.hindawi.com            Volume 2018

Journal of                                                                                                                                                    International Journal of
Immunology Research
Hindawi
                                                                                                                                                              Endocrinology
                                                                                                                                                              Hindawi
www.hindawi.com                  Volume 2018                                                                                                                  www.hindawi.com            Volume 2018

                                                                 Submit your manuscripts at
                                                                    www.hindawi.com

                                                                                                                                                              BioMed
PPAR Research
Hindawi
                                                                                                                                                              Research International
                                                                                                                                                              Hindawi
www.hindawi.com                  Volume 2018                                                                                                                  www.hindawi.com            Volume 2018

                                                                                                                             Journal of
                                                                                                                             Obesity

                                                                               Evidence-Based
Journal of                                     Stem Cells                      Complementary and                                                              Journal of
Ophthalmology
Hindawi
                                               International
                                               Hindawi
                                                                               Alternative Medicine
                                                                               Hindawi                                       Hindawi
                                                                                                                                                              Oncology
                                                                                                                                                              Hindawi
www.hindawi.com                  Volume 2018   www.hindawi.com   Volume 2018   www.hindawi.com                 Volume 2018   www.hindawi.com    Volume 2018   www.hindawi.com            Volume 2013

                                                                               Parkinson’s
                                                                               Disease

Computational and
Mathematical Methods
in Medicine
                                               Behavioural
                                               Neurology
                                                                                                                             AIDS
                                                                                                                             Research and Treatment
                                                                                                                                                              Oxidative Medicine and
                                                                                                                                                              Cellular Longevity
Hindawi                                        Hindawi                         Hindawi                                       Hindawi                          Hindawi
www.hindawi.com                  Volume 2018   www.hindawi.com   Volume 2018   www.hindawi.com                 Volume 2018   www.hindawi.com    Volume 2018   www.hindawi.com            Volume 2018
You can also read