Downscaling Global Weather Forecast Outputs Using ANN for Flood Prediction
←
→
Page content transcription
If your browser does not render page correctly, please read the page content below
Hindawi Publishing Corporation
Journal of Applied Mathematics
Volume 2011, Article ID 246286, 14 pages
doi:10.1155/2011/246286

Research Article
Downscaling Global Weather Forecast Outputs
Using ANN for Flood Prediction

        Nam Do Hoai, Keiko Udo, and Akira Mano
        Disaster Control Research Center, Tohoku University, Aoba 6-6-11, Sendai 890-8579, Japan

        Correspondence should be addressed to Nam Do Hoai, nam@potential1.civil.tohoku.ac.jp

        Received 15 September 2010; Accepted 23 January 2011

        Academic Editor: Gani Stamov

        Copyright q 2011 Nam Do Hoai et al. This is an open access article distributed under the Creative
        Commons Attribution License, which permits unrestricted use, distribution, and reproduction in
        any medium, provided the original work is properly cited.

        Downscaling global weather prediction model outputs to individual locations or local scales is
        a common practice for operational weather forecast in order to correct the model outputs at
        subgrid scales. This paper presents an empirical-statistical downscaling method for precipitation
        prediction which uses a feed-forward multilayer perceptron MLP neural network. The MLP
        architecture was optimized by considering physical bases that determine the circulation of
        atmospheric variables. Downscaled precipitation was then used as inputs to the super tank
        model runoff model for flood prediction. The case study was conducted for the Thu Bon
        River Basin, located in Central Vietnam. Study results showed that the precipitation predicted
        by MLP outperformed that directly obtained from model outputs or downscaled using multiple
        linear regression. Consequently, flood forecast based on the downscaled precipitation was very
        encouraging. It has demonstrated as a robust technology, simple to implement, reliable, and
        universal application for flood prediction through the combination of downscaling model and
        super tank model.

1. Introduction
Numerical weather prediction NWP has demonstrated its breakthrough in flood forecast
recently. In terms of forecast lead time, the flood prediction based upon numerical weather
prediction outputs tends to outperform other conventional forecasts which are based on real-
time observation, especially in small- to medium-size basins where runoff concentration
is relatively short. The forecast lead times given by NWP are ranging from short-term
forecast a couple of hours to few days to medium-range forecast up to ten days or
more. This allows implementing effective action plans to minimize flood risk. At global
scale, even though NWP models have showed significant improvement in terms of spatial
resolutions, presently ranging from 25 to 50 km, these spatial resolutions are still far away
2                                                               Journal of Applied Mathematics

from the requirement for hydrological simulations or local-scale weather researches that
usually require much finer resolutions, of about hundreds meters for small catchments to
a couple of kilometers for large basins. Since land surface is averaged within very coarse grid
cells; thus, small-scale effects of topography may not be resolved in the global NWP model.
As a result, outputs from NWP models, hereinafter called the model outputs, are usually
unreliable such as precipitation that is well known as the most unpredictable variable. For
that reason, the flood forecast based on model outputs was not what had been expected 1, 2.
Although it is hoped that in the near future the global NWP models might be operational
at finer resolutions, downscaling the model outputs from such resolutions to specific sites
or area averages for practical uses is essential. Downscaling is a familiar technique used in
climate research and weather forecast that aims to utilize information derived from the global
NWP model outputs, particularly in the assessment of hydrological implication driven by
global climate models or attempting for runoff prediction.
        With respect to hydrological simulation and forecasting, though it is a new approach,
artificial neural network ANN has been reported to give better performance in rainfall-
runoff modeling than some other conventional runoff forecasts 3. The use of ANN
in runoff prediction is basically divided into two approaches. First, most studies used
ANN approach for direct runoff or river stage prediction, as described in literature 4.
The prediction based on ANN is generally considered as an empirical method using
mathematic transfer functions that relate stream flow with other weather variables. In this
case, the rainfall-runoff process is known as a black box system whose inputs are usually
hydrometeorological variables, such as antecedent rainfall and stream flow, and outputs
are regularly the runoff or stage prediction. This process apparently omits the effect of
physical characteristics of catchment on runoff generation processes. As a result, it sometimes
reflects the inconsistency and inefficiency. In addition, this method usually provides the
runoff forecast subsequence to the occurrence of rainfall. Therefore, the forecast lead-time
is relatively short, especially the quick response catchments, of the order of zero to a couple
of hours. To some extent, it is considered insufficient to put in place effective flood mitigation
measures. On the contrary, the second approach employs ANN for indirect runoff prediction.
The ANN is used to increase the accuracy of precipitation prediction, usually obtained from
the model outputs, which is then used as inputs to hydrological models for runoff prediction.
This approach is likely to outperform the previous one not only in terms of forecast lead-
time extension but also the inclusion of the effects of catchment physical variations and
rainfall distribution on the runoff generation process; thus, predictions are more realistic.
Recent studies showed that potential predictors used for precipitation prediction are mostly
based on outputs from high-resolution weather prediction models or combination of these
outputs with other remote sensing information such as images of cloud structures 5, 6.
However, there have been existing limitations that these studies were restricted either just
applicable for some in limited areas where are accessible to high-resolution models or at
relatively short-term forecast. It means that greater lead times of flood forecast in larger scales
are required, particularly in developing countries where globally covered NWP models are
available; therefore, its benefit is maximized.
        This paper presents the development of an empirical-statistical approach to downscale
the precipitation from global NWP outputs to a basin-average scale for flood runoff
prediction. The most popular ANN architecture, the feed-forward multilayer perceptron
MLP using error training back-propagation method, was selected to downscale the large-
scale precipitation. The large-scale predictors were obtained from the global NWP outputs,
operated by Japan Meteorological Agency, with 0.5◦ grid point value data. Physical bases of
Journal of Applied Mathematics 3
precipitation evolution were analyzed for the optimization of the MLP configuration used in
calibration processes because it is very essential to drop out uncorrelated variables that cause
overfitting and to overcome the requirement of a long historical record for learning stages as
well as to speed up computational skills.
The study point of view targets to use simple approaches which are widely applied
and of proven accuracy. Hence, the downscaled precipitation was then used as inputs to
the super tank model, a calibration-free requirement rainfall-runoff model, which has been
applied in simulating the river flow in a number of basins across various spatiotemporal
scales to predict the flood runoff. The case study was conducted for the Upper Thu Bon
River, located in Central Vietnam, where floods are considered the most dangerous calamity
to human lives. The study results are expected to enhance the existing flood-forecasting
technologies and mitigation practices. This is considered valuable for developing countries
where ground weather observation is scarce and access to high resolution NWP models is
limited.
2. Data and Methodology
2.1. Data and Study Area
Global NWP models are operational at many national meteorological agencies such as
in Europe, America, and Japan. These models have been often upgraded; as a result,
its spatiotemporal resolution has been quickly increased since the advent of computer
technology. However, each agency has its own forecast purposes and is very much
dependent on computational capability. The models might be different in terms of physical
parameterization, forecast range, forecast issue routine, and spatiotemporal resolution. This
study used atmospheric variables derived from the global NWP model outputs, operational
at Japan Meteorological Agency, with spatial resolution of 0.5◦ and 60 vertical layers. It is
currently considered the most advanced NWP model, for global scale, that produces 84-hour
forecast, issued 4 times per day, at 00, 06, 12, and 18UTC. Precipitation on the surface and
other variables are predicted for every 6-hour interval, 00–6, 6–12, 12–18, and 18–24UTC.
This study addressed a convention that precipitation obtained from rain gages was
considered as reference rainfall truth for the comparison. Given the fact that the global
NWP with 0.5◦ spatial resolution has been operational since late 2007, this analysis was based
on archived data for the wet seasons, 2008 and 2009. Inverse distance weighting method
was used to interpolate precipitation and related atmospheric parameters either from a point
representation rain-gage or grid point value representation NWP to area-average basis.
In Central Vietnam, it has been highlighted that flood is the most common climate-
related disaster. The region has often experienced large-scale floods during the wet seasons,
from September to December, annually. These floods were usually caused by extremely
widespread intense orographic rainfall that occurred on the windward of the Annam
Range, known as the border between Vietnam and Laos. This type of rainfall was basically
formulated through the combination of the cold surge from Northern continent and the
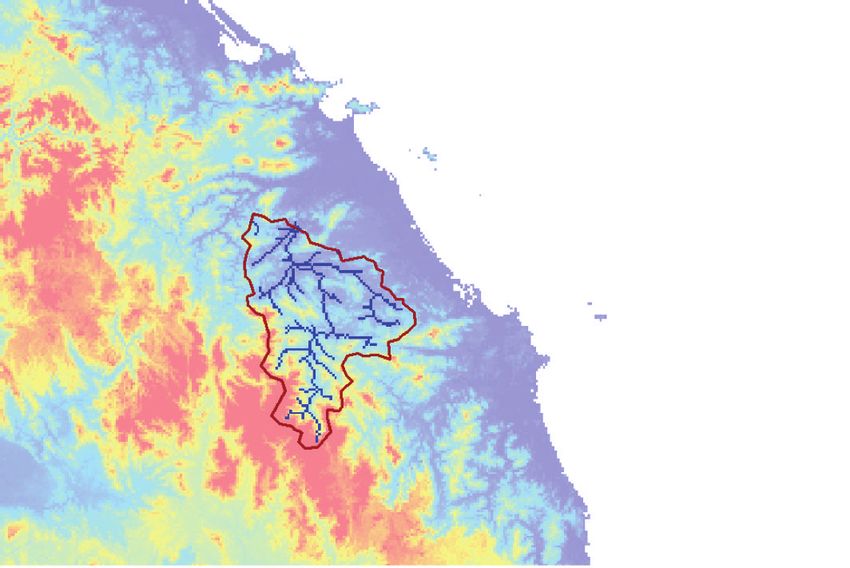
tropical depression from the Pacific Ocean 7. The basin selected in this study is the upper
reach of Thu Bon River see Figure 1 with the catchment area of 3,150 km2 . Average basin
elevation is about 445 m above the mean sea level. Given the topographical features, rivers in
this region are generally very short and steep; therefore, catchment response is rapid, resulted
in very short time for people at risk to implement effective flood mitigation measures.
4                                                                                Journal of Applied Mathematics

           107◦ 0’0”E    107◦ 30’0”E    108◦ 0’0”E        108◦ 30’0”E   109◦ 0’0”E
               +             +                 +              +             +                   +                        + 16◦ 30’0”N
                                  Hue                                                                        China

                                                                        East                    Hanoi
                         ALuoi                                          sea             Laos
                                  Nam Dong
                                          Da Nang

                                                                                                    Vi
                                                                                                       e
                                                                                                              East sea

                                                                                                      tn
      16◦ 0’0”N +            +                 +              +             +                                            + 16◦ 0’0”N

                                                                                                        am
                                               Outlet
                                                                                          +
                                                                                     Thailand

                                                                                           Cambodia
                                                                                                           Ho Chi Minh
                     N                                       Tam Ky                                            city

     15 30’0”N +
       ◦                     +                 +              +             +                   +                        + 15◦ 30’0”N
                                                   Tra My

                                                                  Quang Ngai         Elevation
                                                                                                High: 1750 m
      15◦ 0’0”N +            +          An
                                             na +             +             +                   +                        + 15◦ 0’0”N
                                               m
                                                 Ra                 Ba To
                                                   ng
                                                      e
                Kilometers
                0 10 20 40                                              Hoai Nhon
                                                                                                Low: −47 m
     14◦ 30’0”N +            +                 +              +             +                   +                        +
                         107◦ 30’0”E    108◦ 0’0”E        108◦ 30’0”E   109◦ 0’0”E     109◦ 30’0”E

                    Figure 1: Location of study area and weather observation points •.

2.2. Downscaling
It is expected that in the near future global NWP models may be operational at very fine
resolution; however, there will still be a requirement to refine these models outputs to
individual sites or local scales for weather research and application 8. Downscaling is a
common technique used in climate research and weather forecast that tries to utilize global
atmospheric variables such as precipitation information for the use of impact assessment,
hydrological simulation, and forecasting at subgrid or small scales. Downscaling methods
are simply classified into dynamical approach and empirical-statistical approach 9.
        The dynamical downscaling normally refers to limited area models LAMs, or the
so-called nested grid models, embedded with global NWP fields at its lateral boundaries.
This type of models is usually based on fundamental physical principles and is able to take
into account considerations of small-scale effects of land surface on weather patterns. Thus,
outputs from LAM are expected to be realistic. However, it requires cost-effective evaluation
regarding the selection of downscaling methods. First, it is costly to run LAM because of
massive computational requirements, known as super computer systems. As a result, not
many nations, especially the developing countries, are able to establish its own LAM for the
purpose of weather forecast and hydrological simulations. This type of model is currently
available only in such regions as North America North Atlantic Model, Japan Mesoscale
Model, and some regions in Europe COSMO Model for Germany. Second, the LAM are
also subject to systematic biases as their accuracy is very much dependent on the veracity of
the global weather model outputs that are used to derive the boundary conditions of the LAM
9. In addition, in some cases finer-grid data might not be well reflected in the hydrological
model if the details are aggregated over time and space 10.
        In line with the scope of this study that simple approaches across a wide range of
application are preferable the present study used statistical downscaling method that is
considered as one of the most cost-effective methods in local-impact assessments of climate
Journal of Applied Mathematics                                                               5

scenarios and weather forecast. The statistical downscaling is cheap to run and universally
applicable. Various statistical tools for weather downscaling have been proposed and were
clearly reviewed by Wilbey and Wigley 8. The statistical downscaling is fundamentally
based on the formulation of either linear or nonlinear relationships between large-scale
atmospheric variables and local or single-site scale variables. These relationships are then
used to correct the outputs of the NWP models. The weakness of the method is that it requires
a long historical weather observation record for the calibration processes. However, in the
context of the present study, this problem can be avoided by taking into account the physical
bases regarding the evolution processes of storm events in the study area. These storms are
widespread orographic rainfall, typically following tropical depressions and typhoons in wet
seasons.
       Model output statistic MOS has been well known for a long history as a statistical
downscaling tool for operational weather forecast 11. Multiple linear regression is com-
monly used in the formulation of relationships between variables predictors derived from
global NWP outputs and local or small-scale variables predictants such as downscaling
precipitation. This method has been accepted in many meteorological centers for operational
weather forecast, for example, in the USA. Nonetheless, precipitation is one of the most
unpredictable variables, in terms of learning skill; a review of empirical downscaling
techniques indicated that ANNs are generally observed to perform a better learning ability
than the other regression-based downscaling techniques 4, 12. Consequently, the present
study employed ANN to downscale the large-scale precipitation derived from the global
NWP model outputs.
       Ground weather analysis based on downscaling global NWP outputs is typically
conducted for individual points, subgrid scale or area-average bases. The NWP outputs are
provided as a grid-point-value format, at very coarse spatial resolution. Using area-average
downscaling approach apparently tends to reduce small-scale effects, in particular when the
catchment size is larger than the size of grid cells approximate 2,500 km2 . Information from
neighbor grid points was preliminarily interpolated to the study basin using inverse distance
weighting method. The same procedure was conducted for the ground rainfall observation
points in order to compare with those obtained from the model outputs.

2.3. Artificial Neural Network (ANN)
Artificial neural network is simply understood as a nonlinear statistical data modeling tool
that presents complex relationships between predictors input layer and predictants output
layer through a synapse system hidden layers connecting predictors with predictants,
or the so-called required outputs. As a result, ANN has demonstrated its wide range of
application to solve complicated problems in many fields, for instance, engineering and
environment.
        Given many types of ANN have been extensively developed so far, as stated in
literature 4, especially since the error back-propagation training algorithm was explored
13 it is very important regarding the selection of an appropriate ANN configuration and
training method. In many cases, cost-effective analysis should be considered. Present study
approach, for example, to employ a simple and reliable technology is preferable. One of
the most simple and popular ANN architectures which was mostly used in hydrological
modeling, approximately 89% 4, the feed-forward multilayer perceptron MLP using error
back-propagation weight update rule, was employed for calibration processes. Presently,
6                                                                      Journal of Applied Mathematics

                                            Weight adjustment

                                         Weight
                                    ∑
                                                       ANN
                                    ∑             ∑   output ∑
                                                               Error

                      Inputs
                                                                          Prediction
                                                                           rainfall
                                    ∑
                                                         Required
                               Neural network             output

                    Figure 2: ANN architecture with back-propagation algorithm.

the MLP neural network was found to outperform radial basis function neural network and
other multiple linear regression methods. The feed-forward MLP configuration selected here
includes an input layer, a single hidden layer which has been selected by most researches
4, and an output layer that is interconnected by synapse weights Figure 2. The number of
nodes of the hidden layer was selected ranging from 2n  1 to 2n0.5  m, where n is the
number of input nodes and m is the number of output nodes 14. The training phase of the
ANN is to adjust the weights so that the difference between the network outputs predictants
and the expected outputs is minimized. For each node at a given layer, the outputs of n
neurons in the previous layer provide the input to that node. These outputs are multiplied
by the respective weights of connections between nodes, and then the summation function
adds together all these products to produce the input that is processed by the activation
function. The selection of activation functions is dependent on the type of network and
learning algorithm; however, logistic sigmoid and hyperbolic tangent functions have been
mostly employed, up to 64% and 13%, respectively 4. Approximation used for the weight
change is given in 2.1 by the delta rule 15

                                                             ∂E2
                                        wnew      wold − η       ,                              2.1
                                                             ∂w

where η is the learning rate parameter, w is the weights, and E2 is the squared error.

2.4. Optimization of Predictors
It has been already addressed in 4, with respect to data handling for ANN, in which
the determination of appropriate predictors for the input layer is very important. This
process tends not only to drop out those variables that have less influence on the output
to avoid overfitting but also to overcome the shortage of historical record used for calibration
processes. For that reason, this study takes into account the physically based consideration
regarding the precipitation evolution. As addressed in the previous sections, the study area
is dominated by the orographic rainfall that intense rainfall is prevailing on the windward
side to the East of the Annam Range of about 1500 m, that is, approximately equal to the
geopotential height of 850 hPa pressure level, and very little precipitation falls on the leeward
side to the West. Therefore, among hundreds of variables provided by the global NWP
outputs, only variables which are driving factors for the orographic rainfall evolution were
selected in the calibration processes. It includes momentum variables of pressure levels of
Journal of Applied Mathematics                                                                7

700 hPa and 850 hPa such as wind-field velocities and changes in vertical pressure and the
rainfall prediction on the surface. Additional predictors screening was conducted to finalize
a good set of predictors based on “stepwise regression” or known as forward regression.

2.5. Hydrological Model
With respect to hydrological modeling, the tank model is considered a very simple model that
has been widely used in rainfall runoff-analysis. This feature is in line with the standpoint
of the study that simplified approaches are preferable. However, as a conceptual model,
the tank model has many parameters that are required for calibration; it might not be an
appropriate selection to assess the rainfall-runoff processes for poor observation basins. The
super tank model used in this study aims to overcome this issue. The super tank is also
based on the original tank model, being attributed to some physical-base features 16.
Thus, the super tank model is nearly calibration-free requirement, because model parameters
are internally calibrated based on catchment geotopographical information. Additionally,
the super tank model is semidistributed; therefore, it is assumed to outperform lumped
hydrologic models in terms of spatial variation consideration. As a result, the super tank
model has demonstrated its robustness and reliability in rainfall-runoff modeling, across a
wide range of spatial and temporal scales as described in 2, especially the scarce observation
catchments. Evaluation of runoff model performance is based on two criteria, Nash Sutcliffe
Index NSI, or the so-called coefficient of efficiency and the relative error of predicted runoff
η, as expressed in 2.2 and 2.3, respectively

                                                            2
                                               Qobs − Qpred
                               NSI    1−                          ,                       2.2
                                            Qobs − Qobs.mean 2

                                          Qpred − Qobs
                                      η                   ,                                2.3
                                               Qobs

where, Qobs observed river flow and Qobs.mean         mean observed river flow and Qpred
predicted river flow.

3. Results and Discussion
3.1. Downscaling Precipitation
In respect of precipitation prediction, it has been considered as the most difficult variable to
be predicted. The precipitation evolution involves a complex process that is not only driven
by the dynamic change in atmosphere but also affected by land-surface characteristics. The
NWP models, in general, tend to overestimate light rainfall. On the other hand, it seems
to severely underestimate intense rainfall, particularly in elevated watersheds. In practice,
the longer the forecast lead time is, the most effective flood mitigations can be put in place.
Unfortunately, forecast uncertainty is likely to be larger along with the forecast lead time.
It is necessary to evaluate to what lead time of the forecast is required for flood mitigation
purposes. In the context of this study, forecasting for flood warning was defined. The forecast
lead time is supposed to be sufficient, such as for evacuation that is considered within 24
hours, in places like developing countries which have very limited access to proper logistic
8 Journal of Applied Mathematics
200
Rainfall (mm/6 hr)
150
100
50
0
1-Sep-08
8-Sep-08
15-Sep-08
22-Sep-08
29-Sep-08
6-Oct-08
13-Oct-08
20-Oct-08
27-Oct-08
3-Nov-08
10-Nov-08
17-Nov-08
24-Nov-08
1-Dec-08
8-Dec-08
15-Dec-08
22-Dec-08
29-Dec-08
5-Sep-09
12-Sep-09
19-Sep-09
26-Sep-09
3-Oct-09
10-Oct-09
17-Oct-09
24-Oct-09
31-Oct-09
7-Nov-09
14-Nov-09
21-Nov-09
28-Nov-09
5-Dec-09
12-Dec-09
19-Dec-09
26-Dec-09
Time (6 hr)
Obs
Model output
Figure 3: Time series of observed rainfall and those derived from the model outputs for wet seasons, 2008
and 2009.
availability and evacuation routes. As a consequence, analyses are focused on model outputs
of 24-hour forecast lead time by updating the exiting forecast lead time 84-hour on daily
basis. In addition to the increased trend of the uncertainty along with the forecast lead time,
it has been observed that forecast skill of NWP models is higher as model resolutions are
increased.
Preliminary downscaling precipitation was conducted by interpolating the model
outputs from the grid point value representation 0.5◦ or equal to grid cell size of 50 × 50 km
to subgrid scale then was averaged for catchment scale. The comparison of area-average
rainfall derived from rain gages and model outputs for periods Sep–Dec, 2008 and 2009, is
presented in Figure 3. These periods are classified as wet seasons when most intense rainfall
storms were observed. The wet season usually holds up to 70 percent of the total annual
precipitation. As seen in Figure 3, model bias was found for most storm events. The model-
output-driven precipitation prediction was much lower than the actual observation. A reason
for this discrepancy might be explained by the converse behavior of altitudinal dependence
of precipitation between actual observation and that obtained from model outputs, especially
in elevated watersheds. The comparison of altitudinal dependence of precipitation between
observation and model outputs was conducted for various locations 9 rain gages, as seen in
Figure 1 with different heights in the Central Vietnam 17. Results showed that the increase
tendency of relationship between the rainfall observed at 9 rain gages and its elevation was
found. Rain gages in low location, in other words, close to the shoreline, were observed to
show less rainfall than those located in higher elevations. On the contrary, rainfall prediction,
which was preliminarily downscaled from model outputs to individual rain-gage using
interpolation method, depicted an opposite trend. It was found to be a considerable declining
of forecasted rainfall towards the altitudinal increase. The forecasted precipitation was found
closer to the observation in low-elevation locations. This model bias might be interpreted as
surface elevation is averaged within a coarse spatial resolution; thus, small-scale effects of
topography may not be resolved in the global NWP model.
In the following paragraphs, results for downscaling precipitation are presented, using
the feed-forward MLP with error back-propagation training algorithm. The input layer of
Journal of Applied Mathematics                                                                                                                       9

                                600                                                               1200

      Predicted rainfall (mm)

                                                                             Predicted rainfall (mm)
                                400                                                                    800

                                200                                                                    400

                                  0                                                                      0
                                      0          200         400       600                                   0          400         800       1200
                                              Observed rainfall (mm)                                                 Observed rainfall (mm)

                                          Model output                                                           Model output
                                          MLR                                                                    MLR
                                          ANN                                                                    ANN
                                                    a                                                                       b

Figure 4: Comparison of accumulative rainfall between observation and prediction obtained from model
output and downscale using MLR and ANN for single storm event a on Sep. 26–30th, 2009 and
continuous storm event b on Nov. 17th–27th, 2008.

the feed-forward MLP architecture, as a result of stepwise regression, comprises 3 predictors
3 nodes that are derived from the model outputs, including vertical changes in atmosphere
pressure at i the layer 700 hPa, ii the layer 850 hPa, and iii precipitation prediction on the
surface. 6 nodes are selected for the hidden layer. Finally, results from the output layer are the
downscaled precipitation. Data of 12 storm events which occurred in wet seasons, 2008 and
2009, was selected for the analysis. The data set was divided into training and validation data,
which a majority of studies have used.
        The area-average downscaled precipitation and that obtained from model outputs
were then compared to the actual area-average observation, known as reference rainfall,
on storm event basis. The results showed that there is a low forecast skill of the NWP
model at the initial stage of each storm event. The model severely underestimated the actual
precipitation. A better forecast skill was found towards the recession limb of the storms.
However, the comparison of accumulative precipitation shows that rainfall predicted by the
NWP model is much less than the actual observation Figure 4. These uncertainties can be
understood as not only resulting from the averaged surface elevation in a coarse grid cells
and the altitudinal bias of the global NWP model but also because of the incompleteness
of initial condition assumptions inputted into the NWP models at every initial stage of the
storms.
        On the other hand, significant improvement of rainfall prediction was observed
using the proposed downscaling method. With respect to the comparison of accumulative
rainfall between downscale and observation, very good agreements were found. As seen in
Figure 4, the downscaled precipitation circles shows best fit with the perfect line solid
line. Correlation coefficient for the area-average rainfall increased about 12% and 5% for
single storm and continuous storms, respectively. The coefficient of determination R2  that
10                                                                                                                             Journal of Applied Mathematics

                      15000                                       0                                              15000                                       0
                                                                  100                                                                                        100

                                                                                                                                                                   Rainfall (mm/6 hr)
                                                                        Rainfall (mm/6 hr)
  Discharge (m3 /s)

                                                                                             Discharge (m3 /s)
                      10000                                       200                                            10000                                       200
                                                                  300                                                                                        300

                       5000                                       400                                             5000                                       400
                                                                  500                                                                                        500

                          0                                       6000                                               0                                       600
                              0 12 24 36 48 60 72 84 96 108 120                                                          0 12 24 36 48 60 72 84 96 108 120
                                           Time (hr)                                                                                  Time (hr)

                                   DMO                    Q rep                                                               ANN                  Q dmo
                                   Q obs                  Q dmo                                                               Q obs                Q ann
                                             a                                                                                        b

Figure 5: Time series of observed hydrograph Q obs and those based on different precipitation
estimation: a observed by rain gages Q rep and derived from direct model outputs Q dmo, and b
downscaled using ANN Q ann for the flood event on Sep. 26th–30th, 2009.

measures the fitness of the regression model was found rising from 0.55 for the direct
model outputs to 0.96 for the downscaled rainfall using ANN technique for the single
storm event. Similarly, values of 0.39 and 0.56 were obtained for the continuous storm
event. Meanwhile, skill scores of precipitation forecast based on ANN outperformed those
based on DMO, approximately 45% increase. This implies that the present downscaling
method attributed with some physical-based features is appropriate, universally applicable
across the requirement of a long historical record for the calibration processes. Another
regression technique that was presented in 2, the stepwise multiple linear regression
MLR, as expressed in 3.1, is also addressed here for the intercomparison. It was
observed that downscaled precipitation using MLR technique showed lower forecast skill
score than ANN approach, of about 30%. The R2 for the downscaled rainfall using
MLR technique was found to be 0.68 and 0.46 for the single and continuous events,
respectively

                                                   Pmlr   a0  a1 Pdmo  a2 X2  · · ·  an Xn ,                                                                   3.1

where Pmlr is downscaled precipitation using MLR, Pdmo is direct model output precipitation
forecast, X2,n is independent model output variables, ao is regression constant, a1,n is
regression coefficients, and n is number of independent variables.

3.2. Flood Forecast Based on Downscaled Precipitation
Though the super tank is nearly calibration-free requirement, it is essential to validate param-
eters of the super tank model through the reproduction of runoff using rainfall information
obtained from rain gages. Detailed runoff model setup and validated parameters were
presented in 2. The hydrograph simulated by the super tank model at the outlet of the catch-
ment using input precipitation derived from rain gages, or the so-called reproduction of flood
Journal of Applied Mathematics 11
runoff Q rep, for the flood event on September 27–30th, 2009, is plotted in Figure 5a.
It showed a very good agreement with the observed hydrograph Q obs. Model
performance was evaluated by NSI, showing a very high efficiency, approximately 0.93.
Meanwhile, relative error of 16% was observed for the peak discharge.
In next steps, different rainfall estimations from direct model outputs and downscaled
results, hereinafter referred to as DMO and ANN, respectively, were then used as inputs to
the super tank model to predict flood runoff. Forecasted flood runoff was compared to the
observed discharge and also the reproduced flood runoff, as illustrated in Figures 5a and
5b. Considerable uncertainties were observed on the rising limb of the hydrograph that
was driven by DMO Q dmo. On the other hand, a better forecast towards the recession
limb was found. It is evident that the underestimate of precipitation is a main cause for a
low hydrograph. It underestimated about 16% lower than the actual peak, but time to peak
agreed well with that observed. Overall model performance was indicated by NSI, of about
0.74.
Given the downscaled precipitation was observed for higher forecast skill to the direct
model outputs, for that reason, ANN has increased flood forecast skill, as seen in Figure 5b.
The predicted hydrograph Q ann was comparable to that obtained using rain gages
Q rep, as mentioned in the previous paragraphs. Improved model performance was found,
and the model efficiency increased to 0.92; meanwhile, relative error of the peak discharge
decreased to 3.8%.
3.3. Model Validation
To evaluate the skill of ANN models, the data set should be ideally divided into three
sub-sets, respectively, for learning phase, testing phase, and validating phase 4. In fact,
regarding the limited data availability, only the learning phase and validating phase were
conducted. In present study, the storm event on November 1st–7th, 2009 was selected for
model validation. Downscaled precipitation was accumulated, and was then compared to
that obtained from model outputs as well as actual observation. It was noticed that model-
output-driven precipitation remained underestimated, while the downscaled rainfall showed
a very good agreement with the actual observation, except a slight overestimate at the end of
the storm. These are clearly illustrated in Figure 6. It means that a considerable precipitation
prediction skill of ANN model was demonstrated.
The rainfall information was subsequently used to predict the flood runoff. Forecasted
hydrographs based on rainfall derived from DMO and downscale using ANN are
illustrated in Figure 7. Again, it was found that the DMO-driven hydrograph has severely
underestimated the peak discharges. Model efficiency was very low, with NSI of about 0.25
and relative error of the peak of 38%. On the other hand, the downscaled precipitation
using ANN-driven flood forecast, in case of this model validation, showed a substantial
improvement, approximately 75%, in terms of the model efficiency NSI is up to 0.81.
Flood propagation behavior showed very good agreement with the actual observation,
especially the time to peak. The model was found to slightly underestimate peak discharges,
approximately 25% lower than the actual peaks. However, comparison of total volume
showed a very close estimate to the observed volume, just approximately 14% lower than
the true volume. In this case, the reliable estimation in the volume of imminent floods will
be very useful information that enables the implementation of flood-control measures, for
instance, through proper reservoir operation system.12 Journal of Applied Mathematics
600
500
Acc. rainfall (mm)
400
300
200
100
0
0 24 48 72 96 120 144
Time (hr)
Obs
DMO
ANN
Figure 6: Time series of observed and forecasted hyetographs for the validated storm event on Nov. 1st–
7th, 2009.
6000 0
5000 50
Rainfall (mm/6 hr)
Discharge (m3 /s)
4000 100
3000 150
2000 200
1000 250
0 300
0 24 48 72 96 120 144 168 192 216 240 264
Time (hr)
ANN Q dmo
Q obs Q ann
Q rep
Figure 7: Time series of observed and forecasted hydrographs for the validated flood event on Nov. 1st–7th,
2009.
4. Conclusion
This paper has presented an efficient empirical-statistical approach, using the most favorite
ANN architecture, the MLP, with error training back-propagation method, to downscale the
precipitation from global NWP outputs to a basin-average scale, subsequently, was used for
flood-runoff forecast. The downscaling model has taken into account the physical bases of
the precipitation evolution induced by meteorological and land surface characteristics in the
study area. As a result, the present model has exhibited cost-effective, simple to implement,
and universal application.Journal of Applied Mathematics 13
The study results indicated considerable uncertainties in precipitation predicted by
the global NWP model due to the coarse spatiotemporal resolution and inherent system bias.
Accordingly, the flood forecast based on DMO was not what had been expected. It severely
underestimated the true hydrograph. By using downscaling approach, however, significant
increase of forecast skill was observed for flood prediction based on the downscaled
precipitation. The ANN has showed a better learning ability than those using the MLR
method.
The presented model has demonstrated the provision of reliable information of the
coming flood in a very early stage 24 hr lead time, as considered outperforming other con-
ventional forecasting methods, so that vulnerable communities and flood-control bodies are
more active in coping with potential threat and damage in order to insure that flood mitiga-
tions are effectively put in place. In addition, it should be stressed that using simple, reliable,
and widely applied approaches is the benefit of the study. The prediction model is therefore
considered as universally applicable, especially in the developing countries where weather
observation is scarce and access to high-resolution weather prediction models is limited.
Acknowledgments
The authors would like to express special thanks to the Institute for International Advanced
Research and Education of Tohoku University, Japan, for the financial support of this study.
Special thanks are given to Dr. Phil Brierley for provision of MLP neural code and Dr. Jiye
Zeng for the grid point value decoding tools.
References
1 B. Jens and T. Ezio, “Coupling meteorological and hydrological models for flood forecasting,”
Hydrology and Earth System Sciences, vol. 9, no. 4, pp. 333–346, 2005.
2 D. H. Nam, K. Udo, and A. Mano, “Development of short-term flood forecast model—a case study
for central vietnam,” Annual Journal of Hydraulic Engineering, Japan Society of Civil Engineering, vol. 54,
pp. 163–168, 2010.
3 K. Hsu, H. V. Gupta, and S. Sorooshian, “Artificial neural network modeling of the rainfall-runoff
process,” Water Resources Research, vol. 31, no. 10, pp. 2517–2530, 1995.
4 C. W. Dawson and R. L. Wilby, “Hydrological modelling using artificial neural networks,” Progress in
Physical Geography, vol. 25, no. 1, pp. 80–108, 2001.
5 G. Kim and A. P. Barros, “Quantitative flood forecasting using multisensor data and neural
networks,” Journal of Hydrology, vol. 246, no. 1-4, pp. 45–62, 2001.
6 T. Wardah, S. H. Abu Bakar, A. Bardossy, and M. Maznorizan, “Use of geostationary meteorological
satellite images in convective rain estimation for flash-flood forecasting,” Journal of Hydrology, vol.
356, no. 3-4, pp. 283–298, 2008.
7 S. Yokoi and J. Matsumoto, “Collaborative effects of cold surge and tropical depression-type
disturbance on heavy rainfall in Central Vietnam,” Monthly Weather Review, vol. 136, no. 9, pp. 3275–
3287, 2008.
8 R. L. Wilby and T. M. L. Wigley, “Downscaling general circulation model output: A review of methods
and limitations,” Progress in Physical Geography, vol. 21, no. 4, pp. 530–548, 1997.
9 E. B. Rasmus, H. B. Inger, and C. Deliang, Emprirical-Statistical Downscaling, World Scientific
Publishing, 2008.
10 E. P. Salathe, “Comparison of various precipitation downscaling methods for the simulation of
streamflow in a rainshadow river basin,” International Journal of Climatology, vol. 23, no. 8, pp. 887–901,
2003.
11 H. R. Glahn and D. A. Lowry, “The Use of Model Output Statistics MOS in objective weather
forecasting,” Journal of Applied Meteorology, vol. 11, pp. 1203–1211, 1972.14 Journal of Applied Mathematics
12 J. T. Schoof and S. C. Pryor, “Downscaling temperature and precipitation: a comparison of regression-
based methods and artificial neural networks,” International Journal of Climatology, vol. 21, no. 7, pp.
773–790, 2001.
13 D. E. Rumelhart and J. L. McClelland, Parallel Distributed Processing: Explorations in the Microstructures
of Cognition, vol. 1, MIT Press, Cambridge, Mass, USA, 1986.
14 D. Fletcher and E. Goss, “Forecasting with neural networks: an application using bankruptcy data,”
Information and Management, vol. 24, no. 3, pp. 159–167, 1993.
15 P. Brierley, “Some practical application of neural networks in the electricity industry,” Ph.D. thesis,
Cranfield University, Cranfield, UK, 1998.
16 H. Kardhana and A. Mano, “Uncertainty evaluation in a flood forecasting model using JMA-NWP,”
Journal of Disaster Research, vol. 4, no. 4, pp. 272–277, 2009.
17 D. H. Nam, K. Udo, and A. Mano, “Assessment of altitudinal dependence of rainfall in central
vietnam,” in Proceedings of the 12th International Summer Symposium, Japan Society of Civil
Engineering, 2010.Advances in Advances in Mathematical Problems Journal of
Operations Research
Hindawi Publishing Corporation
Decision Sciences
Hindawi Publishing Corporation
in Engineering
Hindawi Publishing Corporation
Algebra
Hindawi Publishing Corporation
Probability and Statistics
Hindawi Publishing Corporation
http://www.hindawi.com Volume 2014 http://www.hindawi.com Volume 2014 http://www.hindawi.com Volume 2014 http://www.hindawi.com Volume 2014 http://www.hindawi.com Volume 2014
The Scientific International Journal of
World Journal
Hindawi Publishing Corporation
Differential Equations
Hindawi Publishing Corporation
http://www.hindawi.com Volume 2014 http://www.hindawi.com Volume 2014
Submit your manuscripts at
http://www.hindawi.com
International Journal of Advances in
Combinatorics
Hindawi Publishing Corporation
Mathematical Physics
Hindawi Publishing Corporation
http://www.hindawi.com Volume 2014 http://www.hindawi.com Volume 2014
Journal of Journal of International Journal of Abstract and Discrete Dynamics in
Complex Analysis
Hindawi Publishing Corporation
Mathematics
Hindawi Publishing Corporation
Stochastic Analysis
Hindawi Publishing Corporation
Applied Analysis
Hindawi Publishing Corporation
Nature and Society
Hindawi Publishing Corporation
http://www.hindawi.com Volume 2014 http://www.hindawi.com Volume 2014 http://www.hindawi.com Volume 2014 http://www.hindawi.com Volume 2014 http://www.hindawi.com Volume 2014
International Journal of
Journal of
Applied Mathematics
Journal of
Mathematics and
Mathematical
Discrete Mathematics
Sciences
Journal of Journal of
Hindawi Publishing Corporation Hindawi Publishing Corporation Volume 2014
Function Spaces
Hindawi Publishing Corporation Hindawi Publishing Corporation
Optimization
Hindawi Publishing Corporation
http://www.hindawi.com Volume 2014 http://www.hindawi.com http://www.hindawi.com Volume 2014 http://www.hindawi.com Volume 2014 http://www.hindawi.com Volume 2014You can also read