An Artificial Neural Network Prediction Model for Posttraumatic Epilepsy: Retrospective Cohort Study
←
→
Page content transcription
If your browser does not render page correctly, please read the page content below
JOURNAL OF MEDICAL INTERNET RESEARCH                                                                                                        Wang et al

     Original Paper

     An Artificial Neural Network Prediction Model for Posttraumatic
     Epilepsy: Retrospective Cohort Study

     Xueping Wang1, MD; Jie Zhong2, MD; Ting Lei3, MD; Deng Chen1, MD; Haijiao Wang1, MD; Lina Zhu1, MD;
     Shanshan Chu1, PhD; Ling Liu1, MD
     1
      Department of Neurology, West China Hospital, Sichuan University, Chengdu, China
     2
      Department of Ophthalmology, Sichuan Provincial People’s Hospital, Chengdu, China
     3
      Department of Neurosurgery, Shang Jin Nan Fu Hospital of West China Hospital, Sichuan University, Chengdu, China

     Corresponding Author:
     Ling Liu, MD
     Department of Neurology
     West China Hospital
     Sichuan University
     No. 37, Guo Xue Xiang
     Chengdu, 610041
     China
     Phone: 86 151 1705 8487
     Email: zjllxx1968@163.com

     Abstract
     Background: Posttraumatic epilepsy (PTE) is a common sequela after traumatic brain injury (TBI), and identifying high-risk
     patients with PTE is necessary for their better treatment. Although artificial neural network (ANN) prediction models have been
     reported and are superior to traditional models, the ANN prediction model for PTE is lacking.
     Objective: We aim to train and validate an ANN model to anticipate the risks of PTE.
     Methods: The training cohort was TBI patients registered at West China Hospital. We used a 5-fold cross-validation approach
     to train and test the ANN model to avoid overfitting; 21 independent variables were used as input neurons in the ANN models,
     using a back-propagation algorithm to minimize the loss function. Finally, we obtained sensitivity, specificity, and accuracy of
     each ANN model from the 5 rounds of cross-validation and compared the accuracy with a nomogram prediction model built in
     our previous work based on the same population. In addition, we evaluated the performance of the model using patients registered
     at Chengdu Shang Jin Nan Fu Hospital (testing cohort 1) and Sichuan Provincial People’s Hospital (testing cohort 2) between
     January 1, 2013, and March 1, 2015.
     Results: For the training cohort, we enrolled 1301 TBI patients from January 1, 2011, to December 31, 2017. The prevalence
     of PTE was 12.8% (166/1301, 95% CI 10.9%-14.6%). Of the TBI patients registered in testing cohort 1, PTE prevalence was
     10.5% (44/421, 95% CI 7.5%-13.4%). Of the TBI patients registered in testing cohort 2, PTE prevalence was 6.1% (25/413, 95%
     CI 3.7%-8.4%). The results of the ANN model show that, the area under the receiver operating characteristic curve in the training
     cohort was 0.907 (95% CI 0.889-0.924), testing cohort 1 was 0.867 (95% CI 0.842-0.893), and testing cohort 2 was 0.859 (95%
     CI 0.826-0.890). Second, the average accuracy of the training cohort was 0.557 (95% CI 0.510-0.620), with 0.470 (95% CI
     0.414-0.526) in testing cohort 1 and 0.344 (95% CI 0.287-0.401) in testing cohort 2. In addition, sensitivity, specificity, positive
     predictive values and negative predictors in the training cohort (testing cohort 1 and testing cohort 2) were 0.80 (0.83 and 0.80),
     0.86 (0.80 and 0.84), 91% (85% and 78%), and 86% (80% and 83%), respectively. When calibrating this ANN model, Brier
     scored 0.121 in testing cohort 1 and 0.127 in testing cohort 2. Compared with the nomogram model, the ANN prediction model
     had a higher accuracy (P=.01).
     Conclusions: This study shows that the ANN model can predict the risk of PTE and is superior to the risk estimated based on
     traditional statistical methods. However, the calibration of the model is a bit poor, and we need to calibrate it on a large sample
     size set and further improve the model.

     (J Med Internet Res 2021;23(8):e25090) doi: 10.2196/25090

     https://www.jmir.org/2021/8/e25090                                                                 J Med Internet Res 2021 | vol. 23 | iss. 8 | e25090 | p. 1
                                                                                                                      (page number not for citation purposes)
XSL• FO
RenderX
JOURNAL OF MEDICAL INTERNET RESEARCH Wang et al
KEYWORDS
artificial neural network; posttraumatic epilepsy; traumatic brain injury
Aim and Research Questions
Introduction
To date, no published papers have focused on predicting PTE
Background after TBI through ANN. To investigate this problem, we applied
Traumatic brain injuries (TBIs) reduce patient quality of life ANN to analyze demographic, clinical, and radiological data
and result in high morbidity and mortality [1]. TBI can also lead from TBI patients to achieve accurate prediction of PTE for
to a range of sequelae, the most common being posttraumatic individual patients, thereby recognizing PTE patients as early
epilepsy (PTE), which accounts for 4% to 9% of all epilepsy as possible, which might be helpful for further antiepileptogenic
cases [2-5]. Population-based and cohort studies estimate the intervention studies through identifying the suitable target
overall incidence of PTE ranges from 5% to 50%, especially population. In our previous study, we had built a nomogram
among war veterans, who receive more penetrating TBIs than model to predict PTE based on the same population, and we
civilians [6-12]. Previous literature concludes that the incidence wondered whether the ANN model outperformed it.
of PTE increases with the severity of TBI [5-7], and the vast
majority of PTE appears within the first 2 years after TBI and Methods
rises in the following 30 years [3,13].
Design
Because of the high incidence and adverse effects of PTE, The study had a retrospective cohort design, and the West China
clinicians need to identify and better manage those patients at Hospital of Sichuan University Ethics Committee approved this
high risk. PTE risk factors such as TBI severity, brain contusion, study (no. 2019-936). Subjects or their proxies gave informed
subdural hematoma, neurosurgery, and early posttraumatic verbal consent to participate in this study.
seizure (PTS) are reported by multiple regression methods, etc
[14-17]. These results are expressed as risk ratios or odds ratios, Participants
but they are inconvenient to use. A lot of TBI patients received This ANN predictive model was developed on a retrospective
antiepileptic prophylaxis to prevent PTE. While clinical trials registry of TBI patients at the West China Hospital (a tertiary
have shown that antiepileptic prophylaxis within 7 days of TBI referral center in Sichuan province, China) from January 1,
reduces the incidence of early seizure attacks, a reduction in 2011, to December 31, 2017. These subjects were the training
PTE has not been seen [18,19]. The negative results of these cohort. The model was also tested in 2 external cohorts
studies may be due to blind selection of the study population registered at Chengdu Shang Jin Nan Fu Hospital (testing cohort
and insufficient follow-up time. In addition, antiepileptic 1, n=421) and Sichuan Provincial People’s Hospital (testing
prophylaxis for patients with low risk would add financial cohort 2, n=413) between January 1, 2013, and March 1, 2015.
burden and side effects, so it is necessary for clinicians to All patients were diagnosed with TBI, which was defined as
identify those at high risk of PTE. However, so far there are no any hospital discharge with a primary or secondary diagnosis
reliable tools to predict the risk of PTE; if we can predict this of trauma to the head. According to the International Statistical
via the web, it will be of great significance in the realization of Classification of Diseases and Related Health Problems, Tenth
precision medicine [20]. Artificial neural network (ANN) is a Revision (ICD-10), patient records of those diagnosed with
form of artificial intelligence that can mimic the problem-solving traumatic brain injury (S06.902), cerebral concussion (S06.001),
process of the human brain and generate a mathematical subdural hematoma (S06.501), epidural hematoma (S06.401),
algorithmic model that can handle the nonlinear relationship traumatic subarachnoid hemorrhage (S06.601), skull fracture
between variables [21]. ANN is one of the most commonly used (liner or depressed fracture; S02.902), traumatic intracranial
methods of supervising machine learning, consisting of 3 layers hemorrhage (S06.806), brain contusion (S06.201), diffuse axonal
of neurons: an input layer of independent variables, a hidden injury (S06.204), and open or closed TBI (S06.911) were
layer for processing information, and an output layer for the extracted from the electronic medical record database.
probability of an outcome. ANN-based risk predictive models
have several advantages; they can capture nonlinear relationships We included all patients with complete demographic, clinical,
among input variables, making them ideal candidates for and radiological data to determine TBI, PTS, and PTE.
classifying complex diseases [22,23] such as identifying The inclusion criteria were (1) brain injury was caused by an
high-risk transient ischemic attack or minor stroke [24] and external force, (2) clinical diagnosis of TBI, (3) TBI occurred
assisting in precision medicine for COVID-19 [25]. Compared between January 1, 2011, and December 31, 2017, for West
with logistic regression models, ANN models can predict a China Hospital patients and for Chengdu Shang Jin Nan Fu
complex relationship between variables and are more accurate Hospital and Sichuan Provincial People’s Hospital patients from
in classifying the dependent variable [26]. January 1, 2013, to March 1, 2015, (4) complete trauma-related
data were available in medical records, and (5) patients or their
relatives agreed to participate in this study (Figure 1).
https://www.jmir.org/2021/8/e25090 J Med Internet Res 2021 | vol. 23 | iss. 8 | e25090 | p. 2
(page number not for citation purposes)
XSL• FO
RenderXJOURNAL OF MEDICAL INTERNET RESEARCH Wang et al
Figure 1. Study cohort. ANN: artificial neural network; TBI: traumatic brain injury
The following patients were excluded: (1) patients who had PTS and immediate PTS). Variables used to construct the
epilepsy or seizures before TBI; (2) patients who had a previous predictive model and how we defined and classified them are
TBI or had second or subsequent episodes of TBI; (3) patients listed in Table 1.
with other conditions that can cause seizure, such as
With the new definition proposed by the International League
cerebrovascular disease, brain tumors, encephalitis, brain
Against Epilepsy and the International Bureau for Epilepsy,
surgery, and other chronic diseases; (4) patients whose general
epilepsy requires at least 2 unprovoked (or reflex) seizures
condition was poor or who had other conditions that may lead
occurring more than 24 hours apart and one unprovoked (or
to epileptic seizures before PTS or PTE came out during
reflex) seizure and a probability of further seizures similar to
follow-up.
the general recurrence risk (at least 60%) after 2 unprovoked
Data and Data Collection seizures, occurring over the next 10 years [27]. PTS was defined
Formally trained neurologists extracted the necessary data for as a single, nonrecurrent convulsive episode that fits in 1 of 3
model building from the hospital records of patients. The table categories according to the time of seizure onset: immediate
included the general condition (age, sex, length of hospital stay, PTS, occurring in the first 24 hours following injury; early PTS,
previous history), the clinical and radiological data of TBI occurring more than 24 hours following injury and within 7
(mechanism of TBI, severity of TBI, clinical manifestations, days; and late PTS, occurring more than 1 week after trauma.
treatments, brain CT performed at initial presentation), and the In our study, PTE refers to one or more recurrent seizures
seizure onset information during their hospitalization (early occurring more than 1 week after TBI, including late PTS.
https://www.jmir.org/2021/8/e25090 J Med Internet Res 2021 | vol. 23 | iss. 8 | e25090 | p. 3
(page number not for citation purposes)
XSL• FO
RenderXJOURNAL OF MEDICAL INTERNET RESEARCH Wang et al
Table 1. Comparison of demographic data between the posttraumatic epilepsy and non–posttraumatic epilepsy patients in the training cohort.
Variable Total (n=1301) Non-PTEa (n=1135) PTE (n=166) P value
Demographic data —b — — —
Sex, male, n (%) 983 (75.6) 850 (74.6) 133 (82.6) .03
Age (years), mean (SD) 38.12 (23.82) 37.79 (24.4) 40.41 (19.09) .19
≤15, n (%) 297 (22.8) 77 (24.3) 20 (12.4)JOURNAL OF MEDICAL INTERNET RESEARCH Wang et al
Variable Total (n=1301) Non-PTEa (n=1135) PTE (n=166) P value
No 704 (54) 634 (55.6) 70 (43.5) —
Liner 487 (37.4) 408 (35.8) 79 (49.1) —
Depressed 110 (8.5) 98 (8.6) 12 (7.5) —
Open 79 (6.1) 68 (6) 11 (6.8) .60
PTSm and PTE, n (%) — — — —
IPTSn 13 (1) 11 (1) 2 (1.2) .87
EPTSo 74 (5.7) 39 (3.4) 35 (21.7)JOURNAL OF MEDICAL INTERNET RESEARCH Wang et al
to PTE as input variables and PTE as an output variable. Given We first obtained the model index from 5-fold cross-validation,
the small sample size, we used a 5-fold cross-validation to selected the hyperparameters through training, and then retrained
validate the ANN models to avoid overfitting [28,29]. The the full amount of training data with the optimal parameters of
training dataset was randomly divided into 5 folds, and we the optimal model. After many attempts, we finally identified
performed 5 rounds of training and validation of the ANN 43 (2 × 21 + 1) hidden neurons with 5000 training rounds to
models. During the 5-fold cross-validation process, 4 folds were train the entire training set. The model began to enter the
the training subsets and the remaining fold was the validation overfitting phase when the number of training rounds exceeded
subset, each of which was used only once as a validation set. 5000 epochs.
Figure 2. Optimal network architecture of the artificial neural network: a multilayer perceptron.
The test datasets are predicted for about 50 times using a trained
Step 2: Model Test
neural network, and the results of each prediction were recorded.
The predictive performance of the final ANN model was
evaluated using 2 external testing datasets (Shang Jin Nan Fu Evaluating Prediction Accuracy
Hospital and Sichuan Provincial People’s Hospital) unknown The performance of the ANN model was measured by its
to the training models. The testing datasets were used for final accuracy, sensitivity, specificity, positive predictive value
model evaluation after cross-validation process, model fit, and (PPV), and negative predictive value (NPV). Since the primary
probability calibration. After setting the ANN hyperparameters, outcome was a binary variable (PTE or not), area under the
we started to train the neural network with the full amount of receiver operating characteristic curve (ROC), referred to as
training data and stopped training after reaching 5000 times. AUC, was used to assess the accuracy of this predictive model.
https://www.jmir.org/2021/8/e25090 J Med Internet Res 2021 | vol. 23 | iss. 8 | e25090 | p. 6
(page number not for citation purposes)
XSL• FO
RenderXJOURNAL OF MEDICAL INTERNET RESEARCH Wang et al
The average precision, equivalent to the area under the patients from Shang Jin Nan fu Hospital were testing cohort 1,
precision-recall curve, was measured for evaluating model and the prevalence of PTE was 10.5% (44/421, 95% CI
performance. The 95% confidence intervals were determined 7.5%-13.4%). A total of 413 patients from Sichuan Provincial
by 50 rounds of model testing (random sampling in the test People’s Hospital were testing cohort 2, and the prevalence of
dataset, learning and verification, and then repeat multiple PTE was 6.1% (25/413, 95% CI 3.7%-8.4%). The prevalence
times). Model calibration was assessed in 2 testing cohorts by of PTE among 3 cohorts had significant difference (P=.001).
calculating Brier scores to examine how well the model
The comparison of demographic data, clinical manifestation,
predicting PTE frequencies matched the observed one.
and radiological results between the PTE- and non-PTE groups
Statistical analysis was performed using SPSS (version 22.0, in the training cohort was listed in Table 1. Significant
IBM Corp). Independent sample t tests were used to compare differences were found in many variables, including sex, age
quantitative data with a normal distribution; otherwise the group, length of hospital days, etiology of TBI, loss of
Mann-Whitney U test was applied. The results were presented consciousness time, treatment, subdural hematoma, intracranial
as mean and standard deviation or interquartile range. The hemorrhage, diffuse axonal injury, contusion load, contusion
incidence rates were expressed in percentile; to examine site, fracture, and early PTS (both PJOURNAL OF MEDICAL INTERNET RESEARCH Wang et al
Figure 3. Evaluation of artificial neural network prediction model accuracy using receiver operating characteristic. ANN: artificial neural network;
AUC: area under curve.
In addition, the average precision of the ANN prediction model 0.5, which did not mean that the prediction performance of the
in training cohort was 0.557 (95% CI 0.510-0.620), while the model was poor. An asymmetric data distribution (ie, the number
average precision was 0.470 (95% CI 0.414-0.526) in testing of negative, or non-PTE, events is much more than the number
cohort 1 and 0.344 (95% CI 0.287-0.401) in testing cohort 2 of positive, or PTE, events) leads to a low overall decrease in
(Figure 4). Similar to AUC, the larger the average precision average precision and will have a great impact on the
value, the better the prediction accuracy. However, unlike the precision-recall curve but no effect on the AUC curve [31].
ROC, the area under the precision-recall curve was less than
https://www.jmir.org/2021/8/e25090 J Med Internet Res 2021 | vol. 23 | iss. 8 | e25090 | p. 8
(page number not for citation purposes)
XSL• FO
RenderXJOURNAL OF MEDICAL INTERNET RESEARCH Wang et al
Figure 4. Evaluation of the artificial neural network prediction model accuracy using precision-recall curves. ANN: artificial neural network; AP:
average precision.
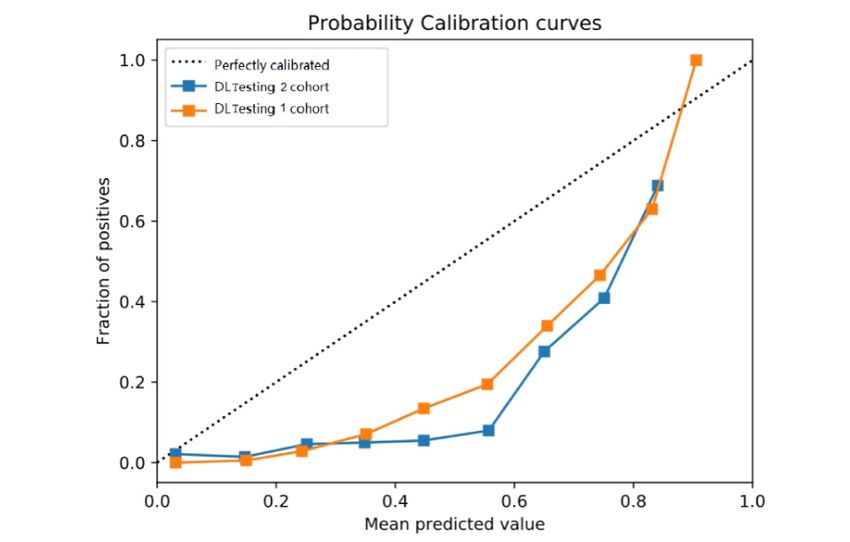
Brier scores were calculated to evaluate the calibration of the observed rate of PTE. The diagonal curve represents a perfectly
ANN prediction model. With the Brier score, we can know the calibrated prediction, and the calibration curve should be as
calibration of the prediction model [32]. It ranges from 0 to 1; close to this diagonal curve as possible. In our study, the
the lower the Brier score, the better the calibration, so the ideal calibration curves in the 2 testing groups were a little far away
Brier score is 0, indicating the prediction is completely accurate from the diagonal curve, and we needed to calibrate this ANN
[33]. When testing our ANN prediction model, the Brier scores prediction model with a large-sample dataset. Table 2 showed
were 0.121 in testing cohort 1 and 0.127 in testing cohort 2. the performances of the ANN model on the training and 2 testing
Figure 5 shows the calibration plots that compare the proportion sets.
of PTE patients predicted by the ANN model with the actual
https://www.jmir.org/2021/8/e25090 J Med Internet Res 2021 | vol. 23 | iss. 8 | e25090 | p. 9
(page number not for citation purposes)
XSL• FO
RenderXJOURNAL OF MEDICAL INTERNET RESEARCH Wang et al
Figure 5. Risk calibration curves for artificial neural network prediction model in two testing cohorts. A curve closer to the dotted diagonal line indicates
better calibration, with corresponding lower Brier score. ANN: artificial neural network.
Table 2. Performances of artificial neural network on training and two testing sets.
Indicator Training cohort Testing cohort 1 Testing cohort 2
AUCa (95% CI) 0.907 (0.889-0.924) 0.867 (0.842-0.893) 0.859 (0.826-0.890)
Sensitivity 0.80 0.83 0.80
Specificity 0.86 0.80 0.84
b 0.557 (0.510-0.620) 0.470 (0.414-0.526) 0.344 (0.287-0.401)
AP (95% CI)
PPVc, % 91 85 78
NPVd, % 86 80 83
Brier score —e 0.121 0.127
a
AUC: area under the curve.
b
AP: average precision.
c
PPV: positive predictive value.
d
NPV: negative predictive value.
e
Not applicable.
0.889-0.924; P=.01), which indicated the ANN model had a
Compared With Nomogram Prediction Model higher prediction accuracy.
In our previous work, we built a nomogram model to predict
the risk of PTE with the same training cohort through R Discussion
statistical analysis [30]. The AUC of this nomogram prediction
model was 0.859 (95% CI 0.826-0.891) and sensitivity and Principal Findings
specificity were 0.867 and 0.738, respectively. Compared with ANN is applied to develop a risk prediction model and is
the traditional nomogram prediction model, the AUC value of superior to traditional prediction models. In this study, we
the ANN prediction model was higher (0.907, 95% CI developed a PTE predictive model using ANN methods, which
involved 21 predictors (listed in Table 1). In the training cohort,
https://www.jmir.org/2021/8/e25090 J Med Internet Res 2021 | vol. 23 | iss. 8 | e25090 | p. 10
(page number not for citation purposes)
XSL• FO
RenderXJOURNAL OF MEDICAL INTERNET RESEARCH Wang et al
the ANN model had an accuracy of 0.907, average precision of population. In our study, we input 21 variables into the ANN
0.557, sensitivity of 0.80, specificity of 0.86, PPV of 91%, and model to predict the risk of PTE; all of these variables were
NPV of 86%. For testing cohort 1 (testing cohort 2), this model mentioned in previous studies, while only some factors were
had an accuracy of 0.867 (0.859), average precision of 0.470 considered as predictors of PTE by logistic regression. The
(0.344), sensitivity of 0.83 (0.80), specificity of 0.80 (0.84), ANN method has the advantage of feature selection over
PPV of 85% (78%), NPV of 80% (83%), and Brier score 0.121 conventional statistical methods; when more factors are taken
(0.127), suggesting that this ANN model was valuable. To our into account, the prediction is more accurate.
knowledge, this is also the first study to develop a
high-performance PTE-predictive ANN model based on other
Impact of the ANN Model in the Future
studies and risk factors available in clinical practice. The ANN model has higher prediction accuracy and can
contribute to future clinical decisions. It helps clinicians identify
Advantages of the ANN Model patients with high risk of PTE, so doctors follow them more
ANN models are able to model nonlinear relationships between closely after discharge and follow up more frequently for more
input and output variables in a high-dimensional dataset and precise personal management. Furthermore, the new model is
select the optimal model with high accuracy. ANN models have also conducive to the selection of the target group for PTE
been widely used to predict the occurrence of hypertension [34] prevention study. For example, by applying presumed data, a
and mortality in patients with stroke [35]. ANN models excelled provider could estimate a TBI patient’s risk of PTE in the future.
in many ways compared to conventional statistical methods; By studying the high-risk population predicted by the ANN
for example, they have higher classification accuracy and a model, it may be easier to find useful preventive measures. In
better ability to analyze nonlinear relations and handle correlated addition, the ANN model can help clinicians conduct some trials
independent variables [26]. on antiepileptic drug withdrawal. If according to the ANN
model, the patient’s PTE risk is low and meets the withdrawal
Existing PTE prediction models are mainly risk scoring models
criteria, the clinician may try to withdraw the patient’s
built by traditional statistical methods. In our previous work,
antiepileptic drug, which will reduce the financial burden and
we set up a nomogram model to predict the risk of PTE. This
adverse effects of antiepileptic drugs.
model consisted of 7 risk factors (sex, TBI severity, duration
of loss of consciousness time, subdural hematoma, early PTS, Limitations
contusion site, and treatment) found in multivariable Cox However, there were some limitations to this study. First, we
proportional hazards regression analysis based on the same developed the ANN model using epidemiological data, mainly
training cohort (West China Hospital). Our results showed that including demographic data, clinical manifestation, and
the AUC of this nomogram prediction model was 0.859 (95% radiological results, regardless of relevant laboratory data such
CI 0.826-0.891), lower than the ANN model. In addition, with as electroencephalogram. Second, this was a retrospective study
multivariable logistic regression and based on 9 significant risk that was prone to bias, and some of the factors in other studies
factors (subdural hematoma, contusion load, craniotomy, have not been collected, such as whether a patient was mentally
craniectomy, seizure during acute hospitalization, duration of ill. Third, most of the factors included were dichotomous
posttraumatic amnesia, preinjury mental health variables rather than continuous variables. The lack of
treatment/psychiatric hospitalization, intraparenchymal dose-response relationship between exposure levels of these
fragment, and preinjury incarceration), Ritter et al [36] risk factors and PTE may not reveal their true relationships with
constructed prognostic models to predict PTS during different PTE. Fourth, the ANN model relied more on computers and
times following TBI. Their results indicated that the corrected specific programs, so its application was not as convenient and
concordance statistics (equal to AUC) were 0.599, 0.747, and simple as nomogram models for the clinicians [37].
0.716 for acute hospitalization, year 1, and year 2 models,
respectively. In our study, we established an ANN model for Despite these shortcomings, as far as we know, this is the first
PTE prediction using comprehensive data from training and 2 study using ANN to predict the risk of PTE after TBI. Our
sets of tests that achieved AUC of 0.907, 0.867, and 0.859, results indicated that ANN analysis may be more accurate in
respectively, higher than the existing models. In addition, Ritter predicting the incidence of PTE for individual patients than
et al [36] tested their model against subjects selected in bootstrap traditional statistical methods, and therefore the ANN model
samples, while our ANN model was tested by the other 2 cohorts could help determine the use of antiepileptic drugs for individual
who were unaware of the training process. Our prediction model TBI patients.
outperforms the abovementioned predictive models built by
Conclusions
logistic regression method, which suggests that the ANN models
have superiority and rationality in solving complex nonlinear In conclusion, our study was the first one to develop an ANN
relationships. with a higher level of accurate prediction of PTE than the
nomogram prediction model and other models constructed by
The new ANN model based on demographic and clinical data multilogical regression. With the new ANN model, we can
can be used as a simple screening tool to identify individuals identify TBI patients at high risk of PTE as early as possible,
at high risk of PTE after TBI. The predictors included in the and the model-predicted risk probability is significant for the
model are common and available in routine practice. Beyond selection of study population to determine the beneficial
that, this model was tested by 2 cohorts and its performance prevention and management of these PTE patients.
was good, indicating that it might be applicable to the general
https://www.jmir.org/2021/8/e25090 J Med Internet Res 2021 | vol. 23 | iss. 8 | e25090 | p. 11
(page number not for citation purposes)
XSL• FO
RenderXJOURNAL OF MEDICAL INTERNET RESEARCH Wang et al
Acknowledgments
This study was funded by grant 2019HXFH048 from the 1·3·5 Project for Disciplines of Excellence–Clinical Research Incubation
Project, West China Hospital, Sichuan University, and grant 2021YFS0174 from the Science & Technology Department of
Sichuan Province.
Authors' Contributions
LL had full access to the data and takes responsibility for the integrity of the data and the accuracy of the data analysis. LL, JZ,
TL, and XW were responsible for the concept and design of the study. XW, HW, SC, LZ, and DC were responsible for acquisition,
analysis, and interpretation of the data. DC and XW performed model training and testing. XW drafted the manuscript. DC tested
and trained the ANN model.
Conflicts of Interest
None declared.
References
1. Pickelsimer EE, Selassie AW, Gu JK, Langlois JA. A population-based outcomes study of persons hospitalized with
traumatic brain injury: operations of the South Carolina Traumatic Brain Injury Follow-up Registry. J Head Trauma Rehabil
2006;21(6):491-504. [doi: 10.1097/00001199-200611000-00004] [Medline: 17122680]
2. Hauser WA, Annegers JF, Kurland LT. Incidence of epilepsy and unprovoked seizures in Rochester, Minnesota: 1935-1984.
Epilepsia 1993;34(3):453-468. [doi: 10.1111/j.1528-1157.1993.tb02586.x] [Medline: 8504780]
3. Annegers JF, Hauser WA, Coan SP, Rocca WA. A population-based study of seizures after traumatic brain injuries. N Engl
J Med 1998 Jan 01;338(1):20-24. [doi: 10.1056/NEJM199801013380104] [Medline: 9414327]
4. Englander J, Bushnik T, Duong TT, Cifu DX, Zafonte R, Wright J, et al. Analyzing risk factors for late posttraumatic
seizures: a prospective, multicenter investigation. Arch Phys Med Rehabil 2003 Mar;84(3):365-373. [doi:
10.1053/apmr.2003.50022] [Medline: 12638104]
5. Christensen J, Pedersen MG, Pedersen CB, Sidenius P, Olsen J, Vestergaard M. Long-term risk of epilepsy after traumatic
brain injury in children and young adults: a population-based cohort study. Lancet 2009 Mar 28;373(9669):1105-1110.
[doi: 10.1016/S0140-6736(09)60214-2] [Medline: 19233461]
6. Angeleri F, Majkowski J, Cacchiò G, Sobieszek A, D'Acunto S, Gesuita R, et al. Posttraumatic epilepsy risk factors: one-year
prospective study after head injury. Epilepsia 1999 Sep;40(9):1222-1230 [FREE Full text] [doi:
10.1111/j.1528-1157.1999.tb00850.x] [Medline: 10487184]
7. Asikainen I, Kaste M, Sarna S. Early and late posttraumatic seizures in traumatic brain injury rehabilitation patients: brain
injury factors causing late seizures and influence of seizures on long-term outcome. Epilepsia 1999 May;40(5):584-589
[FREE Full text] [doi: 10.1111/j.1528-1157.1999.tb05560.x] [Medline: 10386527]
8. Armstrong KK, Sahgal V, Bloch R, Armstrong KJ, Heinemann A. Rehabilitation outcomes in patients with posttraumatic
epilepsy. Arch Phys Med Rehabil 1990 Feb;71(2):156-160. [Medline: 2105709]
9. De Santis A, Sganzerla E, Spagnoli D, Bello L, Tiberio F. Risk factors for late posttraumatic epilepsy. Acta neurochirurgica
Supplementum 1992;55:64-67. [doi: 10.1007/978-3-7091-9233-7_17] [Medline: 1414548]
10. Haltiner AM, Temkin NR, Dikmen SS. Risk of seizure recurrence after the first late posttraumatic seizure. Arch Phys Med
Rehabil 1997 Aug;78(8):835-840. [doi: 10.1016/s0003-9993(97)90196-9] [Medline: 9344302]
11. Salazar AM, Schwab K, Grafman JH. Penetrating injuries in the Vietnam war. Traumatic unconsciousness, epilepsy, and
psychosocial outcome. Neurosurg Clin N Am 1995 Oct;6(4):715-726. [Medline: 8527913]
12. Weiss GH, Feeney DM, Caveness WF, Dillon D, Kistler JP, Mohr JP, et al. Prognostic factors for the occurrence of
posttraumatic epilepsy. Arch Neurol 1983 Jan;40(1):7-10. [doi: 10.1001/archneur.1983.04050010027006] [Medline:
6848098]
13. Rao VR, Parko KL. Clinical approach to posttraumatic epilepsy. Semin Neurol 2015 Feb;35(1):57-63. [doi:
10.1055/s-0035-1544239] [Medline: 25714868]
14. Yeh C, Chen T, Hu C, Chiu W, Liao C. Risk of epilepsy after traumatic brain injury: a retrospective population-based
cohort study. J Neurol Neurosurg Psychiatry 2013 Apr;84(4):441-445. [doi: 10.1136/jnnp-2012-302547] [Medline: 23117492]
15. Emanuelson I, Uvebrant P. Occurrence of epilepsy during the first 10 years after traumatic brain injury acquired in childhood
up to the age of 18 years in the south western Swedish population-based series. Brain Inj 2009 Jul;23(7):612-616. [doi:
10.1080/02699050902973913] [Medline: 19557563]
16. Tubi MA, Lutkenhoff E, Blanco MB, McArthur D, Villablanca P, Ellingson B, et al. Early seizures and temporal lobe
trauma predict post-traumatic epilepsy: a longitudinal study. Neurobiol Dis 2019 Mar;123:115-121 [FREE Full text] [doi:
10.1016/j.nbd.2018.05.014] [Medline: 29859872]
17. Zhao Y, Wu H, Wang X, Li J, Zhang S. Clinical epidemiology of posttraumatic epilepsy in a group of Chinese patients.
Seizure 2012 Jun;21(5):322-326 [FREE Full text] [doi: 10.1016/j.seizure.2012.02.007] [Medline: 22425008]
https://www.jmir.org/2021/8/e25090 J Med Internet Res 2021 | vol. 23 | iss. 8 | e25090 | p. 12
(page number not for citation purposes)
XSL• FO
RenderXJOURNAL OF MEDICAL INTERNET RESEARCH Wang et al
18. Kruer RM, Harris LH, Goodwin H, Kornbluth J, Thomas KP, Slater LA, et al. Changing trends in the use of seizure
prophylaxis after traumatic brain injury: a shift from phenytoin to levetiracetam. J Crit Care 2013 Oct;28(5):883-913. [doi:
10.1016/j.jcrc.2012.11.020] [Medline: 23566730]
19. Thompson K, Pohlmann-Eden B, Campbell LA, Abel H. Pharmacological treatments for preventing epilepsy following
traumatic head injury. Cochrane Database Syst Rev 2015 Aug 10(8):CD009900. [doi: 10.1002/14651858.CD009900.pub2]
[Medline: 26259048]
20. Agarwal V, Zhang L, Zhu J, Fang S, Cheng T, Hong C, et al. Impact of predicting health care utilization via web search
behavior: a data-driven analysis. J Med Internet Res 2016 Sep 21;18(9):e251 [FREE Full text] [doi: 10.2196/jmir.6240]
[Medline: 27655225]
21. Manning T, Sleator RD, Walsh P. Biologically inspired intelligent decision making: a commentary on the use of artificial
neural networks in bioinformatics. Bioengineered 2014;5(2):80-95 [FREE Full text] [doi: 10.4161/bioe.26997] [Medline:
24335433]
22. Tekkeşin A. Artificial intelligence in healthcare: past, present and future. Anatol J Cardiol 2019 Oct;22(Suppl 2):8-9 [FREE
Full text] [doi: 10.14744/AnatolJCardiol.2019.28661] [Medline: 31670713]
23. Tu JV. Advantages and disadvantages of using artificial neural networks versus logistic regression for predicting medical
outcomes. J Clin Epidemiol 1996 Nov;49(11):1225-1231. [doi: 10.1016/s0895-4356(96)00002-9] [Medline: 8892489]
24. Chan KL, Leng X, Zhang W, Dong W, Qiu Q, Yang J, et al. Early identification of high-risk TIA or minor stroke using
artificial neural network. Front Neurol 2019;10:171 [FREE Full text] [doi: 10.3389/fneur.2019.00171] [Medline: 30881336]
25. Santus E, Marino N, Cirillo D, Chersoni E, Montagud A, Santuccione Chadha A, et al. Artificial intelligence-aided precision
medicine for COVID-19: strategic areas of research and development. J Med Internet Res 2021 Mar 12;23(3):e22453
[FREE Full text] [doi: 10.2196/22453] [Medline: 33560998]
26. Renganathan V. Overview of artificial neural network models in the biomedical domain. Bratisl Lek Listy
2019;120(7):536-540. [doi: 10.4149/BLL_2019_087] [Medline: 31602991]
27. Fisher RS, Acevedo C, Arzimanoglou A, Bogacz A, Cross JH, Elger CE, et al. ILAE official report: a practical clinical
definition of epilepsy. Epilepsia 2014 Apr;55(4):475-482 [FREE Full text] [doi: 10.1111/epi.12550] [Medline: 24730690]
28. Bentley P, Ganesalingam J, Carlton Jones AL, Mahady K, Epton S, Rinne P, et al. Prediction of stroke thrombolysis outcome
using CT brain machine learning. Neuroimage Clin 2014;4:635-640 [FREE Full text] [doi: 10.1016/j.nicl.2014.02.003]
[Medline: 24936414]
29. Zhou Z, Folkert M, Cannon N, Iyengar P, Westover K, Zhang Y, et al. Predicting distant failure in early stage NSCLC
treated with SBRT using clinical parameters. Radiother Oncol 2016 Jun;119(3):501-504 [FREE Full text] [doi:
10.1016/j.radonc.2016.04.029] [Medline: 27156652]
30. Wang X, Zhong J, Lei T, Wang H, Zhu L, Chu S, et al. Development and external validation of a predictive nomogram
model of posttraumatic epilepsy: a retrospective analysis. Seizure 2021 May;88:36-44. [doi: 10.1016/j.seizure.2021.03.023]
[Medline: 33812306]
31. Davis J, Goadrich M. The relationship between precision-recall and ROC curves. Proc 23rd Int Conf Mach Learn
2006:233-240. [doi: 10.1145/1143844.1143874]
32. Brier GW. Verification of forecasts expressed in terms of probability. Mon Wea Rev 1950 Jan;78(1):1-3. [doi:
10.1175/1520-0493(1950)0782.0.co;2]
33. Steyerberg EW, Harrell FE, Borsboom GJ, Eijkemans MJ, Vergouwe Y, Habbema JD. Internal validation of predictive
models: efficiency of some procedures for logistic regression analysis. J Clin Epidemiol 2001 Aug;54(8):774-781. [doi:
10.1016/s0895-4356(01)00341-9] [Medline: 11470385]
34. Huang S, Xu Y, Yue L, Wei S, Liu L, Gan X, et al. Evaluating the risk of hypertension using an artificial neural network
method in rural residents over the age of 35 years in a Chinese area. Hypertens Res 2010 Jul;33(7):722-726. [doi:
10.1038/hr.2010.73] [Medline: 20505678]
35. Çelik G, Baykan, Kara Y, Tireli H. Predicting 10-day mortality in patients with strokes using neural networks and multivariate
statistical methods. J Stroke Cerebrovasc Dis 2014 Jul;23(6):1506-1512. [doi: 10.1016/j.jstrokecerebrovasdis.2013.12.018]
[Medline: 24674954]
36. Ritter AC, Wagner AK, Szaflarski JP, Brooks MM, Zafonte RD, Pugh MJV, et al. Prognostic models for predicting
posttraumatic seizures during acute hospitalization, and at 1 and 2 years following traumatic brain injury. Epilepsia 2016
Sep;57(9):1503-1514 [FREE Full text] [doi: 10.1111/epi.13470] [Medline: 27430564]
37. Gotto GT, Yu C, Bernstein M, Eastham JA, Kattan MW. Development of a nomogram model predicting current bone scan
positivity in patients treated with androgen-deprivation therapy for prostate cancer. Front Oncol 2014;4:296 [FREE Full
text] [doi: 10.3389/fonc.2014.00296] [Medline: 25386410]
Abbreviations
ANN: artificial neural network
AUC: area under the curve
ICD-10: International Statistical Classification of Diseases and Related Health Problems, Tenth Revision
https://www.jmir.org/2021/8/e25090 J Med Internet Res 2021 | vol. 23 | iss. 8 | e25090 | p. 13
(page number not for citation purposes)
XSL• FO
RenderXJOURNAL OF MEDICAL INTERNET RESEARCH Wang et al
NPV: negative predictive value
PPV: positive predictive value
PTE: posttraumatic epilepsy
PTS: posttraumatic seizure
ROC: receiver operating characteristic curve
TBI: traumatic brain injury
Edited by R Kukafka; submitted 16.10.20; peer-reviewed by L Zhang, M Sotiropoulos; comments to author 26.02.21; revised version
received 14.04.21; accepted 25.04.21; published 19.08.21
Please cite as:
Wang X, Zhong J, Lei T, Chen D, Wang H, Zhu L, Chu S, Liu L
An Artificial Neural Network Prediction Model for Posttraumatic Epilepsy: Retrospective Cohort Study
J Med Internet Res 2021;23(8):e25090
URL: https://www.jmir.org/2021/8/e25090
doi: 10.2196/25090
PMID: 34420931
©Xueping Wang, Jie Zhong, Ting Lei, Deng Chen, Haijiao Wang, Lina Zhu, Shanshan Chu, Ling Liu. Originally published in
the Journal of Medical Internet Research (https://www.jmir.org), 19.08.2021. This is an open-access article distributed under the
terms of the Creative Commons Attribution License (https://creativecommons.org/licenses/by/4.0/), which permits unrestricted
use, distribution, and reproduction in any medium, provided the original work, first published in the Journal of Medical Internet
Research, is properly cited. The complete bibliographic information, a link to the original publication on https://www.jmir.org/,
as well as this copyright and license information must be included.
https://www.jmir.org/2021/8/e25090 J Med Internet Res 2021 | vol. 23 | iss. 8 | e25090 | p. 14
(page number not for citation purposes)
XSL• FO
RenderXYou can also read