Dynamic Silos: Modularity in intra-organizational communication networks during the Covid-19 pandemic
←
→
Page content transcription
If your browser does not render page correctly, please read the page content below

Dynamic Silos: Modularity in intra-organizational
                                          communication networks during the Covid-19
                                          pandemic
                                          Jonathan Larson1 , Tiona Zuzul2 , Emily Cox Pahnke3 , Neha Parikh Shah4 , Patrick
                                          Bourke5 , Nicholas Caurvina6 , Fereshteh Amini7 , Youngser Park8 , Joshua Vogelstein9 ,
                                          Jeffrey Weston10 , Christopher White11 , and Carey E. Priebe12
                                          1 Microsoft Research
arXiv:2104.00641v3 [stat.ML] 1 May 2021

                                          2 University of Washington Foster School of Business
                                          3 University of Washington Foster School of Business
                                          4 Microsoft
                                          5 Microsoft Research
                                          6 Microsoft Research
                                          7 Microsoft
                                          8 Johns Hopkins University
                                          9 Johns Hopkins University
                                          10 Microsoft
                                          11 Microsoft Research
                                          12 Johns Hopkins University
                                          * cep@jhu.edu

                                          ABSTRACT

                                          Workplace communications around the world were drastically altered by Covid-19, work-from-home orders, and the rise of
                                          remote work. We analyze aggregated, anonymized metadata from over 360 billion emails within over 4000 organizations
                                          worldwide to examine changes in network community structures from 2019 through 2020. We find that, during 2020,
                                          organizations around the world became more siloed, evidenced by increased modularity. This shift was concurrent with
                                          decreased stability, indicating that organizational siloes had less stable membership. We provide initial insights into the
                                          implications of these network changes – which we term dynamic silos – for organizational performance and innovation.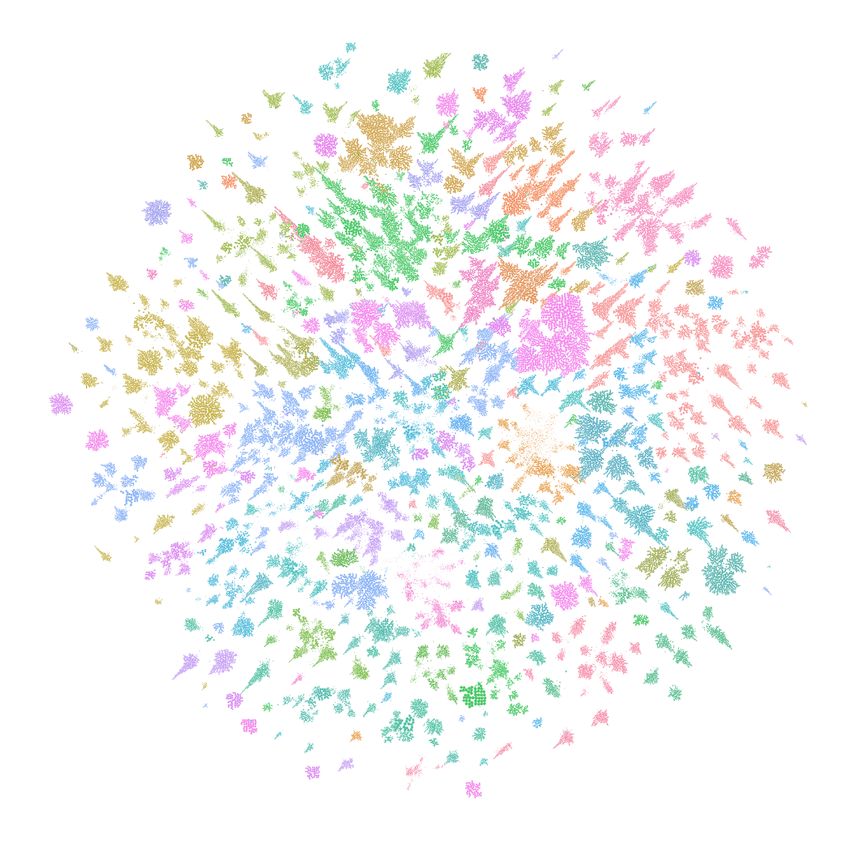
1 Introduction
How has the Covid-19 pandemic altered intra-organizational communication networks? To answer this question, we analyze
data on 362 billion aggregated email receipts between more than 1.4 billion email accounts in 4361 organizations across
multiple countries/regions during 2019 and 2020† . We examine both the volume of emails between employees in the same
organization, and the network structures that can be observed from their exchange1 . We find that, in the spring of 2020, the
volume of emails increased globally, but stayed the same or even decreased within some organizations. At the same time,
organizations across the globe became more siloed, as evidenced by increased modularity. The promise of remote work is
that it expands the boundaries of who can communicate with whom, and should therefore facilitate more connectedness in
organizations. Yet changes in monthly modularity — considered in conjunction with shifts in the adjusted Rand index (ARI), a
measure of the stability of community structures — suggest that as employees moved to remote work in response to Covid-19,
intra-organizational email communication networks became more siloed. We conceptualize these shifts as dynamic silos, and
discuss the implications of our findings -– the idea that small world communities within companies became more siloed in
response to Covid-19 -– for organizational performance and innovation around the globe2 .
      Organizational communication networks facilitate essential exchanges of information and support. Covid created exceptional
circumstances that disrupted work in many ways never before observed on such a scale. Shifting ways of working – driven by
Covid-related changes such as widespread stay at home orders and increased corporate support for remote work – radically
altered the ways that employees communicated with each other. By identifying patterns in who communicates with whom,
we can identify network structures within an organization and how they changed during the pandemic. One measure of the
structure within a network is modularity. Modularity captures the strength of division of a network into communities, or the
extent to which a network structure exhibits siloing. Highly modular networks are one form of small worlds2 . At high levels of
modularity, networks display well defined silos that are largely separated from others. At low levels, networks display less-well
defined communities, and greater levels of connectivity across the overall network.
      Modularity3–5 is defined as Q(G) = maxτ L1 ∑u,v∈V (Au,v − duLdv )I{τi = τ j } where A denotes the adjacency matrix, dv denotes
the vertex degree, L = ∑v dv , and τ ∈ [K]n encodes a network partition assigning n vertices to K communities. The Leiden
algorithm6 is used to find a network partition that approximately maximizes the modularity function.
      We also consider ARI7 . Given a network on the same set of n nodes at two different times, Gt and Gt 0 , and    letting Pt and
Pt 0 be partitions of the two networks into communities, the Rand index is defined as RI(Gt , Gt 0 ) = (a + b)/ n2 where a is the
number of pairs of nodes that are in the same subset in both Pt and Pt 0 and b is the number of pairs of nodes that are in different
subsets in both partitions. ARI adjusts this measure for chance, so that ARI ≈ 0 indicates that which nodes cluster together is
essentially chance across the two networks, while ARI ≈ 1 indicates that individual nodes’ community memberships are stable
across the two networks. We calculate ARI using the maximum modularity partitions.
      While dynamic network structure is a complicated concept, we can begin to understand the interplay between modularity
and ARI by considering simplified cases. For example, in stochastic blockmodels8 (SBMs) with both the number and the size
of the blocks held constant, an increase in Q together with a small value of ARI implies (1) more clearly delineated groups
together with (2) significant group membership churn.
      Consider two graphs, G1 and G2 . Both are SBMs with K = 2 blocks, n = 20 vertices, and 10 vertices per block; the only
difference is in the block connectivity matrices B1 and B2 , which are of the form [b11 , b12 ; b21 , b22 ]. Furthermore, we assume
the within-block connectivities b11 = b22 = 0.50 for both B1 and B2 , but the between-block connectivity is b12 = b21 = 0.15
for B1 decreasing to 0.05 for B2 . In this case, the network structure measure modularity Q(G2 ) is larger than Q(G1 ):
Q(G1 ) = 0.400 ± 0.035 vs. Q(G2 ) = 0.266 ± 0.035. If also we assume that the block memberships are altered such that two of
the ten members of block one from G1 switch to block two in G2 , replaced by two from G1 ’s block two moving to G2 ’s block
one, then the block membership stability measure ARI(G1 , G2 ) = 0.324. This behavior is illustrated in Figure 1: the modularity
increase indicates fracturing of the internal community structure, and the corresponding decrease in stability indicates that the
communities themselves experience membership churn.
      Organizational scholars have identified consistently high levels of modularity (.60-.75) in the collaboration networks of
firms in the television9 , microelectronics10 , computing11, 12 , and Biotech/Pharma10 industries. These findings indicate that
inter-organizational networks are characterized by well-defined communities.
      To our knowledge, prior research has not measured modularity in intra-organizational communication networks and has not
examined how modularity shifts over time. We attribute this gap to data limitations, as a comparative and dynamic analysis
of network structure requires longitudinal data within and across many organizations. The breadth and scope of our data
provides unprecedented insight into intra-organizational network structures around the world and over time. We find that
modularity within companies is relatively stable and high across geographies: modularity ranges from 0.66-0.69 in Canada to
    † We analyzed workplace trends that were anonymized by aggregating the data broadly. We never observe nor use customer content – such as information

within an email – in the data analysis. All personal and organization-identifying information, such as company name, were removed from the data before
analysis.

                                                                                                                                                  2/19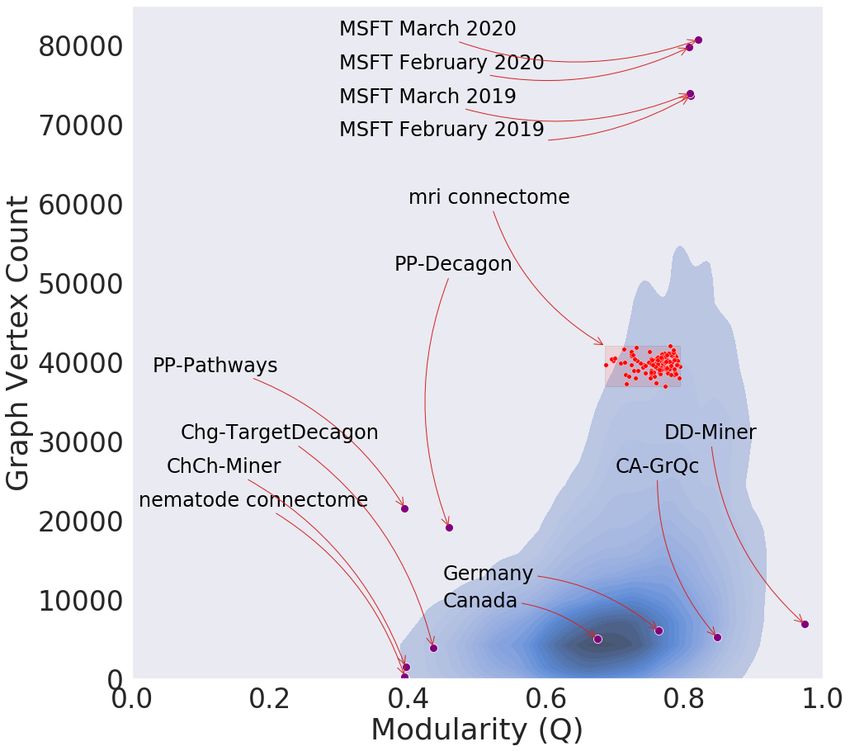
12                                                                          14
                                                                                                                                         15
                                                                                                                            18
           19                                                                                           19             20
                     15                                                                                                              9

                                                          4                                              13        11
                                   18       16                                                                                   5
    20                                                                            17

                 11
                              13                     10
                                                                                                              16
  17
                                                              5               2                 4
                14                          2        8
                                                 1                                                  8
                                                                         6         7                               1
                                   3
                                                                                           12
                          9                                             10
                                        6                 7                            3

Figure 1. Illustrative network change example. Depicted is a network observed at two time points, G1 (left) and G2 (right),
representing two time points for a single organization, each with twenty nodes and two communities. The vertex colors denote
block membership in G1 , so we can see that two vertices change communities. The shaded communities are the Leiden-derived
maximum modularity communities. The two networks have the same within-community connectivity but G2 has lower
between-community connectivity (fewer red edges) than G1 ; the network structure measure modularity yields
Q(G2 ) = 0.41 > Q(G1 ) = 0.30 indicating fracturing of the internal community structure. Furthermore, community
membership of some nodes changes from G1 to G2 ; the community membership stability measure ARI(G1 , G2 ) = 0.324
indicating that the communities themselves experience membership churn. The intra-organizational networks we consider,
while vastly more complex, exhibit similar behavior coincident with the onset of Covid-19.

0.75-0.77 in Germany, and 50% of all organizations fall within the 0.64-0.77 range. But, by overlaying monthly modularity
from 2019 with 2020, we also observe that modularity increased within organizations in the spring of 2020. To better understand
this shift in modularity, we also examine changes in community stability (ARI). Together, our data indicate that – despite
baseline differences in network structures – intra-organizational email communication networks across the world became more
dynamically siloed following Covid-19.

                                                                                                                                         3/19
2 Network time series data
A network or graph G consists of a vertex set V of actors and an edge set E of interactions: G = (V, E). We consider undirected
and weighted networks, so each edge e ∈ E is a pair (u, v) ∈ V × V together with a scalar weight we ∈ ℜ. The networks
considered herein are human communication graphs as observed in an organizational context. We begin with anonymized
communications data for approximately 100,000 organizations over a period of 29 months, from Jul 2018 through Nov 2020
– a total of approximately 450 billion email receipts. For this analysis, we use aggregated monthly email communication to
define our networks. For each organization i and each month t, we construct an undirected weighted edge (u, v) with the weight
wi,t,(u,v) being the total number of messages observed between accounts u and v. (To filter out company-wide messages and
broader communications, no email with more than 4 recipients is considered† . In addition, we eliminate self-loops: edges
from u to u are ignored.) This edge definition induces a undirected weighted graph from which we extract the largest (weakly)
connected component, denoted Gi,t = (Vi,t , Ei,t ) where Vi,t is the collection of accounts and edge (u, v) ∈ Ei,t indicates that
accounts u and v had at least one message between them. We restrict attention to only those organizations i with |Vi,t | > 2000
for all t, yielding 4,361 organization network time series and a total of 4361 · 29 = 126, 469 organization-month networks
including a total of approximately 362 billion email receipts. By construction, all networks have at least 2000 nodes; the largest
networks have approximately 500,000 nodes. We also investigate a separate organization, Microsoft (MSFT), with networks
defined the same way for Jan 2019 through Dec 2020. MSFT is one of the larger organizations, with approximately 80,000
nodes in the monthly largest connected components. Analyzing the data was computationally intensive and required the use of
large scale distributed compute infrastructure; in all, it took over 55,000 compute hours for clustered machines to process the
email data.
For illustration, Figure 2 presents a network map of MSFT for Mar 2020. The figure shows the entire organization
(n = 80, 690) with modularity QMSFT,MAR2020 = 0.82 (top), along with top-level sub-organizations with high modularity
Q = 0.85 (bottom left) and low modularity Q = 0.79 (bottom right).
Figure 3 provides a histogram summarizing the modularity Q(Gi,t ) for all 126,469 organization-month networks. Figure
3 also includes two country/region-specific histograms (Canada and Germany), showing clearly that country/region is a
confounder in this overall histogram (as are time and network size). Finally, Figure 3 includes modularities for four individual
networks in the MSFT organization, showing that Feb 2019, Mar 2019, and Feb 2020 are all approximately the same but Mar
2020 exhibits increased modularity. (Numerical details for these four MSFT months are presented in Section 3 Table 1.)
Figure 4 summarizes network size vs. modularity for all 126,469 organization-month networks, and includes the four MSFT
months (investigated in Section 3) as well as Canada and Germany (investigated in Section 4). We also include a selection of
publicly available networks, for context.
In the remainder of the paper, we investigate the networks for the MSFT organization in detail in Section 3, and we
investigate the collection of 4361 organizations in Section 4. We conclude with a discussion of and initial insights into the
implications of the network changes we observe – dynamic silos – for organizational efficiency and innovation.
† Our approach mirrors other research in excluding mass emails13 ; we also examined cutting off the number of recipients at 2, 3 and 7 recipients, with
largely similar results.
4/19Figure 2. For illustration, we present one representation of GMSFT,Mar2020 , the MSFT network for Mar 2020. Colors
distinguish communities as discovered via the maximum modularity partition. Top: the entire organization, with n = 80, 690
nodes and modularity Q = 0.82. Using formal organizational chart data to isolate entire top-level sub-organizations, we present
in the bottom two panels sub-organizations with high modularity (left SubOrg 5, with n = 29, 958 and Q = 0.85) and low
modularity (right SubOrg 2, with n = 10, 243 and Q = 0.79).
5/19Figure 3. Modularity histogram and boxplot for all 126,469 organization-month networks, with interquartile range
(0.64, 0.77). The two sub-histograms represent Canada (blue) and Germany (green), indicating a geography effect. The dots on
the x-axis represent individual MSFT networks for four months: Feb 2019 & Mar 2019 (red) and Feb 2020 & Mar 2020
(purple), indicating an increase in modularity in spring 2020 coincident with March 4 issuance of work from home order for the
company due to Covid-19.
6/19Figure 4. Heatmap for a kernel density estimate of network size n versus modularity Q for the 126,469 organization-month
networks depicted via histogram in Figure 3. Individual dots for four MSFT months are included, along with median modularity
vs. median network size for Canada and Germany. For context, we compare a selection of other publicly available networks.
7/193 MSFT
The MSFT organization data yields a time series of networks consisting of 24 months, from Jan 2019 through Dec 2020.
Figure 2 presents a network layout illustration for MSFT Mar 2020 with modularity Q = 0.82 (along with a high-modularity
suborganization and a low-modularity suborganization).
Figure 3 highlights modularity for MSFT Feb 2019, Mar 2019, Feb 2020, and Mar 2020. We see an increased modularity
in Mar 2020. Figure 4 includes modularity Q vs. network size n for these four MSFT months GMSFT,t . Table 1 presents
numerical details for these four MSFT months. In particular, ∆Q(GMSFT,Feb2019 , GMSFT,Mar2019 ) = Q(GMSFT,Mar2019 ) −
Q(GMSFT,Feb2019 ) = −0.001 while ∆Q(GMSFT,Feb2020 , GMSFT,Mar2020 ) = 0.013; the spring 2020 change is an order of magni-
tude large than the spring 2019 change.
number of nodes number of edges total weight of all edges modularity
Feb 2019 73,625 1,688,952 14,520,982 0.809
Mar 2019 73,946 1,603,704 12,401,940 0.808
Feb 2020 79,764 1,805,376 13,923,141 0.807
Mar 2020 80,690 1,879,892 16,460,603 0.820
Table 1. Basic network statistics, including modularity, for MSFT Feb 2019, Mar 2019, Feb 2020, and Mar 2020.
Figure 5 presents the histogram of non-zero weights for March 2020 – note that this figure is on a log scale for both axes –
as well as monthly average weighted degree. This figure indicates that, besides an initial spike in the spring of 2020, the volume
of emails did not increase within MSFT.
Figure 5. Left: Histogram of nonzero weights for MSFT March 2020. Right: Average weighted degree for all vertices vs.
time.
Figure 6 plots modularity (left panel) and ARI (right panel) as a function of time for the full MSFT time series of networks.
Both the modularity increase and ARI decrease in spring 2020 coinciding with Covid-19 are clear: Q increases from Feb to
Mar to Apr to May and ARI plummets for Apr vs. May. NB: ARI for May vs. Jun going back up means that the new group
membership structure stayed in place: groups membership structure changes from Apr to May, but remains stable from May to
Jun. (This same phenomenon is present in data for the 4361 organizations – see Figure 9 Section 4.)
Figure 6. Modularity Q(GMSFT,t ) (left) and month-over-month adjusted Rand index ARI(GMSFT,t , GMSFT,t−1 ) (right) as a
function of time for the MSFT networks from Jan 2019 through Dec 2020. A spring 2020 increase in modularity coupled with
a decrease in ARI is evident.
8/19To assess the significance of the MSFT modularity change we observe from Feb 2020 to Mar 2020 (see Table 1 and Figure
6 left panel) we consider network bootstrapping14 . For Feb 2020 the observed modularity is Q = 0.807 and the bootstrap yields
Q = 0.804 ± 0.0037; for Mar 2020 the observed modularity is Q = 0.820 and the bootstrap yields Q = 0.818 ± 0.0035.
3.1 MSFT top-level sub-organizations
Figures 7 and 8 investigate top-level sub-organizations within the overall MSFT organization as defined via the formal
organizational chart for Feb 2019 vs Mar 2019 and Feb 2020 vs Mar 2020 in terms of the change in modularity ∆Q =
Q(GMSFT,t ) − Q(GMSFT,t 0 ) and the ARI(GMSFT,t − GMSFT,t 0 ). The histogram presented in Figure 7 shows the number of nodes
for Mar 2020. (Sub-organizations 2 and 5 were considered in the network map presented in Figure 2.) The scatter plot presented
in Figure 8 shows (1) the modularity changes for 2019 are small (±0.005 for all seven sub-organizations) while for 2020 the
modularity changes are much larger (and all positive except for sub-organization 3), and (2) the ARIs are mostly in the same
range for the two years except for sub-organization 3.
Figure 7. Histogram for number of nodes for seven MSFT top-level sub-organizations.
●
0.8 ● year
●
● 2019
2020
0.7 ●
●
suborg
● 0
ARI
0.6
● ● 1
● 2
● 3
0.5
● ● 5
● 6
● 7
0.4
−0.02 −0.01 0.00 0.01
∆Q
Figure 8. Scatter plot for seven MSFT sub-organizations indicating changing behavior between Feb 2019 vs Mar 2019 and
Feb 2020 vs Mar 2020. We see, for instance, that six of the seven experienced an increased modularity change in 2020 vs 2019.
Suborg 3, which dropped in modularity significantly, includes members of Microsoft’s strategy and operations organization,
manning the organization’s control center through the crisis. Members of this critical group very nimbly adapted their networks
to current needs. They did so by paring down connections within their own working group and keeping and forming
connections across groups, likely to those only most acutely relevant to regain stability for the organization and its employees.
9/194 4361 Organizations
We now investigate the time series of networks for 4361 organizations. We now investigate the time series of networks
for 4361 organizations. As described in more detail in Section 2, these organizations are located worldwide and have from
2000 to 500000 email accounts each. We observe email receipts across the networks for 29 months, resulting in 126,469
organization-month networks. The breadth of the data in terms of organization size, location, and type, together with the
duration of time, provides sufficient coverage to enable insights into global trends related to changes in intra-organizational
email communication patterns throughout 2019 and 2020.
Figure 9 shows monthly modularity {Q(Gi,t )}i∈1,··· ,4361 and month-over-month community stability {ARI(Gi,t , Gi,t−1 )}i∈1,··· ,4361
for the 4361 organization networks at each time t. Figure 10 depicts volume vs. time for this data set. Unlike within MSFT, the
volume of emails increased in 2020. As was apparent for MSFT – see Figure 6 Section 3 – the increase in modularity and
decrease in ARI in spring 2020 is clear.
Figure 9. Considering the collection of all 4361 organizations for Jan 2019 - Nov 2020: the left panel shows monthly
modularity Q(Gi,t ) (mean ± one standard error); the right panel shows month-over-month adjusted Rand index
ARI(Gi,t , Gi,t−1 ) (mean ± one standard error). A change coinciding with Covid-19 is clear: in spring 2020 the modularity
increases significantly and there is a corresponding decrease in month-over-month ARI.
Figure 10. Email volume vs. time for the collection of all 4361 organizations.
10/19Figure 11 presents a quantitative analysis of the spring 2020 modularity increase apparent in Figure 9 (left panel): the
paired Wilcoxon test shows that year-over-year modularity is clearly increased for post-Covid-19 Apr 2020 compared to Apr
2019 (two-sided Wilcoxon p-value ≈ 0), as opposed to no significant difference for pre-Covid-19 Jan 2020 compared to Jan
2019. We obtain a similar result (p-value ≈ 0) for the Covid-19-associated ARI change apparent in Figure 9 (right panel).
Figure 11. Year-over-year modularity paired difference histograms Q(Gi,t ) − Q(Gi,t 0 ) for all 4361 organization networks i at
times t and t 0 = t minus one year. Green: Jan 2020 - Jan 2019, centered near zero (no statistically significant difference in
modularity Jan 2020 compared to Jan 2019). Red: Apr 2020 - Apr 2019, centered greater than zero (increased modularity Apr
2020 compared to Apr 2019; two-sided Wilcoxon p-value ≈ 0) indicating a Covid-19 effect.
11/19Further examining the modularity for all organizations presented in aggregate in Figure 3 and by time in Figure 9, Figure 12
presents modularity aggregated by geography for Canada and Germany – time series versions of these histograms presented in
Figure 3. While the modularity for Germany is consistently larger than that for Canada, in both cases we see a modularity
increase in spring 2020. The number of organizations considered in Figure 12 is NCanada = 132 and NGermany = 84. Histograms
of network sizes for both countries/regions are shown in Figure 13, corresponding to medians of n vs. Q depicted in Figure 4.
Figure 14 presents modularity as a function of time for ten additional countries/regions, showing similar trends. Table 2 shows
modularity values for 12 countries/regions for April 2019 and April 2020.
Figure 12. Monthly modularity vs. time Q(Gi,t ) (mean ± one standard error) for organizations i in Canada (left) and
Germany (right).
Figure 13. Histograms of network sizes for Canada (132 organizations) and Germany (84 organizations). The median number
of nodes for Canada is 5046 and for Germany is 6039.
12/19Figure 14. Monthly modularity vs. time Q(Gi,t ) (mean ± one standard error) for ten additional countries/regions.
13/19Mean Modularity April 2019 Mean Modularity April 2020 ∆Q
Canada 0.674 0.689 0.015
Germany 0.757 0.771 0.014
Australia 0.686 0.702 0.016
Brazil 0.673 0.673 0.000
France 0.744 0.763 0.019
India 0.671 0.671 0.000
Italy 0.722 0.742 0.020
Japan 0.725 0.746 0.021
Mexico 0.688 0.697 0.009
Netherlands 0.726 0.734 0.008
UK 0.685 0.700 0.015
United States 0.688 0.698 0.010
Table 2. Mean modularity change by country/region, Apr 2019 vs. Apr 2020.
Returning to Figure 3, we see now, in light of the investigations presented in Sections 3 and 4, that the overall histogram of
modularity confounds modularity differences associated with number of nodes and time and geography. Nonetheless, whether
looking at the full collection of 4361 organizations, or aggregated by country/region, or the MSFT network in particular, we
see consistently a spring 2020 increase in modularity and decrease in ARI. Specifically: for MSFT the maximum modularity
over time is achieved in Jun 2020 and the minimum ARI is achieved for Apr vs. May, while for the 4361 organizations the
maximum modularity is achieved in May 2020 and the minimum ARI is achieved for Mar vs. Apr; the behavior is generally
analogous, but with MSFT delayed one month.
14/195 A Generative Model
Access, privacy, and legal considerations often prohibit obtaining raw communication data for analysis. In an effort to facilitate
future research and analysis of human communications within organizational structures, we have created a generative model
designed for our intra-organizational communication networks. We propose a generalization of the Barabasi-Albert15 generative
model for the networks considered herein: a Barabasi-Albert augmented hierarchical stochastic block model (BA-HSBM).
Figure 15 presents a visual comparison of this new model with its simpler competitors. This provides fitted generative models
for all 126,469 organization-month networks, enabling independent research to be conducted into organizational behavior and
providing baselines for comparisons against observed activity.
We start with root level Leiden community structures and create an a posteriori stochastic block model that retains the
population statistics for both vertices and edges from the real network being fit. In addition, to make Barabasi-Albert fit well in
the context of an SBM, we modify the algorithm: within each block of the SBM, we consider a specific budget of vertices and
edges, obtained from the observed network being fit. We configure the Barabasi-Albert algorithm to create a number of edges
for each vertex equal to the intra-block average degree centrality. Then, employing either Erdos-Renyi (Figure 15 panel (a)) or
Barabasi-Albert (Figure 15 panel (b)) for creation of intra-block connections, we observe major differences between the resulting
networks and the real network being fit (Figure 15 panel (d)). The inter-block connections are made at a rate determined by the
real network, but the connections are made between random vertices across pairs of communities. We observe the power-law
distribution of the degree centrality is much closer to the real network’s distribution when using the Barabasi-Albert generator,
and the network paths generated using Barabasi-Albert are longer than those generated using Erdos-Renyi. These longer paths
produce less regularity in the structures and also allow for some bleed-over between communities as highly eccentric nodes
connected to multiple communities will be pulled between those communities.
Using these observations, we extend our model to use hierarchical Leiden communities obtained by running Leiden
recursively on the real network until we attain leaf communities no larger than nmax vertices. (We use nmax = 250.) Using
these leaf communities, we apply the Barabasi-Albert algorithm again for the leaf intra-block connections and then proceed
with inter-block connections between leaf clusters. This has the effect of localizing connections between communities to
small groups of nodes, which dramatically fractures the network structure (Figure 15 panel (c)), corresponding to the structure
observed in the real network being fit: as in the real network, we observe that the generative model now produces many new
and small communities. Applying Leiden to data generated from this new generative model, we find that these groups of
communities are captured in the same partition when maximizing modularity at the root level, indicating that the more complex
and realistic structure generated by BA-HSBM has similar modularity characteristics to the real network being fit, as desired.
15/19(a) Root-Leiden SBM (b) Root-Leiden Barabasi-Albert SBM
(c) BA-HSBM (d) Observed GMSFT,Mar2020
Figure 15. Illustrative representations of generative models for GMSFT,Mar2020 , the MSFT network for Mar 2020.
16/196 Discussion
In 2020 relative to 2019, intra-organizational email communication networks across countries/regions exhibited increased
modularity. At the same time, ARI decreased across organizations. Our analysis shows that organizational networks around the
world became more siloed and that the communities within these networks became less stable. Collectively, the widespread
shifts in these measures — that is, dynamic silos — have important implications for organizations around the world.
First, these changes might be associated with productivity and efficiency gains. Collaborating with people that have similar
domain knowledge16 or shared interpretive schemas17 fosters trust18 , facilitates cooperation19, 20 , and allows for rapid sharing
of information and tacit knowledge21 , fueling efficiency22 and creating enduring interpersonal ties23 . Research has suggested
that these benefits can be present even in the face of membership instability or churn, provided that members are assigned clear
roles within their groups24 . Thus, depending on work practices and features of collaborative groups, dynamic siloing may
improve efficiency25 .
Second, dynamic siloing may result in lower rates of innovation within some organizations. Innovation often results through
novel combinations of distantly held knowledge26–29 . Interdisciplinary or cross-department collaborations provide access
to new ties and information that can provide fertile material for innovative ideas30, 31 . If employees limit communication to
smaller, more insular groups comprised of members who are similar to one another, they might decrease their ability to access
and recombine diverse information and knowledge that might aid in innovation12, 32, 33 .
Finally, increased modularity in large organizations might be associated with a specific kind of innovation: the development
of competence-destroying technologies34, 35 . Competence-destroying technologies create new product classes and render
existing organizational capabilities obsolete, and are typically initiated by new firms36, 37 or small teams38 . Within large
or incumbent organizations, competence-destroying, architectural, or disruptive innovation is best developed by teams or
workgroups with few connections to the rest of the organization39–41 . Increased modularity might foster the cultural separation
and autonomy necessary for teams to develop this kind of innovation. Thus, dynamic siloing might be associated with positive –
and counterintuitive – shifts in innovation within large, established organizations.
We hope this research will stimulate future studies connecting modularity and related measures in communication networks
to organizational outcomes. Our analysis highlights the need for future studies examining the drivers and implications of
geographic differences both in baseline modularity scores, and in the magnitude of post-Covid-19 modularity shifts. If these
shifts are associated with changes in organizational performance and innovation, they may have implications for national
competitiveness and resilience, and merit continued focus as organizational communities evolve after the pandemic. We also
found that modularity increased both within MSFT (where email volume remained similar in 2020 to 2019) and worldwide
(where email volume increased). We see potential for studies to explore the link between volume of communication and
network structure. Finally, recent studies have shown that, as a result of Covid-related work-from-home orders, employees
transferred their informal interactions to new forms of digital communication, including instant messages42 . While we focus on
email data, future studies can examine the network structures revealed by multi-modal changes in communications via video
conferencing, social media or chat data.
As leaders begin to better understand the modularity of their own organizations, they might be strategic about how to
capture the benefits while mitigating potential downsides of dynamic silos. Overall, we suggest that when the worlds within
organizations become more siloed, they need not become less fertile.
17/19Data Availability
An anonymized version of the data presented on Microsoft Corporation supporting this study will be retained indefinitely for
scientific and academic purposes. The data are available from the authors upon reasonable request and with permission of
Microsoft Corporation.
Code Availability
The code used to produce the results shown on Microsoft, and the code used to create the generative models as well as fitted
generative models for all 126,469 organization-month networks, are available upon reasonable request and with permission of
Microsoft Corporation.
References
1. Jacobs, A. Z. & Watts, D. J. A large-scale comparative study of informal social networks in firms. Manag. Sci. 0, DOI:
10.1287/mnsc.2021.3997 (2021).
2. Watts, D. J. & Strogatz, S. H. Collective dynamics of ‚Äòsmall-world‚Äô networks. Nature 393, 440–442, DOI:
10.1038/30918 (1998).
3. Newman, M. E. J. & Girvan, M. Finding and evaluating community structure in networks. Phys. Rev. E 69, 026113, DOI:
10.1103/PhysRevE.69.026113 (2004).
4. Newman, M. E. J. Modularity and community structure in networks. Proc. Natl. Acad. Sci. 103, 8577–8582, DOI:
10.1073/pnas.0601602103 (2006).
5. Bickel, P. J. & Chen, A. A nonparametric view of network models and newman–girvan and other modularities. Proc. Natl.
Acad. Sci. 106, 21068–21073, DOI: 10.1073/pnas.0907096106 (2009).
6. Traag, V., Waltman, L. & van Eck, N. J. From Louvain to Leiden: guaranteeing well-connected communities. Sci. Reports
9, DOI: 1038/s41598-019-41695-z (2019).
7. Hubert, L. & Arabie, P. Comparing partitions. J. Classif. 2, 193–218 (1985).
8. Holland, P. W., Laskey, K. B. & Leinhardt, S. Stochastic blockmodels: First steps. Soc. Networks 5, 109–137, DOI:
https://doi.org/10.1016/0378-8733(83)90021-7 (1983).
9. Clement, J., Shipilov, A. & Galunic, C. Brokerage as a Public Good: The Externalities of Network Hubs for Different
Formal Roles in Creative Organizations. Adm. Sci. Q. 63, 251–286, DOI: 10.1177/0001839217708984 (2018).
10. Tatarynowicz, A., Sytch, M. & Gulati, R. Environmental Demands and the Emergence of Social Structure: Technological
Dynamism and Interorganizational Network Forms. Adm. Sci. Q. 61, 52–86, DOI: 10.1177/0001839215609083 (2016).
11. Sytch, M. & Tatarynowicz, A. Exploring the Locus of Invention: The Dynamics of Network Communities and Firms’
Invention Productivity. Acad. Manag. J. 57, 249–279, DOI: 10.5465/amj.2011.0655 (2014).
12. Gulati, R., Sytch, M. & Tatarynowicz, A. The Rise and Fall of Small Worlds: Exploring the Dynamics of Social Structure.
Organ. Sci. 23, 449–471, DOI: 10.1287/orsc.1100.0592 (2012).
13. Kleinbaum, A. M. Organizational misfits and the origins of brokerage in intrafirm networks. Adm. Sci. Q. 57, 407–452,
DOI: 10.1177/0001839212461141 (2012).
14. Green, A. & Shalizi, C. R. Bootstrapping exchangeable random graphs (2017). arXiv:1711.00813.
15. Barabási, A.-L. & Albert, R. Emergence of scaling in random networks. Science 286, 509–512, DOI: 10.1126/science.286.
5439.509 (1999).
16. Simon, H. A. Machine as mind. In Machines and Thought, vol. 1, 81–102 (Oxford University Press New York, 1996).
17. Gulati, R. Does Familiarity Breed Trust? The Implications of Repeated Ties for Contractual Choice in Alliances. Acad.
Manag. J. 38, 85–112, DOI: 10.5465/256729 (1995).
18. Coleman, J. S. Social Capital in the Creation of Human Capital. Am. J. Sociol. 94, S95–S120, DOI: 10.1086/228943
(1988).
19. Reagans, R. & Zuckerman, E. W. Networks, Diversity, and Productivity: The Social Capital of Corporate R&D Teams.
Organ. Sci. 12, 502–517, DOI: 10.1287/orsc.12.4.502.10637 (2001).
20. Wang, D., Pahnke, E. C. & McDonald, R. The Past Is Prologue? Venture-Capital Syndicates‚ Collaborative Experience
and Start-Up Exits. Acad. Manag. J. amj.2019.1312, DOI: 10.5465/amj.2019.1312 (2021).
18/1921. Granovetter, M. Economic Action and Social Structure: The Problem of Embeddedness. Am. J. Sociol. 91, 481–510, DOI:
10.1086/228311 (1985).
22. Reagans, R. & McEvily, B. Network Structure and Knowledge Transfer: The Effects of Cohesion and Range. Adm. Sci. Q.
48, 240–267, DOI: 10.2307/3556658 (2003).
23. Dahlander, L. & McFarland, D. A. Ties That Last: Tie Formation and Persistence in Research Collaborations over Time.
Adm. Sci. Q. 58, 69–110, DOI: 10.1177/0001839212474272 (2013).
24. Valentine, M. A. & Edmondson, A. C. Team Scaffolds: How Mesolevel Structures Enable Role-Based Coordination in
Temporary Groups. Organ. Sci. 26, 405–422, DOI: 10.1287/orsc.2014.0947 (2015).
25. Choudhury, P. R., Foroughi, C. & Larson, B. Work‚Äêfrom‚Äêanywhere: The productivity effects of geographic flexibility.
Strateg. Manag. J. 42, 655–683, DOI: 10.1002/smj.3251 (2021).
26. Schumpeter, J. A. & Opie, R. The theory of economic development: an inquiry into profits, capital, credit, interest, and the
business cycle. No. vol. XLVI in Harvard economic studies (Harvard University Press, Cambridge, Mass, 1934).
27. Kogut, B. & Zander, U. Knowledge of the Firm, Combinative Capabilities, and the Replication of Technology. Organ. Sci.
3, 383–397, DOI: 10.1287/orsc.3.3.383 (1992).
28. Hargadon, A. & Sutton, R. I. Technology Brokering and Innovation in a Product Development Firm. Adm. Sci. Q. 42,
716–749, DOI: 10.2307/2393655 (1997).
29. Burt, R. Structural Holes and Good Ideas. Am. J. Sociol. 110, 349–399, DOI: 10.1086/421787 (2004).
30. Soda, G. B., Mannucci, P. V. & Burt, R. Networks, Creativity, and Time: Staying Creative through Brokerage and Network
Rejuvenation. Acad. Manag. J. amj.2019.1209, DOI: 10.5465/amj.2019.1209 (2021).
31. Rawlings, C. M., McFarland, D. A., Dahlander, L. & Wang, D. Streams of Thought: Knowledge Flows and Intellectual
Cohesion in a Multidisciplinary Era. Soc. Forces 93, 1687–1722, DOI: 10.1093/sf/sov004 (2015).
32. Uzzi, B. Social Structure and Competition in Interfirm Networks: The Paradox of Embeddedness. Adm. Sci. Q. 42, 35–67,
DOI: 10.2307/2393808 (1997).
33. Tortoriello, M., Reagans, R. & McEvily, B. Bridging the Knowledge Gap: The Influence of Strong Ties, Network Cohesion,
and Network Range on the Transfer of Knowledge Between Organizational Units. Organ. Sci. 23, 1024–1039, DOI:
10.1287/orsc.1110.0688 (2012).
34. Abernathy, W. J. & Clark, K. B. Innovation: Mapping the winds of creative destruction. Res. Policy 14, 3–22, DOI:
10.1016/0048-7333(85)90021-6 (1985).
35. Tushman, M. L. & Anderson, P. Technological Discontinuities and Organizational Environments. Adm. Sci. Q. 31,
439–465, DOI: 10.2307/2392832 (1986).
36. Tripsas, M. Unraveling the process of creative destruction: Complementary assets and incumbent survival in the typesetter
industry. Strateg. Manag. J. 18, 119–142 (1997).
37. Zuzul, T. & Tripsas, M. Start-up Inertia versus Flexibility: The Role of Founder Identity in a Nascent Industry. Adm. Sci.
Q. 65, 395–433, DOI: 10.1177/0001839219843486 (2020).
38. Wu, L., Wang, D. & Evans, J. A. Large teams develop and small teams disrupt science and technology. Nature 566,
378–382, DOI: 10.1038/s41586-019-0941-9 (2019).
39. Henderson, R. M. & Clark, K. B. Architectural Innovation: The Reconfiguration of Existing Product Technologies and the
Failure of Established Firms. Adm. Sci. Q. 35, 9–30, DOI: 10.2307/2393549 (1990).
40. Christensen, C. M. The innovator’s dilemma: when new technologies cause great firms to fail. The management of
innovation and change series (Harvard Business School Press, Boston, Mass, 1997).
41. Benner, M. J. & Tushman, M. L. Exploitation, Exploration, and Process Management: The Productivity Dilemma Revisited.
The Acad. Manag. Rev. 28, 238, DOI: 10.2307/30040711 (2003).
42. Yang, L. et al. How Work From Home Affects Collaboration: A Large-Scale Study of Information Workers in a Natural
Experiment During COVID-19. arXiv:2007.15584 [cs] (2020).
19/19You can also read