Identifying pre-outbreak signals of hand, foot and mouth disease based on landscape dynamic network marker
←
→
Page content transcription
If your browser does not render page correctly, please read the page content below
Zhang et al. BMC Infectious Diseases 2021, 21(Suppl 1):6
https://doi.org/10.1186/s12879-020-05709-w

 RESEARCH                                                                                                                                         Open Access

Identifying pre-outbreak signals of hand,
foot and mouth disease based on
landscape dynamic network marker
Xuhang Zhang1, Rong Xie2, Zhengrong Liu3, Yucong Pan4, Rui Liu3* and Pei Chen3*
From The 18th Asia Pacific Bioinformatics Conference
Seoul, Korea. 18-20 August 2020

  Abstract
  Background: The high incidence, seasonal pattern and frequent outbreaks of hand, foot and mouth disease
  (HFMD) represent a threat for billions of children around the world. Detecting pre-outbreak signals of HFMD
  facilitates the timely implementation of appropriate control measures. However, real-time prediction of HFMD
  outbreaks is usually challenging because of its complexity intertwining both biological systems and social systems.
  Results: By mining the dynamical information from city networks and horizontal high-dimensional data, we
  developed the landscape dynamic network marker (L-DNM) method to detect pre-outbreak signals prior to the
  catastrophic transition into HFMD outbreaks. In addition, we set up multi-level early warnings to achieve the
  purpose of distinguishing the outbreak scale. Specifically, we collected the historical information of clinic visits
  caused by HFMD infection between years 2009 and 2018 respectively from public records of Tokyo, Hokkaido, and
  Osaka, Japan. When applied to the city networks we modelled, our method successfully identified pre-outbreak
  signals in an average 5 weeks ahead of the HFMD outbreak. Moreover, from the performance comparisons with
  other methods, it is seen that the L-DNM based system performs better when given only the records of clinic visits.
  Conclusions: The study on the dynamical changes of clinic visits in local district networks reveals the dynamic or
  landscapes of HFMD spread at the network level. Moreover, the results of this study can be used as quantitative
  references for disease control during the HFMD outbreak seasons.
  Keywords: Hand, foot and mouth disease (HFMD) outbreaks, Pre-outbreak signals, Critical transition, City network,
  Landscape dynamic network marker (L-DNM)

Background                                                                           attention once again. Generally, the main etiologic agents
Hand, foot and mouth disease (HFMD) is a global infec-                               of HFMD are human enterovirus 71 (EV-A71) and
tious disease that has been reported in many countries                               Coxsackievirus 16 (CV-A16) [1]. Although usually mild—
around the world, especially in the Asia-Pacific region.                             with symptoms limited to 38 °C fever, malaise, rashes on
Since June 2019, a severe outbreak of HFMD has occurred                              the volar regions of the hands and feet, herpangina and
in multiple regions of Japan, which attracted people’s                               difficulty in eating and drinking, infection may lead to se-
                                                                                     vere complications of the nervous or cardiopulmonary
* Correspondence: scliurui@scut.edu.cn; chenpei@scut.edu.cn                          systems [2]. For some cases, HFMD results in long-term
3
 School of Mathematics, South China University of Technology, Guangzhou              sequelae such as cognitive and motor disorders [3, 4] or
510640, China
Full list of author information is available at the end of the article               even death. Moreover, global epidemiology of HFMD and

                                      © The Author(s). 2021 Open Access This article is licensed under a Creative Commons Attribution 4.0 International License,
                                      which permits use, sharing, adaptation, distribution and reproduction in any medium or format, as long as you give
                                      appropriate credit to the original author(s) and the source, provide a link to the Creative Commons licence, and indicate if
                                      changes were made. The images or other third party material in this article are included in the article's Creative Commons
                                      licence, unless indicated otherwise in a credit line to the material. If material is not included in the article's Creative Commons
                                      licence and your intended use is not permitted by statutory regulation or exceeds the permitted use, you will need to obtain
                                      permission directly from the copyright holder. To view a copy of this licence, visit http://creativecommons.org/licenses/by/4.0/.
                                      The Creative Commons Public Domain Dedication waiver (http://creativecommons.org/publicdomain/zero/1.0/) applies to the
                                      data made available in this article, unless otherwise stated in a credit line to the data.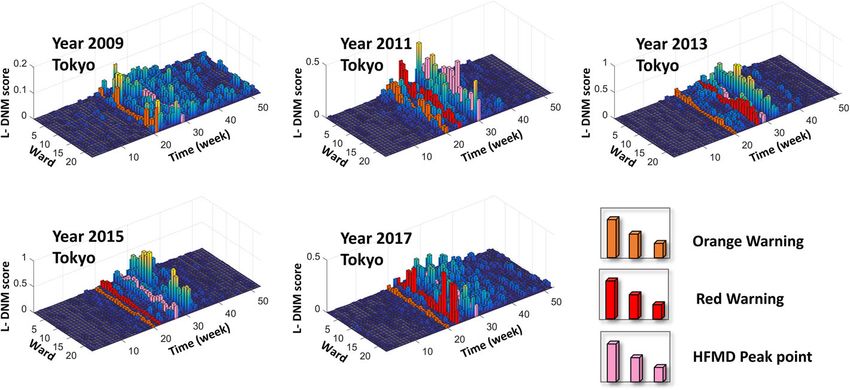
Zhang et al. BMC Infectious Diseases 2021, 21(Suppl 1):6                                                       Page 2 of 10

its social consequences have been documented in the past       collected from 175 clinics distributed in 23 wards of
decade, especially in Japan [5], Singapore [6] and mainland    Tokyo, Japan, 139 clinics distributed in 30 wards of
China [7, 8], where large-scale outbreaks of HFMD have         Hokkaido, Japan, and 197 clinics distributed in 11 wards
occurred, resulting in a substantial costs of epidemics to     of Osaka, Japan (Fig. 1a). The results show that L-DNM
the economy and global public health concerns.                 method effectively monitors the epidemic process of
   Early recognition of pre-outbreak signals of HFMD           HFMD and successfully detect the pre-outbreak signals
and timely preventive measures can greatly reduce the          about 5 weeks before the actual peak of the outpatient
magnitude and distribution of infection. However, due          number. Besides, for each outbreak, the L-DNM method
to the lack of public health infrastructure and economic       reveals the temporal and spatial information of HFMD
incentives, which lead to the inability to recognize the       transmission at the city network level. Therefore, such
potential progression of an epidemic [9, 10], it is still      method is of great applicable potential in public health
challenging to predict the HFMD outbreaks in a timely          management, which may help to develop new control
manner. Fortunately, with the disclosure of real-time          strategies for HFMD before its outbreaks (Fig. 1c).
monitoring data, an appropriate method of calculation is
needed to identify pre-outbreak signals based on avail-        Methods
able data of HFMD, thus simplifying the process of data        Theoretical background
collection and monitoring.                                     The theoretical basis of this research is the dynamic
   In this study, we develop a computational method, the       network biomarker (DNB) method [11]. Specifically,
so-called landscape dynamic network marker (L-DNM),            when a complex dynamic system approaches a critical
to detect the early-warning signals of HFMD outbreaks.         point, there exists a dominant group defined as the DNB
First, in a dynamical modelling way, the stage before the      group that satisfies the following three properties [19]:
outbreak of HFMD is regarded as a pre-transition stage,
immediately after which the system undergoes a critical          i) The standard deviation (SDin) for any member in
transition. Then the dynamical process of an epidemic                 the DNB group increases sharply;
system can be roughly modelled as three stages, i.e., a          ii) The correlation (PCCin) between any pair of
normal stage, a pre-outbreak stage and an outbreak                    members in the DNB group increases rapidly;
stage. According to L-DNM method, when the system                iii) The correlation (PCCout) between one member of
transits from the normal stage to the pre-outbreak stage,             the DNB group and any other non-DNB member
the city network changes significantly and L-DNM score                decreases rapidly.
rises sharply (Fig. 1b). Unlike the traditional detection of
the outbreak stage, the L-DNM method can identify the            Based on the above three properties, it is possible to
pre-outbreak stage that generally has no clear abnormal-       find a group defined as the dynamical network marker
ities but with high potential of state transition into a       (DNM) group of highly correlated variables with strong
severe and irreversible stage. The proposed L-DNM is           fluctuations, the emergence of which means an upcom-
mainly based on a theoretical background of dynamic            ing state transition during a biological process. Then,
network biomarker (DNB) method [11], which identifies          these three properties are applied to detect the critical
the critical state of complex diseases by analyzing the        state as an early warning signal of diseases. In order to
dynamics of driven biomolecules (i.e., a group of genes        quantify the critical state, IDNM is used as a composite
and proteins that are the leading factors to the critical      index to quantitatively measure the critical signal:
state transition). The DNB method has been applied to a
number of biological progresses and achieved satisfac-                      PCC in
                                                                  I DNM ¼           SDin :
tory results, including identifying the critical points of                  PCC out
cell fate decision [12] and cellular differentiation [13],
and detecting the critical period during various bio-            Whenever the IDNM score increases significantly, it is
logical processes [14–17]. Different from micro-               considered that the system is close to the critical transi-
biomolecular networks which are constructed mainly             tion point. The detailed description and derivation of
based on regulations among genes and proteins, macro-          DNB can be found in the reference [20] and its Supple-
city networks can be built according to the geographical       mental Information.
distribution and population mobility among regions [18].         Based on the DNB theory, the dynamical process of
Based on such city network, the L-DNM approach helps           HFMD outbreaks is roughly divided into the following
to study the dynamics of epidemic and effectively detect       three stages (Fig. 1b) similar to the dynamics of disease
the early-warning signals of any potential disease out-        progression [11]: the normal stage, which has stable
breaks. We applied the L-DNM method to a set of real-          dynamic characteristics with high resilience; the pre-
time clinic hospitalization records of HFMD, which were        outbreak stage, which is dynamically unstable and with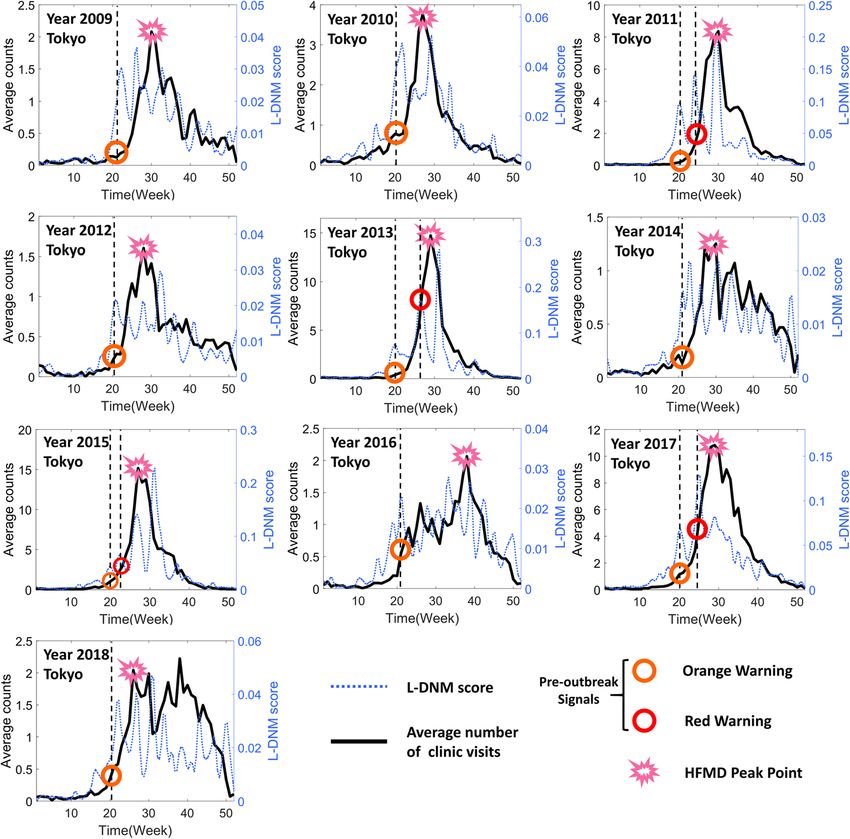
Zhang et al. BMC Infectious Diseases 2021, 21(Suppl 1):6                                                                                 Page 3 of 10

 Fig. 1 Schematic diagram to detect pre-outbreak signals of HFMD based on the L-DNM method. a The historical information of clinics
 hospitalization due to HFMD infection from January 1, 2009 to December 31, 2018, was collected from public records in Tokyo, Hokkaido and
 Osaka, Japan. b According to the DNM theory, the process of HFMD outbreaks is divided into three stages, including the normal stage, the pre-
 outbreak stage and the outbreak stage. The sudden increase in the DNM score indicates a transition from the normal stage to the pre-outbreak
 stage, i.e., the critical point before the upcoming outbreak of HFMD that results in an increase in clinical visits. c Based on the historical and
 current clinical records and geographic characteristics of a region, the DNM score provides an early warning signal of an upcoming outbreak of
 HFMD as a real-time indicator

low resilience. In this stage, the epidemic is still control-                Landscape dynamic network marker (L-DNM)
lable through appropriate measures; and the outbreak                         The L-DNM method is illustrated in Fig. 2 and
stage, which is another stable stage with high resilience.                   described in the following three steps.
Obviously, identifying the warning signals in the pre-
outbreak stage is the key to implement effective control
management to prevent HFMD outbreaks. However, un-                           Modeling and mapping
like the outbreak stage with a large number of clinic                        In the first step, we construct the city network based on
visits, there is little significant difference between the                   the geographic distribution of the wards/districts and
pre-outbreak stage and the normal stage. In order to                         their adjacent information. In the network, each node
detect the pre-outbreak signals of HFMD more accur-                          represents a ward, while each edge represents the adja-
ately, we developed the landscape dynamic network                            cent relation between two wards. Then the records of
marker (L-DNM) method which is applied to the histor-                        HFMD outpatients within a 5-week sliding window are
ical records of HFMD and analyze the local and global                        mapped to the city network. The city network model is
city network.                                                                demonstrated as in Fig. 3.
Zhang et al. BMC Infectious Diseases 2021, 21(Suppl 1):6                                                                                     Page 4 of 10

 Fig. 2 The algorithm of landscape dynamic network marker. The flow chart above shows how the algorithm works based on city networks and
 the historical information of clinic hospitalization. Regarding a point T = t (t > 5) as a candidate tipping point, L-DNM scores can be calculated. If
 the L-DNM score increases significantly, the candidate T = t is determined as the identified tipping point, and the algorithm ends. Otherwise, if
 there is no significant change in the score, then T = t is classified as a time point belonging to the normal stage, and the algorithm continues
 with T = t + 1 being a new candidate tipping point

Calculating L-DNM score                                                        (in absolute value) between a member (node i) in the local
In the second step, the city network is divided into local                     network and that (node j) outside.
networks piece by piece, each of which contain a central                         Clearly, during the pre-outbreak stage, i.e., at a sam-
node/ward and all of its first-order neighbors. For a local                    pling point t ∈critical state, there are three cases for each
network with n members (i.e., a central node and n-1                           local network:
first-order neighbors), we calculate the local-network
index It at a sampling point t by the following definition:                        In the local network, all the nodes are DNM
                                                                                      members;
    I t ¼ jΔSDt ðinÞj½jΔPCC t ðinÞj þ jΔPCC t ðout Þj;                            In the local network, there are DNM and non-DNM
where                                                                                 members;
                     Pn                                                            In the local network, all the nodes are non-DNM
                         i¼1 jSDt ðiÞ − SDt − 1 ðiÞj                                  members.
    jΔSDt ðinÞj ¼
                                    n
is the average differential standard deviation (in absolute                      As shown in Table 1, for the above three cases
value) of the nodes in the local network;                                      respectively, there are significant changes for the statis-
                                                                               tical indices of each local network. Obviously, each
                       Pn
                        i¼1; j¼1 jPCC t ði; jÞ − PCC t − 1 ði; jÞj             node or ward corresponds to an index value, It, which
    jΔPCC  t ð inÞ j ¼                                                         can quantitatively characterizes the criticality of each
                                        nn
                                                                               node at a sampling point t. As time evolves, a landscape
is the average differential Pearson’s correlation coeffi-                      can be constructed based on those It scores of all
cient (in absolute value) within the local network. That                       nodes. According to Table 1, the It score of each DNM
is, nodes i and j are both in the same local network;                          node increases sharply based on the three statistical
                       Pn                                                      conditions of DNM. Therefore, during the process of
                        i¼1; j¼1 jPCC t ði; jÞ − PCC t − 1 ði; jÞj
     jΔPCC t ðout Þj ¼                                                         transition from the normal stage to the outbreak stage,
                                        nn
                                                                               the DNM group helps to detect the early warning signal
is the average differential Pearson’s correlation coefficient                  of the critical state.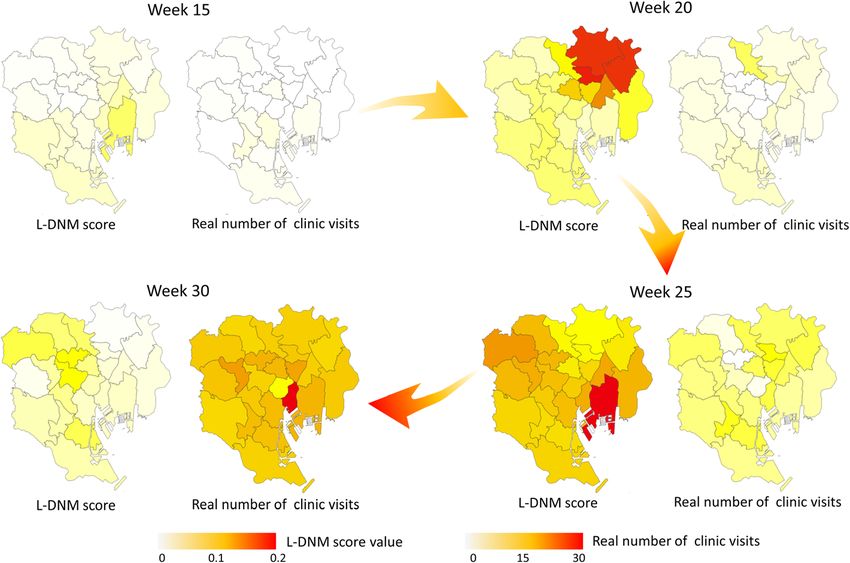
Zhang et al. BMC Infectious Diseases 2021, 21(Suppl 1):6 Page 5 of 10
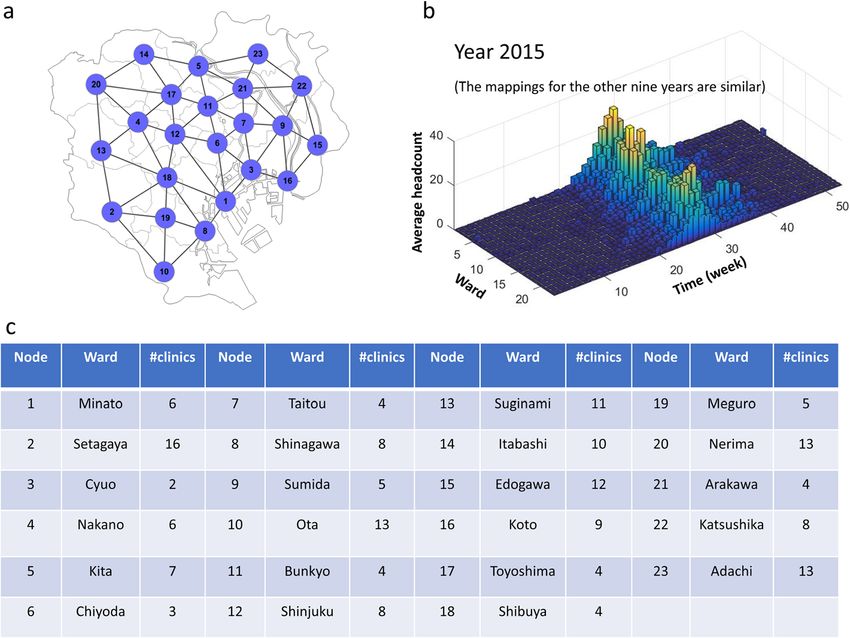
Fig. 3 The city network model of Tokyo. a A 23-node network model was constructed based on the geographic information and adjacent
relationships of the 23 wards. b For each week, the average number of clinic visits in the ward was mapped to the corresponding node, through
which we obtained a data matrix of 23 rows/wards and 522 columns/weeks. c A detailed list of correspondences between wards and nodes,
including the number of clinics in each ward
Identifying multi-level early warnings Pn
i¼1 I t ðiÞ ðt − 1Þ
It is observed that a severe outbreak of HMFD occurs Mthreshold ¼ P t − 1 Pn
in every 2 to 3 years. For example, in 2013, 2015 and j¼1 i¼1 I j ðiÞ
2017, the number of infected patients was signifi-
cantly more than that in other years. Taking this fact where It(i) represents the score It of the central node i at
into consideration, we set up a multilevel early warn- a time point t for the local network with n members.
ing system, including the mild (orange) warning and The above threshold is then determined by the specific
the severe (red) warning. Specifically, an adjustable historical records of a region. For example, based on the
threshold Mthreshold is applied to identify the signifi- clinic hospitalization records of HFMD in Tokyo, a 5-fold-
cant changes of It scores, which is given as the change threshold is considered as the orange warning and
following formula: an 8-fold-change threshold is regarded as the red warning.
Table 1 Critical behaviours of a central node’s L-DNM score for different cases
Case Nodes SDt ∣ΔSDt(in)∣ PCCt(in) |ΔPCCt(in)| PCCt(out) |ΔPCCt(out)| It
1 All DNM ↗ ↗ ↗ ↗ D↗ ↗ ↗
N↘
2 DNM and non-DNM D ↗ ↗ D↗ ↗ D↗ ↗ ↗
N↘ ↗ N↘ ↗
N → 0 D↘ ↗ D↘ ↗
N→ 0 N→ 0
3 All non-DNM → 0 → 0 D↘ ↗ 0
N→ 0
Notes: When the system moves from time point t − 1 to t, it is approaching the critical point
1. “↗” represents the increase of variables; “↘” represents the decrease of variables; “→” represents that there is no significant change in the variables;
2. “D” represents the DNM members; “N” represents the non-DNM members;
3. SDt is the average standard deviation at time point t; PCCt(in) is the average Pearson’s correlation coefficient between two nodes within the local network;
PCCt(out) is the average Pearson’s correlation coefficient between a node inside the local network and a node outside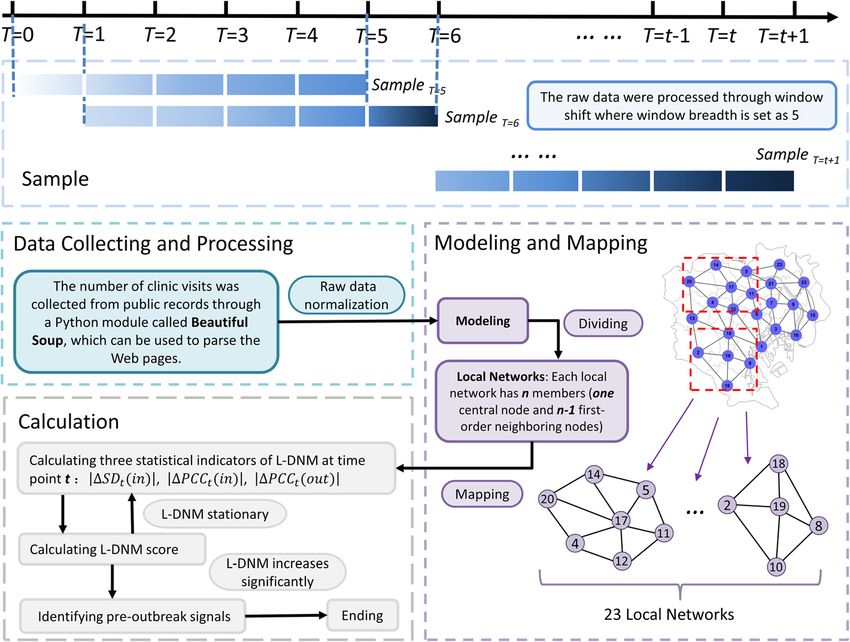
Zhang et al. BMC Infectious Diseases 2021, 21(Suppl 1):6                                                     Page 6 of 10

In this study, the similar way to determine the adjustable    caused large HFMD epidemics every 2 years. In addition,
threshold is also applied to the datasets of Hokkaido and     as shown in Fig. 4, the orange warning signal indicates
Osaka.                                                        that the infection of HFMD has entered a pre-outbreak
                                                              stage, and the red signal successfully warns a large out-
Data processing                                               break of HFMD. Therefore, for each HFMD outbreak
Data normalization                                            later developing into a large outbreak, the L-DNM score
The process of data normalization is important for pre-       is sensitive and significantly increases about 5 weeks be-
dicting outcomes since the population of each ward/dis-       fore the actual number of hospitalizations skyrockets.
trict is roughly proportional to the number of clinics.         To better illustrate the L-DNM method’s principle, we
The raw data was averaged by the total number of              show the landscape for L-DNM scores of every local
clinics inside the ward/district.                             network as in Fig. 5. As time evolves, the landscape can
                                                              be constructed based on the L-DNM scores of all nodes.
Sliding window                                                It can be seen that the first discovered pre-outbreak sig-
In the calculation process, we processed the original data    nal is 4–8 weeks ahead of the HFMD outbreak point
by window shifting, where the window width was set as         defined at the peak of hospitalization counts. The suc-
5. In other words, the standard deviation and correlation     cessful prediction of each HFMD outbreak in different
coefficient were calculated based on the data within          regions demonstrates the robustness and effectiveness of
every 5 weeks.                                                L-DNM method in identifying real-time warning signals
                                                              for infectious diseases.
Results                                                         In addition, we also introduce the dynamic evolution
Identifying pre-outbreak signals of HFMD in Tokyo             of the transmission network of HFMD in Tokyo. Figure 6
The transmission of HFMD is a complicated dynamical           shows that the L-DNM score of each node is mapped to
system with a lot of biomedical and social factors. Due       the actual map. When the actual number of clinic visits
to the massive number of influencing factors, it is diffi-    does not increase significantly as shown, L-DNM
cult to mathematically describe such transmission dy-         method has identified the pre-outbreak signal. In other
namics in a high-dimensional space. The sharp or              words, as the system approaches the bifurcation point,
qualitative transition from the normal state to the out-      the correlation both the local network and adjacent
break state of the local network corresponds to the bi-       wards increases dramatically, which indicates abnormal
furcation point in the theory of dynamic systems [21].        changes of the system. The dynamic evolution of city
Based on this theory, if the system approaches the bifur-     networks reveals the transmission situation and trend of
cation point, it will eventually be constrained to one-       HFDM, and better presents the transmission dynamics
dimensional or two-dimensional space (i.e., the centre        at the network level of the system.
manifold in general sense), where the dynamic system
can be expressed in a very simple form. This is the the-
oretical basis for developing a generic indicator that can    Application of L-DNM in Hokkaido and Osaka
detect pre-outbreak signals of HFMD based on observed         In order to verify the effectiveness of our model, we also
data.                                                         applied L-DNM to detect pre-outbreak signals of HFMD
   As shown in Fig. 1, we collected the historical informa-   in Hokkaido and Osaka, Japan. The results are shown in
tion of clinic hospitalization caused by HFMD infection       Figures S2-S6 of Additional File [see Additional file 1].
from January 1, 2009 to December 31, 2018 in Tokyo,             As can be seen from Figure S2, 30 wards of Hokkaido
Japan. The outbreak point of HFMD was defined as the          were modelled as a 30-node city network. Figure S3
peak of the hospitalization counts every year. According to   shows that there were seven seasonal normal outbreaks
the first step of L-DNM method, a 23-node network was         and three large-scale outbreaks of HFMD in Hokkaido
constructed based on the geographic distribution of 23        between year 2009 and year 2018, among which L-DNM
wards and their adjacent relationships (Fig. 3).              method provided pre-outbreak signals to nine outbreaks.
   Provided as in Fig. 4, the pre-outbreak signals were       It can be seen that the dynamic evolution of L-DNM
identified through L-DNM method for each seasonal             scores for each local network from Figure S4. The mod-
outbreak of HFDM. It can be seen that an uncontrol-           elling and mapping process of Osaka is similar, which is
lable outbreak of HFMD occurs every 2 to 3 years. For         shown in Figure S5. For Osaka (Figure S6), seven HFMD
example, in 2011, 2013, 2015 and 2017, the peak of the        outbreaks occurred from year 2012 to 2018, among
total hospitalization counts was about four times that of     which L-DNM method provided pre-outbreak signals
other years. In particular, CV-A6 emerged as a primary        for five outbreaks accurately. After the difference ana-
causative agent in 2011, causing the largest HFMD epi-        lysis of city networks, the reason we get is that the num-
demic in Japan since 1981 [22]. Since then, CV-A6 has         ber of Osaka’s network nodes is relatively small, which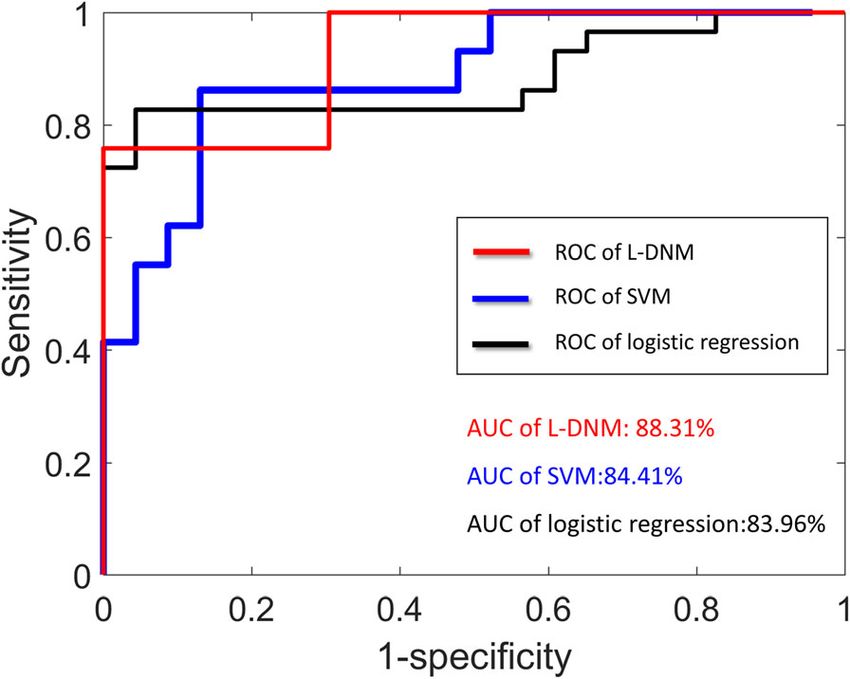
Zhang et al. BMC Infectious Diseases 2021, 21(Suppl 1):6                                                                                  Page 7 of 10

 Fig. 4 Forecast of seasonal HFMD outbreaks in Tokyo between the years 2009 and 2018. In each subgraph, the left y-axis is the average number
 of patients in each clinic and the right y-axis is the L-DNM score that was calculated based on a 5-week sliding window scheme; the x-axis
 represents the period from first week of the year to last week of the year. Besides, the markers of different colors and shapes are used to identify
 warning signals or outbreak points. Clearly, when the actual number of clinic visits has not increased significantly, significant changes in L-DNM
 scores have been detected, indicating the presence of pre-outbreak signals

 Fig. 5 The landscape of L-DNM score for 23 wards in Tokyo. In each landscape figure, the L-DNM scores of 23 wards in Tokyo are presented
 annually. The orange column points to the first appearance of warning signals, the red column indicates that the scale of infection is expanding
 and the pink column indicates an outbreak. Obviously, the warning signals are sensitive and effective. For the 10-year landscape figures, please
 see Figure S1 in additional file [see Additional file 1]
Zhang et al. BMC Infectious Diseases 2021, 21(Suppl 1):6                                                                             Page 8 of 10

 Fig. 6 Dynamic evolution map of L-DNM scores in Tokyo. Maps respectively in the 15th week (the normal stage), the 20th week (the pre-
 outbreak stage), the 25th week (the pre-outbreak stage) and the 30th week (the outbreak stage), are colored by the scaled value of L-DNM score
 (left of each submap) and the number of real clinic visits (right of each submap). It can be seen that the maps have no significant changes
 during the normal stage (e.g., the 15th week). However, as the system approaches the pre-outbreak stage (e.g., the 20th–25th week), the maps
 change dramatically, reflecting the apparent early warning signals of the upcoming outbreak

leads to the         inadequate       expression      of    network       data and search engine query data, are provided to test
information.                                                              the robustness of the developed models [28, 29]. It
                                                                          should be noted that L-DNM warning system proposed
Performance comparison with other methods                                 in this work is entirely based on the number of clinic
According to Tokyo Metropolitan Infectious Disease                        visits per year. That is to say, based on the data of 1 year,
Surveillance Center, the benchmark for alerting infec-                    our model can monitor and identify the pre-outbreak
tious disease epidemics is an average of five patients per
clinic. Obviously, the alarm appears too late to take
effective preventive measures. In addition, there are no
alarm signals in some years, such as 2010, etc. Therefore,
if L-DNM method is used, the above shortcomings can
be overcome. Moreover, the performance of comparing
L-DNM method with machine learning algorithm is
shown in Fig. 7. Specifically, logistic regression algorithm
and support vector machine (SVM) are applied to infec-
tious disease surveillance system [23–26]. As can be
clearly seen from Fig. 7, a DNM-based system performs
better than a system based on logistic regression or
SVM when only hospitalization records are given. In
recent years, deep learning approaches, such as a time
series model with long short-term memory (LSTM) [27],
have been applied to simulate the seasonality and trends
of infectious diseases incidence. But It is necessary for                   Fig. 7 The performance comparisons of L-DNM-based and machine-
LSTM to collect time-series data for many years, which                      learning-based methods. It can be seen that the L-DNM-based
is unrealistic for some developing countries. And since                     surveillance system performs better than the logistic regression or
the sample length and time periods adopted to construct                     SVM using only the records of Tokyo clinic visits. The AUC of L-DNM
                                                                            is 0.8831, while that of support vector machine is 0.8441 and that of
the models might have an impact on the forecasting
                                                                            logistic regression is 0.8396
power, additional data categories, such as meteorological
Zhang et al. BMC Infectious Diseases 2021, 21(Suppl 1):6 Page 9 of 10
signal in real time. Obviously, in order to solve practical Conclusion
problems, the size of small samples should also be set In this study, we proposed a computational method, the
appropriately. That is to say, at least five samples should so-called landscape dynamic network marker (L-DNM),
be given since the samples is processed by window shift- solely based on hospitalization records. In order to verify
ing where the width of window is set to 5. the effectiveness of our method, we illustrated the appli-
Actually, compared with traditional machine learning cation of L-DNM to detect pre-outbreak signals of
algorithms and deep learning approaches, L-DNM HFMD in Tokyo, Hokkaido and Osaka, Japan. This
method has the following natural advantages. First, it is method can effectively identify the pre-outbreak signals
a model-free approach that does not require training with an average of 5-week window lead prior to the cata-
and testing processes. There is no feature selection in L- strophic transition into HFMD outbreaks. The study on
DNM strategy, which solely depends on three statistical the dynamical changes of clinic visits in local networks
conditions of our model. Second, our approach can rely reveals the dynamic or landscapes of HFMD transmis-
on small samples rather than years of time series data. sion at the network level. As the algorithm shown in
So it can be applied in some developing countries that Methods section, the L-DNM is easy to implement and
lack public health infrastructure. very flexible. It is therefore of great potential in public
real-time surveillance for epidemic diseases.
Discussion
Recently, a large outbreak of HFMD has occurred in Supplementary Information
Japan, which attracts considerable attention. According The online version contains supplementary material available at https://doi.
org/10.1186/s12879-020-05709-w.
to World Health Organization (WHO), a large number
of outbreaks of HFMD have been reported in countries
Additional file 1: Figure S1. The landscape of L-DNM scores for 23
of the Western Pacific Region over the last decade, in- wards in Tokyo between the years 2009 and 2018. Figure S2. The city
cluding Japan, Malaysia and Singapore, and across China network for Hokkaido region. Figure S3. Forecast of seasonal HFMD out-
[30]. Those outbreaks not only make infected children breaks in Hokkaido between the years 2009 and 2018. Figure S4. The
landscape of L-DNM score for 30 wards in Hokkaido between the years
suffer from illness, but also make parents panic. The in- 2009 and 2018. Figure S5. The city network for Osaka, Japan. Figure S6:
cidence of HFMD appears to be increasing throughout Forecast of seasonal HFMD outbreaks in Osaka between the years 2012
the Asia-Pacific. This has prompted concerns that, with- and 2018.
out intervention, the public health impact and spread of
the disease will continue to intensify. In order to combat Abbreviations
HFMD: Hand, foot and mouth disease; L-DNM: Landscape dynamic network
the prevalence of HFMD, it is essential to establish a marker; DNB/DNM: Dynamic network biomarker/maker; SVM: Support vector
monitoring system that relies solely on robust informa- machine; LSTM: Long short-term memory; AUC: Area under the curve
tion, such as the real-time number of clinic visits. From
Acknowledgements
the successful application of the proposed approach, it is We would like to thank Dr. Jiayuan Zhong for productive discussions.
seen that the L-DNM is a model-free method, which is
data-driven and thus of great potential in practical real- About this supplement
time monitoring. This article has been published as part of BMC Infectious Diseases Volume 21
Supplement 1, 2021: Selected articles from the 18th Asia Pacific Bioinformatics
Specifically, unlike the critical transformation Conference (APBC 2020): infectious diseases. The full contents of the
analysis based on DNB of complex diseases with gen- supplement are available online at https://bmcinfectdis.biomedcentral.com/
omic datasets, DNB method has been improved and articles/supplements/volume-21-supplement-1.
applied to macroscopic city networks. Using a large- Authors’ contributions
scale metropolitan-wide HFMD surveillance dataset XHZ, RL and PC designed the research; XHZ performed the experiments and
over the past decade, the landscape dynamic network created the figures; RL and PC wrote and edited the manuscript. RX and YCP
provided direction for the project and its goals. All authors read and
marker incorporating the dynamical information of approved the final manuscript.
city networks is fitted to facilitate accurate and timely
pre-outbreak detection. In addition, hundreds of Funding
The work was funded by National Natural Science Foundation of China (Nos.
wards can be monitored simultaneously and the out- 11771152, 11901203, 11971176), Guangdong Basic and Applied Basic
break risk can be assessed by landscape DNM scores, Research Foundation (2019B151502062), China Postdoctoral Science
as presented in Figs. 5 and 6. It is noteworthy that L- Foundation funded project (No. 2019 M662895) and the Fundamental
Research Funds for the Central Universities (2020T130212).
DNM method proposed in this paper is based entirely
on the number of real-time clinic visits and has ob- Availability of data and materials
tained the remarkable results. Given more information The historical raw data of Tokyo region is available from Tokyo Metropolitan
about epidemic transmission, the L-DNM-based sur- Infectious Disease Surveillance Center (http://survey.tokyo-eiken.go.jp/
epidinfo/weeklyhc.do). The raw data of Hokkaido is available from Hokkaido
veillance system is expected to reliably predict HFMD Infectious Disease Surveillance Center (http://www.iph.pref.hokkaido.jp/
outbreaks in terms of sensitivity and accuracy. kansen/605/data.html). The raw data of Osaka is available from OsakaZhang et al. BMC Infectious Diseases 2021, 21(Suppl 1):6 Page 10 of 10
Infectious Disease Surveillance Center (http://www.iph.pref.osaka.jp/ 16. Chen P, Liu R, Chen L, Aihara K. Identifying critical differentiation state of
infection/2-old.html). MCF-7 cells for breast cancer by dynamical network biomarkers. Front
Genet. 2015;6:252.
17. Chen P, Li Y, Liu X, Liu R, Chen L. Detecting the tipping points in a three-
Ethics approval and consent to participate state model of complex diseases by temporal differential networks. J Transl
Not applicable. Med. 2017;15(1):217–5.
18. Chen P, Chen E, Chen L, Zhou XJ, Liu R. Detecting early-warning signals of
Consent for publication influenza outbreak based on dynamic network marker. J Cell Mol Med.
Not applicable. 2019;23(1):395–404.
19. Liu R, Wang X, Aihara K, Chen L. Early diagnosis of complex diseases by
molecular biomarkers, network biomarkers, and dynamical network
Competing interests biomarkers. Med Res Rev. 2014;34(3):455–78.
The authors declare that they have no competing interests. 20. Liu R, Chen P, Aihara K, Chen L. Identifying early-warning signals of critical
transitions with strong noise by dynamical network markers. Sci Rep. 2015;
Author details 5(1):17501.
1
School of Computer Science and Engineering, South China University of 21. Gilmore R. Catastrophe theory for scientists and engineers. Chelmsford:
Technology, Guangzhou 510006, China. 2School of Information, Guangdong Courier Corporation; 1993.
University of Finance and Economics, Guangzhou 510320, China. 3School of 22. Kanbayashi D, Kaida A, Yamamoto SP, Hirai Y, Kubo H, Fujimori R, et al.
Mathematics, South China University of Technology, Guangzhou 510640, Impact of Coxsackievirus A6 emergence on hand, foot, and mouth disease
China. 4Guangdong Science and Technology Infrastructure Center, epidemic in Osaka City, Japan. J Med Virol. 2017;89(12):2116–21.
Guangzhou 510033, China. 23. Fang LQ, Vlas S, Liang S, Looman C, Gong P, Xu B, et al. Environmental
factors contributing to the spread of H5N1 avian influenza in mainland
Published: 15 January 2021 China. PLoS One. 2008;3(5):e2268.
24. Sun D, Wang X, Fang L, et al. Epidemiological characteristics of hand, foot,
and mouth disease in the City of Linyi, in 2009. J Pathog Biol. 2011;6(2):108–
References 10.
1. Wu Y, Yeo A, Phoon MC, Tan EL, Poh CL, Quak SH, Chow VT. The largest 25. Bo Y, Song C, Wang J, Li X. Using an autologistic regression model to
outbreak of hand; foot and mouth disease in Singapore in 2008: the role of identify spatial risk factors and spatial risk patterns of hand, foot and mouth
enterovirus 71 and coxsackievirus a strains. Int J Infect Dis. 2010;14(12): disease (HFMD) in mainland China. BMC Public Health. 2014;14(1):358.
e1076–81. 26. Matsumoto R, Yoshida M, Matsumoto K, Matsuda H, Kita K. Visualization of
2. Koh WM, Bogich T, Siegel K, Jin J, Chong EY, Tan CY, et al. The the occurrence trend of infectious diseases using Twitter. In: Proceedings of
epidemiology of hand, foot and mouth disease in Asia: a systematic review the Eleventh International Conference on Language Resources and
and analysis. Pediatr Infect Dis J. 2016;35(10):e285–300. Evaluation (LREC 2018); 2018.
3. Huang M, Wang S, Hsu Y, Lin H, Chi C, Liu C. Long-term cognitive and 27. Wang Y, Xu C, Zhang S, Yang L, Wang Z, Zhu Y, et al. Development and
motor deficits after enterovirus 71 brainstem encephalitis in children. evaluation of a deep learning approach for modeling seasonality and trends
Pediatrics. 2006;118(6):e1785–8. in hand-foot-mouth disease incidence in mainland China. Sci Rep. 2019;9(1):
4. Chang L, Huang L, Gau SS, Wu Y, Hsia S, Fan T, et al. Neurodevelopment 8046–15.
and cognition in children after enterovirus 71 infection. N Engl J Med. 2007; 28. Chen B, Sumi A, Toyoda S, Hu Q, Zhou D, Mise K, et al. Time series analysis
356(12):1226–34. of reported cases of hand, foot, and mouth disease from 2010 to 2013 in
5. Sumi A, Toyoda S, Kanou K, Fujimoto T, Mise K, Kohei Y, et al. Association Wuhan, China. BMC Infect Dis. 2015;15(1):495.
between meteorological factors and reported cases of hand, foot, and 29. Du Z, Xu L, Zhang W, Zhang D, Yu S, Hao Y. Predicting the hand, foot, and
mouth disease from 2000 to 2015 in Japan. Epidemiol Infect. 2017;145(14): mouth disease incidence using search engine query data and climate
2896–911. variables: an ecological study in Guangdong, China. BMJ Open. 2017;7(10):
6. Chew S, Chong S, Barbier S, Matthew A, Lee JH, Chan YH. Risk factors for e016263.
severe hand foot mouth disease in Singapore: a case control study. BMC 30. World Health Organization. A guide to clinical management and public
Infect Dis. 2015;15(1):486. health response for hand, foot and mouth disease (HFMD). Geneva: WHO;
7. Zhuang Z, Kou Z, Bai Y, Cong X, Wang L, Li C, et al. Epidemiological 2011.
research on hand, foot, and mouth disease in Mainland China. Viruses. 2015;
7(12):6400–11.
8. Zheng YM, Yang J, Liao QH. Direct medical costs and influencing factors in Publisher’s Note
severe hand, foot and mouth disease in children aged between six months Springer Nature remains neutral with regard to jurisdictional claims in
and five years old. Zhonghua Yu Fang Yi Xue Za Zhi. 2017;51(1):87–92. published maps and institutional affiliations.
9. Wilson K, Brownstein J. Early detection of disease outbreaks using the
internet. Can Med Assoc J. 2009;180(8):829–31.
10. Woodall J. Official versus unofficial outbreak reporting through the internet.
Int J Med Inform. 1997;47(1–2):31–4.
11. Chen L, Liu R, Liu Z, Li M, Aihara K. Detecting early-warning signals for
sudden deterioration of complex diseases by dynamical network
biomarkers. Sci Rep. 2012;2(1):342.
12. Mojtahedi M, Skupin A, Zhou J, Castaño IG, Leong-Quong RYY, Chang H,
et al. Cell fate decision as high-dimensional critical state transition. PLoS
Biol. 2016;14(12):e2000640.
13. Richard A, Boullu L, Herbach U, Bonnafoux A, Morin V, Vallin E, et al. Single-
cell-based analysis highlights a surge in cell-to-cell molecular variability
preceding irreversible commitment in a differentiation process. PLoS Biol.
2016;14(12):e1002585.
14. Liu R, Yu X, Liu X, Xu D, Aihara K, Chen L. Identifying critical transitions of
complex diseases based on a single sample. Bioinformatics. 2014;30(11):
1579–86.
15. Liu R, Wang J, Ukai M, Sewon K, Chen P, Suzuki Y, et al. Hunt for the tipping
point during endocrine resistance process in breast cancer by dynamic
network biomarkers. J Mol Cell Biol. 2019;11(8):649–64.You can also read