Iron accumulation in the oculomotor nerve of the progressive supranuclear palsy brain
←
→
Page content transcription
If your browser does not render page correctly, please read the page content below
www.nature.com/scientificreports

                OPEN             Iron accumulation
                                 in the oculomotor nerve
                                 of the progressive supranuclear
                                 palsy brain
                                 Hansol Lee1, Myung Jun Lee2, Eun‑Joo Kim2, Gi Yeong Huh3, Jae‑Hyeok Lee4* &
                                 HyungJoon Cho1*
                                 Abnormal iron accumulation around the substantia nigra (SN) is a diagnostic indicator of
                                 Parkinsonism. This study aimed to identify iron-related microarchitectural changes around the SN
                                 of brains with progressive supranuclear palsy (PSP) via postmortem validations and in vivo magnetic
                                 resonance imaging (MRI). 7 T high-resolution MRI was applied to two postmortem brain tissues, from
                                 one normal brain and one PSP brain. Histopathological examinations were performed to demonstrate
                                 the molecular origin of the high-resolution postmortem MRI findings, by using ferric iron staining,
                                 myelin staining, and two-dimensional laser ablation-inductively coupled plasma-mass spectrometry
                                 (LA-ICP-MS) imaging. In vivo iron-related MRI was performed on five healthy controls, five patients
                                 with Parkinson’s disease (PD), and five patients with PSP. In the postmortem examination, excessive
                                 iron deposition along the myelinated fiber at the anterior SN and third cranial nerve (oculomotor
                                 nerve) fascicles of the PSP brain was verified by LA-ICP-MS. This region corresponded to those with
                                 high R2* values and positive susceptibility from quantitative susceptibility mapping (QSM), but was
                                 less sensitive in Perls’ Prussian blue staining. In in vivo susceptibility-weighted imaging, hypointense
                                 pixels were observed in the region between the SN and red nucleus (RN) in patients with PSP, but
                                 not in healthy controls and patients with PD. R2* and QSM values of such region were significantly
                                 higher in patients with PSP compared to those in healthy controls and patients with PD as well (vs.
                                 healthy control: p = 0.008; vs. PD: p = 0.008). Thus, excessive iron accumulation along the myelinated
                                 fibers at the anterior SN and oculomotor nerve fascicles may be a pathological characteristic and
                                 crucial MR biomarker in a brain with PSP.

                                 Abbreviations
                                 LA-ICP-MS	Laser ablation-inductively coupled plasma-mass spectrometry
                                 MRI	Magnetic resonance imaging
                                 PD	Parkinson’s disease
                                 PSP	Progressive supranuclear palsy
                                 QSM	Quantitative susceptibility mapping
                                 RN	Red nucleus
                                 ROS	Reactive oxygen species
                                 SN	Substantia nigra
                                 SWI	Susceptibility-weighted imaging
                                 TE	Echo time
                                 TR	Repetition time
                                 WM	White matter

                                 1
                                  Department of Biomedical Engineering, Ulsan National Institute of Science and Technology, 50, UNIST‑Gil,
                                 Eonyang‑eup, Ulju‑gun, Ulsan, South Korea. 2Department of Neurology, Pusan National University Hospital, Pusan
                                 National University School of Medicine and Biomedical Research Institute, Busan, South Korea. 3Department
                                 of Forensic Medicine, Pusan National University School of Medicine, Yangsan, South Korea. 4Department of
                                 Neurology, Research Institute for Convergence of Biomedical Science and Technology, Pusan National University
                                 Yangsan Hospital, 20, Geumo‑ro, Mulgeum‑eup, Yangsan‑si, Gyeongsangnam‑do, South Korea. *email:
                                 jhlee.neuro@pusan.ac.kr; hjcho@unist.ac.kr

Scientific Reports |   (2021) 11:2950               | https://doi.org/10.1038/s41598-021-82469-w                                             1

                                                                                                                                         Vol.:(0123456789)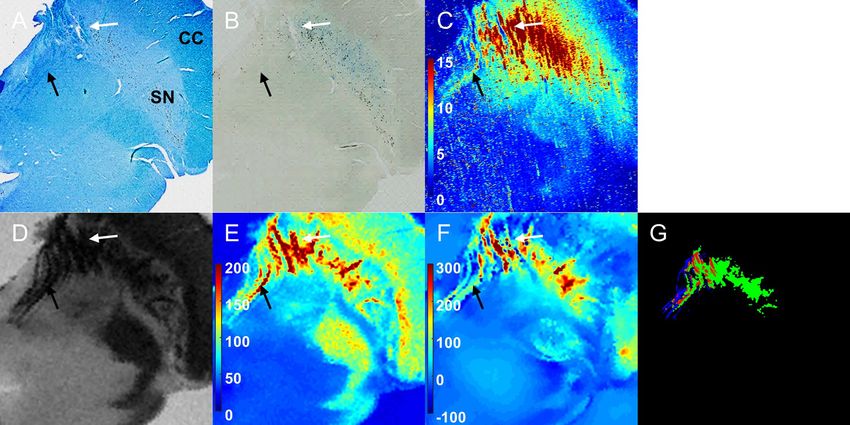
www.nature.com/scientificreports/
The common pathological characteristics of Parkinsonism are elevated iron deposition with neuronal degen-
eration in the substantia nigra (SN)1,2. Several studies have investigated the neurochemistry of iron-containing
molecules involved in the pathology of P arkinsonism3,4. Labile iron in the brain is associated with the genera-
tion of hydroxyl radicals and reactive oxygen species (ROS), leading to oxidative stress and cellular d amage5,6.
Specifically, high iron accumulation in the SN associated with disease progression results in detrimental dam-
age to neuromelanin-containing dopaminergic n eurons7,8. Iron accumulation in the SN can be visualized and
monitored using in vivo magnetic resonance imaging (MRI) using iron-sensitive sequences. R2* (1/T2*) map and
quantitative susceptibility mapping (QSM) have been applied to quantify the iron concentration within the SN
of patients of Parkinson’s disease (PD) and other Parkinsonian syndromes, including progressive supranuclear
palsy (PSP), and compared to those in healthy c ontrols9.
PSP is a degenerative parkinsonism characterized by hyperphosphorylated tau protein pathology and neu-
ronal cell loss in cortical and subcortical structures, including the SN and midbrain structures, globus pallidus,
and subthalamic nucleus10,11. Supranuclear vertical gaze palsy with significant midbrain atrophy has been recog-
SP12,13. Iron accumulation within the PSP brain also serves as a potential biomarker
nized as a cardinal feature of P
in in vivo MRI studies, and it has the ability to help distinguish patients with PSP from normal c ontrols9,14,15.
Significant increases in iron-related signals have been found in the SN, red nucleus (RN), and globus pallidus of
patients with P SP9. In postmortem MRI studies with pathological validation, the microstructural destruction of
the borders and internal architecture of the SN is far greater in PSP than that in P D16,17. In FLASH MR images,
the hypointense pixels near the boundary of the RN that adjoin the hypointense pixels of the SN resulted in less
delineation between the structures of the PSP m idbrain16. However, the exact underlying pathology of these
alterations is unknown.
This work focuses on verifying the histological origin of increased MR susceptibility contrast between the SN
and RN in the PSP midbrain and on ascertaining its utility as an in vivo diagnostic marker for PSP brains, which
can differentiate these patients from healthy controls and patients with PD. 7 T high-resolution postmortem
MRI of PSP and normal brains along with mutually independent iron characterization techniques including
histopathology and mass spectrometry were collectively investigated. 3 T in vivo iron-related MRIs of the brains
of healthy controls, PD, and PSP were compared.
Results
Postmortem study. The co-registered results of multimodal high-resolution MRI, histopathology, and the
two-dimensional image of iron distribution from laser ablation-inductively coupled plasma-mass spectrometry
(LA-ICP-MS) of the postmortem normal and PSP brains are presented in Figs. 1 and 2, respectively.
Overall, the myelinated fibers at the anterior SN and third cranial nerve (oculomotor nerve) fascicles were
observed in Luxol fast blue staining (white arrow for myelinated fibers at the anterior SN and black arrow for the
oculomotor nerve fascicles in Figs. 1A and 2A). Ferric iron deposition was detected using Perls’ Prussian blue
staining (Figs. 1B and 2B). The stained ferric iron was broadly distributed within the SN. The region of elevated
intensity for 56Fe/13C in LA-ICP-MS imaging (Figs. 1C and 2C) corresponded with the areas of the stained ferric
iron deposits (blue blush in Perls’ Prussian blue staining)18.
In the case of the normal brain, the area of deposited iron corresponded to the hypointense pixels in suscep-
tibility-weighted imaging (SWI) (Fig. 1D), and large R2* values were correspondingly observed in the same area
(Fig. 1E). In the QSM (Fig. 1F), ferric iron deposition was shown as paramagnetic molecules. The structure of
the so-called nigrosome-1 (the area of the orange asterisk) was detected as a hyperintense area in the SWI. This
area was also described as an oval-shaped area with lower R2* values and susceptibility compared to those of
surrounding tissues. Nigrosome-1 had lightly stained iron distribution in Perls’ Prussian blue staining and a low
intensity of iron (56Fe/13C). The R2* map and QSM further showed linear myelinated fibers with moderately high
values distributed in the anterior SN (white arrow in each image). No iron accumulation along the oculomotor
nerve fascicles (black arrow) was observed on iron-related MRI or 56Fe/13C from LA-ICP-MS.
In the case of PSP, the volume atrophy of the midbrain was apparent compared to that in normal SN. Similar to
a normal SN, iron deposition was identified as large R2* values in Fig. 2E. In particular, the region with both large
values in the R2* map and positive susceptibility values in the QSM (Fig. 2F) included the oculomotor nerve (black
arrow) fascicles and myelinated fibers in the anterior SN (white arrow) identified from Luxol fast blue staining.
The 56Fe/13C intensity from LA-ICP-MS also showed a significant iron signal in the area of myelinated fiber at the
anterior SN and oculomotor nerve fascicles, directly indicating iron accumulation along the oculomotor nerve.
The spatially overlapped region (red) between segmented myelinated fibers from Luxol fast blue staining (blue)
and hypointense regions from SWI (green) is shown in Fig. 2G. On the other hand, such iron distribution along
the myelinated fibers in the PSP brain was not sensitively stained in the Perls’ Prussian blue staining (Fig. 2B).
Considering the age and gender differences between the normal control and PSP brains, the additional results
of Luxol fast blue, Perls’ Prussian blue staining, R2* map, and QSM of the postmortem midbrain of a 60-year-old
normal male and a 70-year-old normal female are presented in Supplementary Fig. 1. The myelinated fibers of
the oculomotor nerve detected in Luxol fast blue staining were not distinctively shown in the R2* map and QSM
as indicated by red arrows. The mild iron concentration along myelinated fibers in the two normal control cases
was not enough to overwhelm the effect of diamagnetic myelinated fibers in QSM, which was clearly observed
in 67-year-old male PSP brains.
In vivo MRI. For in vivo MRI, representative MR images of the SWI, R2* map, and QSM showing rostral SN
in healthy control, PD, and PSP groups are presented in Fig. 3. The values of R2* map and QSM in SN were high-
est in patients with PSP, followed by patients with PD and then healthy controls. Marked atrophy of the midbrain
was observed in all patients with PSP compared to those of healthy controls and patients with PD in the same
Scientific Reports | (2021) 11:2950 | https://doi.org/10.1038/s41598-021-82469-w 2
Vol:.(1234567890)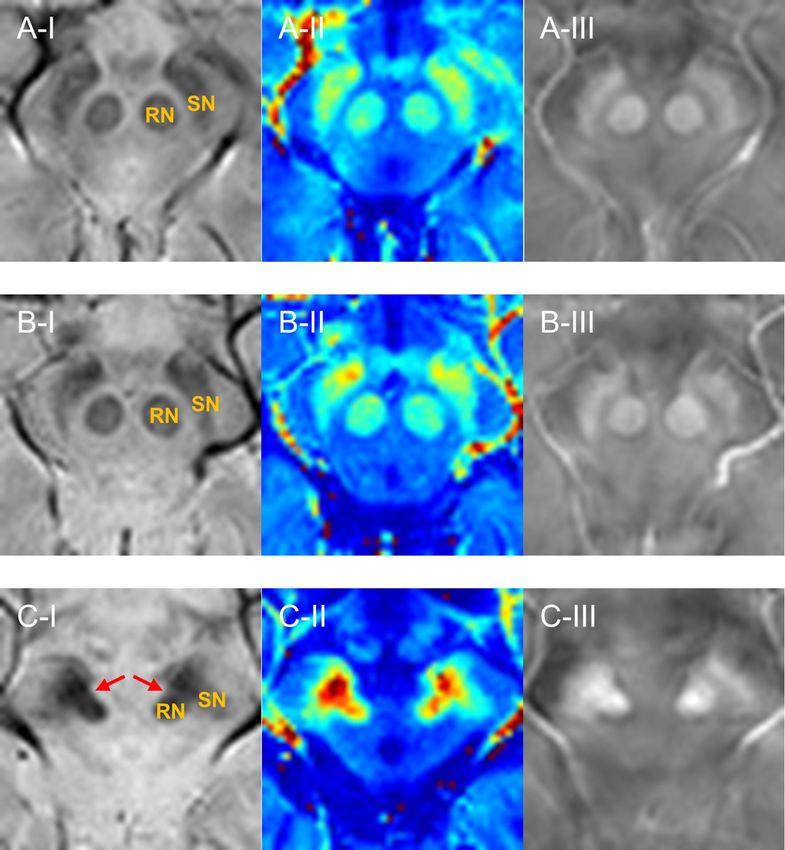
www.nature.com/scientificreports/
Figure 1. Histopathology and LA-ICP-MS with multimodal MRI on the postmortem SN of an 86-year-
old normal female. (A): Luxol fast blue staining; (B): Perls’ Prussian blue staining; (C): 56Fe/13C intensity
from LA-ICP-MS imaging (a.u.); (D): SWI; (E): R2* map (1/s); (F): QSM (ppb); White and black arrows
indicate myelinated fibers at anterior SN and oculomotor nerve. Orange asterisk shows the structure of
nigrosome-1. CC = crus cerebri; LA-ICP-MS = laser ablation-inductively coupled plasma-mass spectrometry;
QSM = quantitative susceptibility mapping; SN = substantia nigra; SWI = susceptibility-weighted imaging.
Figures were generated from MATLAB (version R2016a, MathWorks, Natick, MA, USA).
field of view. In the SWI, a clear hyperintense boundary was identified in the region between the hypointense
SN and the hypointense RN in healthy controls and patients with PD (Fig. 3A-I, B-I). However, in the case of
PSP, the hypointense area was shown at the areas bridging the SN and RN as an atypical connection between
two tissues with blurred boundaries (Fig. 3C-I). This connection was also identified in the R2* map and QSM of
patients with PSP (Fig. 3C-II,III).
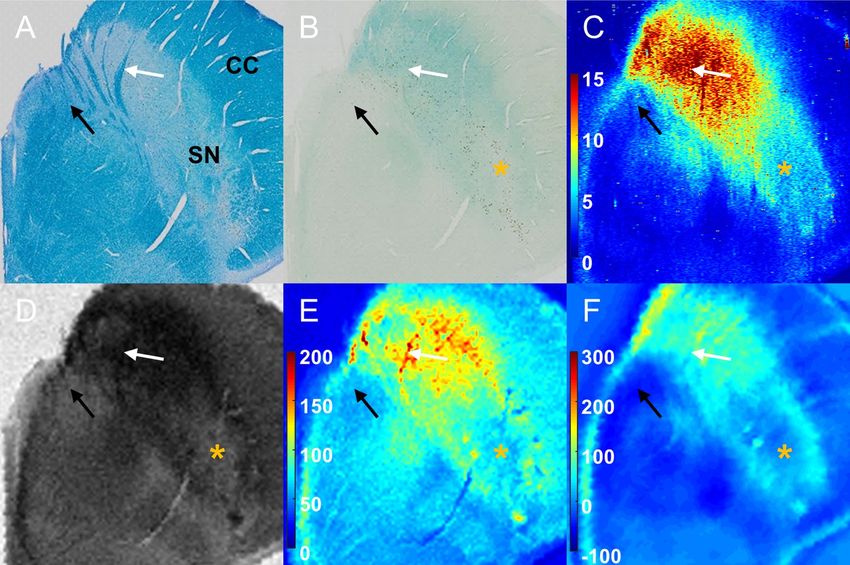
In Fig. 4, the respective line profiles of normalized SWI intensities are presented across the SN and RN along
the two separate lines of the three groups, as shown in Fig. 4A. To visualize the selectivity of such lines to myeli-
nated white matter, the myelin of the oculomotor nerve fascicles passing by the RN and the myelin in the anterior
SN were connected by red lines in Luxol fast blue staining, as shown in Fig. 4B. Ten line profiles of healthy con-
trols along both red and blue lines in the SWI (Fig. 4C-I,IV) showed hyperintensity in the white matter region
(WM in the x-axis) bridging the SN and RN. Hyperintense areas were also maintained in the white matter region
between the SN and RN in patients with PD (Fig. 4C-II,V). Conversely, for patients with PSP, the SN, RN, and
white matter region between the two tissues were hypointense, which resulted in blurred structural boundaries
(Fig. 4C-III,VI). The line profiles for R2* and QSM values along the blue line in SWI are presented in Supple-
mentary Fig. 2. The line profiles of R2* and QSM showed a concave pattern in the region between the SN and RN
in both healthy controls and patients with PD, but such trend was significantly decreased in patients with PSP.
The mean and standard deviation of R2* and QSM values in the region bridging the SN and RN were com-
pared among the three groups (Table 1). R2* and QSM values of PSP were significantly higher than those of the
other two groups (R2*: p = 0.008 with healthy controls, p = 0.008 with PD; QSM: p = 0.008 with healthy controls,
p = 0.008 with PD). However, the differences in R2* and QSM values between healthy controls and PD groups
were negligible (p = 0.421 and p = 1, respectively) in the region bridging the SN and RN. For the datasets with
separated left and right sides of the brain, R2* and QSM values of PSP were more significantly distinguishable
from those of other two groups, as demonstrated by the p-values in parentheses.
Discussion
The main finding in this study is that iron deposition along the myelinated fibers at the anterior SN and oculomo-
tor nerve fascicles in the brain of patients with PSP can be visualized using multiple independent approaches,
such as 7 T postmortem MRI, histological analysis, mass spectrometry, and in vivo 3 T MRI. Our postmortem
examinations showed that the increased MR susceptibility contrast between the SN and RN identified in patients
with PSP is likely to originate from excessive iron deposition along the myelinated nerves between these two
Scientific Reports | (2021) 11:2950 | https://doi.org/10.1038/s41598-021-82469-w 3
Vol.:(0123456789)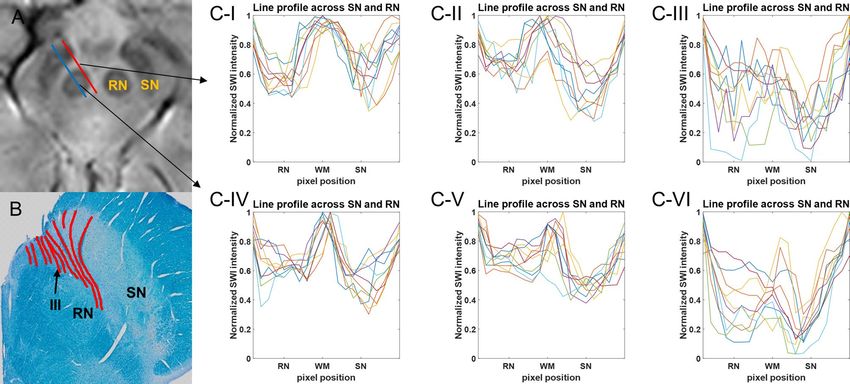
www.nature.com/scientificreports/
Figure 2. Histopathology and LA-ICP-MS with multimodal MRI on the postmortem SN of a 67-year-old male
with PSP. (A): Luxol fast blue staining; (B): Perls’ Prussian blue staining; (C): 56Fe/13C intensity from LA-ICP-MS
imaging (a.u.); (D): SWI; (E): R2* map (1/s); (F): QSM (ppb). (G) The overlap (red) between myelinated fiber
(blue) and hypointense SWI area (green). White and black arrows indicate myelinated fibers at anterior SN
and oculomotor nerve. CC = crus cerebri; LA-ICP-MS = laser ablation-inductively coupled plasma-mass
spectrometry; PSP = progressive supranuclear palsy; QSM = quantitative susceptibility mapping; SN = substantia
nigra; SWI = susceptibility-weighted imaging. Figures were generated from MATLAB (version R2016a,
MathWorks, Natick, MA, USA).
structures. To our knowledge, this is the first report demonstrating a higher level of iron deposition along the
myelinated fibers at the anterior SN and oculomotor nerve fascicles in the vicinity of the SN and RN of patients
with PSP compared to those of patients with PD and healthy controls by using R2*, QSM, and LA-ICP-MS.
Atrophy of the midbrain, which is a recognized characteristic in patients with PSP, may shorten the gap
between the SN and RN. The shortened gap between the SN and RN probably causes an atypical connection
between the two structures with blurred boundaries in low-resolution on in vivo MRI. Regardless of the volume
loss in PSP brain, the fibers of oculomotor nerve would still present between the SN and RN. In our postmortem
examinations of the PSP midbrain, Luxol fast blue staining showed the distribution of myelinated fibers at the
anterior SN and the oculomotor nerve fascicles, which had a considerably high iron (56Fe/13C) signal intensity
in the LA-ICP-MS image. The corresponding area had large R2* values and positive susceptibility values in the
QSM. The spatial overlap between myelinated fibers from Luxol fast blue staining and the hypointense region in
SWI demonstrated that the myelinated fibers with high iron concentration were non-invasively observed in the
iron-related MRI. However, Perls’ Prussian blue staining, which is the conventional method used to determine
the distribution of ferric iron within brain tissues, was less sensitive for staining myelin-associated iron.
It is still unclear why there is a high concentration of iron deposits along the myelinated fibers of the oculo-
motor nerve in association with PSP progression. There are several possible explanations for this abnormal iron
deposition. (1) In human studies, high levels of iron have been reported to co-localize with hyperphosphorylated
tau aggregates19. Tau-containing globose neurofibrillary tangles are prevalent in the PSP midbrain, including in
the oculomotor nerve c omplex20. (2) Anatomically, the fibers of the oculomotor nerve fascicles from the nucleus
pass by the RN and SN, and these two structures contain a high level of iron concentration17. Excessive iron
accumulation within both the SN and RN can also cause abnormal iron deposition along the nearby myelinated
fiber. (3) The vulnerability of myelinated fibers and oligodendrocytes to oxidative stress may be further acceler-
ated by their high iron environment as myelination and axon maturation require iron consumption21,22. The
dysfunction of the iron homeostasis mechanism in myelinated fibers, such as impaired iron transportation of
the iron transport tract and imperfect iron excretion from the neurons, can cause high iron deposition along the
associated myelinated fibers23,24. The increased iron level along the myelinated fiber of the oculomotor nerve is
likely to result in neuronal damage with disease p rogression7.
Although white matter, including myelinated fibers, is originally considered the main diamagnetic source
in the brain due to its heavy phospholipid component, a high level of iron-containing molecules is also stored
in myelin and oligodendrocytes as they have high iron requirements25. As demonstrated in the present study,
iron deposition along the myelinated fiber around the SN can be a specific endogenous iron cluster, because the
overloads of iron deposition along myelinated fibers overwhelm diamagnetism and induce paramagnetism as
a myelin-iron c omplex25,26. Moreover, various forms of endogenous iron clusters are distributed within the SN,
including the neuromelanin-iron complex, reactive ferric irons in neurons and glial cells, pathological hallmarks
Scientific Reports | (2021) 11:2950 | https://doi.org/10.1038/s41598-021-82469-w 4
Vol:.(1234567890)www.nature.com/scientificreports/
Figure 3. The representative MRI showing the SN and RN. (A) Representative case (61F) of the healthy control
group. (B) Representative case (60M) of the PD group. (C) Representative case (66M) of the PSP group. The red
arrows in (C-I) show the hypointensity in the region between SN and RN. (I): SWI; (II): R2* map; (III): QSM.
PD = Parkinson’s disease; PSP = progressive supranuclear palsy; QSM = quantitative susceptibility mapping;
SN = substantia nigra; SWI = susceptibility-weighted imaging; RN = red nucleus. Figures were generated from
MATLAB (version R2016a, MathWorks, Natick, MA, USA).
of disorders apart from iron such as α-synuclein or tau, and the heme iron in microvessels crossing the SN27–30. All
these endogenous iron clusters within the SN need to be interpreted with care in in vivo iron-related MR contrast.
This study had several limitations. First, the postmortem sample size was small. However, a previous post-
mortem study on the SN of normal control and PSP brains showed consistent hypointensity between the SN
and RN only in the PSP b rain16. Second, we have not presented the corresponding images from postmortem PD
midbrains for direct comparison between PD and PSP midbrain tissues. In PD, the most severely affected regions
are reported to be nigrosomes, containing most dopaminergic neurons, at the posterior SN31. The evaluation
of the presence of nigrosome-1 in the posterior SN (rather than the anterior SN in the analysis of PD brain) in
MRI has been utilized as a promising biomarker for PD diagnosis. Third, the disease severity (H-Y stage) was
different between patients with PD and PSP, which may influence MR contrast. PSP is known to progress more
rapidly than PD, and it is difficult to match disease duration and H-Y stage together between the two g roups32.
Further investigation should be pursued on a larger number of subjects with no significant differences in age,
sex, and disease severity in each group. Histopathological validation is also recommended for postmortem PD
and PSP brains with a large sample in future studies.
Scientific Reports | (2021) 11:2950 | https://doi.org/10.1038/s41598-021-82469-w 5
Vol.:(0123456789)www.nature.com/scientificreports/
Figure 4. The line profile of normalized SWI intensity across the SN and RN. (A): SWI (B): Luxol fast blue
staining with red lines for myelin distribution; (C-I), (C-IV): The line profile of normalized SWI intensity
of healthy controls; (C-II), (C-V): The line profile of normalized SWI intensity of patients with PD; (C-III),
(C-VI): The line profile of normalized SWI intensity of patients with PSP. The line profiles of (C-I–C-III) were
delineated along the red line in SWI. The line profiles of (C-IV–C-VI) were delineated along the blue line in
SWI. PD = Parkinson’s disease; PSP = progressive supranuclear palsy; SN = substantia nigra; RN = red nucleus;
WM = white matter between SN and RN. (A,B) were generated from MATLAB (version R2016a, MathWorks,
Natick, MA, USA).
Kruskal–
Wallis post-hoc (p)
Control PD PSP χ2 p Control vs. PD Control vs. PSP PD vs. PSP
R2* values (s−1) 33.7 ± 1.6 37.3 ± 5.6 54.9 ± 8.0 9.8 0.008* 0.421 (0.473) 0.008* (< 0.001**) 0.008* (0.002**)
QSM (ppb) 31.2 ± 15.4 34.1 ± 11.9 116.2 ± 23.7 9.4 0.009* 1 (0.910) 0.008* (< 0.001*) 0.008* (< 0.001**)
Table 1. Comparison of R2* and QSM in the region between SN and RN among PD, PSP and healthy control
groups. Data are shown as mean ± standard deviation. Post-hoc (p) = p-values from post-hoc analysis of
Mann–Whitney U test. Control = healthy control; PD = Parkinson’s disease; PSP = progressive supranuclear
palsy; SN = substantia nigra; RN = red nucleus. *p < 0.05 (For post-hoc analysis, *p < 0.05/3 and **p < 0.005/3
after Bonferroni correction).
In conclusion, the current study has demonstrated excessive iron deposition along the myelinated fiber at the
anterior SN and the third cranial nerve (oculomotor nerve) in the PSP brain, applied this knowledge to under-
stand the in vivo iron-related MR contrast seen in patients with PSP, and compared it to those of healthy controls
and patients with PD. Consequently, it was found that the connection between the SN and RN in in vivo SWI, R2*
map, and QSM in patients with PSP can be a useful MR biomarker in the differential in vivo diagnosis of patients
with PSP from healthy controls, patients with PD, and other patients with atypical Parkinsonian syndrome.
Methods
This study was approved by the Pusan National University Yangsan Hospital and Ulsan National University of
Science and Technology institutional review board. All procedures, including the in vivo MRI, postmortem
MRI, mass spectrometry, and histopathological analysis were conducted according to the guidelines of the
Helsinki Declaration. The images were processed using in-house developed MATLAB codes (version R2016a,
MathWorks, Natick, MA, USA).
Postmortem MRI and histopathological analysis. Midbrain specimens of an 86-year-old female
without any neurodegenerative disease were acquired from the Pusan National University Anatomical Dona-
tion Program. A diseased midbrain tissue, which was characterized by severe midbrain atrophy, frontotemporal
lobar degeneration, tau pathology, and depigmentation in the SN, from a 67-year-old male diagnosed with PSP
was obtained from the Pusan National University Hospital Brain Bank. The formalin-fixed midbrain samples
were stored in a 4 °C refrigerator for more than 2 years for sufficient stabilization of MR properties33,34. Forma-
lin fixation redistributes iron within the tissues35. Although it may alter the staining intensity and the absolute
Scientific Reports | (2021) 11:2950 | https://doi.org/10.1038/s41598-021-82469-w 6
Vol:.(1234567890)www.nature.com/scientificreports/
PD PSP Control
Subjects (M/F) 3/2 4/1 2/3
Age (years) 61.2 ± 3.7 64.2 ± 2.2 61.0 ± 2.7
Disease duration (years) 4.8 ± 3.1 3.4 ± 0.5 –
H-Y stage 2.0 ± 0.5 3.4 ± 0.5 –
Table 2. Demographic and clinical characteristics of PD, PSP, and healthy control groups. Data are shown
as mean ± standard deviation. Control = healthy control; H-Y = Hoehn & Yahr; PD = Parkinson’s disease;
PSP = progressive supranuclear palsy.
transverse relaxometry values (R2*) in postmortem MR images, the contrast of postmortem SWI, R2*, and QSM
within brain tissues were maintained from in vivo MRI35,36.
Two tissues were placed in 50 mL syringes separately after removing air bubbles because bubbles around the
tissue surface cause susceptibility artifacts on MR images. High-resolution MR acquisitions were performed on
tissues using 7 T preclinical MRI (Bruker, Karlsruhe, Germany) at Ulsan National University of Science and Tech-
nology to validate the origin of the in vivo MRI contrast. SWI, R2* map, and QSM were used to evaluate iron and
myelin contents in 2D multiple gradient echo sequence acquired using the following parameters: repetition time
(TR) = 2000 ms, echo time (TE) = 3.3–81.2 ms (20 echoes with TE = 4.1 ms), flip angle = 30°, field of view = 35
× 35 mm, matrix size = 256 × 256, slice thickness = 500 μm, and number of slices = 20. The slice geometry was
perpendicular to the main magnetic field. SWI was acquired using magnitude and phase images of TE = 15.6 ms.
The R2* map was obtained from the magnitude image by mono-exponential fitting of the T2* transverse relaxation
curve on each voxel. QSM was reconstructed from phase images of five tilted orientations using the Laplacian
boundary value (LBV) algorithm for background field removal and calculation of susceptibility through multiple
orientation sampling (COSMOS)37,38. T1-weighted images were also acquired with 2D RARE sequence for co-
registration with histological analysis using the following parameters: TR = 800 ms, TE = 8 ms, flip angle = 30°,
field of view = 35 × 35 mm, matrix size = 256 × 256, slice thickness = 500 μm, and number of slices = 20.
After the MR scan, tissue samples were subjected to histopathological analysis, which is a gold standard to
demonstrate the effect of underlying elements on the corresponding MR images. For the tissue cryoprotection,
to minimize osmotic stress and ice formation during cooling, tissues were sequentially embedded in 10%, 20%,
and 30% sucrose in Phosphate-buffered saline solution until they sank. Thin slides of 50 μm thickness were
generated using a cryostat (CM1950, Leica Biosystems, Nussloch, Germany). Ten sectioned slides (thickness
50 μm) were prepared from one corresponding MR image (thickness 500 μm). Of ten sections, three adjacent
slides were used serially for Perls’ Prussian blue staining, Luxol fast blue staining, and LA-ICP-MS, respectively.
Perls’ Prussian blue staining was performed for detecting ferric iron distribution. For Perls’ Prussian blue
staining, the slides were incubated in a 1:1 mixed solution of 20% HCl and 20% potassium ferrocyanide for
30 min. Luxol fast blue staining was performed to identify the distribution of myelinated fibers by soaking the
tissues in 0.1% filtered Luxol fast blue solution at 65 °C in an oven overnight and counterstained with 0.1%
cresyl violet acetate solution. The histological slides were imaged using Virtual Microscope (Olympus Optical
Co. Ltd, Tokyo, Japan).
LA-ICP-MS was conducted to detect all molecular forms of iron within brain tissues on the slide that was
neither stained with Perls’ Prussian blue nor Luxol fast blue. Two-dimensional images of 56Fe and 13C intensity
were obtained by line scan using a quadrupole ICP-MS device, iCAP TQ (ThermoFisher Scientific, Bremen,
Germany) with a femtosecond laser (1030 nm) ablation system (J200, Applied Spectra, Inc, Fremont, CA, USA).
For the comparison of iron concentration between tissues, 56Fe intensity was normalized by 13C intensity to
compensate sample-to-sample variations in laser ablation measurements, as 13C is a suitable internal standard
for quantitative elemental bio-imaging39.
For direct comparisons, postmortem MRI was co-registered with corresponding histological results and LA-
ICP-MS images. Due to the different spatial resolutions among images, MR images and images of 56Fe and 13C
intensity from LA-ICP-MS were up-sampled by bicubic interpolation before co-registration. The two-dimensional
rigid transformation of rotation and translation was performed on up-sampled MR images and up-sampled
images of 56Fe and 13C intensity from LA-ICP-MS to match the images of Luxol fast blue staining. The same
transformation method was also used for the co-registration of the image of Perls’ Prussian blue staining to the
image of Luxol fast blue staining.
In vivo MRI. Five patients with PSP, along with five age-matched patients with PD and five age-matched
healthy controls, were included in this study. The demographic features of all participants are summarized in
Table 2. Patients were clinically diagnosed by a movement disorder neurologist in accordance with the established
criteria for each disorder40,41. Although there was no significant difference in age and disease duration between
patients with PD and those with PSP, the H-Y stage was significantly higher in patients with PSP (p = 0.008).
All subjects provided informed consent and underwent 3 T in vivo MRI (Magnetom Skyra, Siemens, Erlangen,
Germany) at Pusan National University Yangsan Hospital. SWI, R2* map, and QSM were taken with a 2D gradi-
ent echo sequence using the following parameters: TR = 2030 ms, TE = 3.1–29.9 ms (6 echoes with TE = 4.8,
5.5, …, 5.5 ms), flip angle = 60°, field of view = 192 × 192 mm, matrix size = 192 × 192, slice thickness = 2 mm,
and number of slices = 60. SWI was acquired using the magnitude and phase images of TE = 24.6 ms. The R2*
map was obtained using the same technique of postmortem MRI. QSM was reconstructed using MATLAB-
Scientific Reports | (2021) 11:2950 | https://doi.org/10.1038/s41598-021-82469-w 7
Vol.:(0123456789)www.nature.com/scientificreports/
based software, STI-Suite (version 3.0, University of California, Berkeley, CA, USA, https://people.eecs.berkeley.
edu/~chunlei.liu/software.html). Among the 60 slices, the slice of the second level in the rostral direction show-
ing the SN with a clear shape of the RN was consistently selected for each subject for the analysis.
The line profile of normalized SWI intensity, R2*, and QSM across the SN and RN were plotted along the two
different lines for each group (right and left sides of five subjects in each group). SWI intensity was normalized by
the maximum intensity value of each line profile. The white matter region between the SN and RN was manually
delineated in SWI by H.L. as shown in Supplementary Fig. 3. The quantitative values of R2* and QSM within the
region between the SN and RN using the same ROI from SWI were compared among the three groups using a
Kruskal–Wallis H test. Bonferroni correction was performed for multiple comparisons with significance levels
of 0.05/3 = 0.0166.
Data availability
The data of the postmortem examination and in vivo MRI with limited demographic and clinical information
are available from the corresponding authors upon reasonable requests.
Code availability
The MATLAB code used in this study is available from the corresponding authors upon reasonable requests.
Received: 7 September 2020; Accepted: 4 January 2021
References
1. Dexter, D. T. et al. Alterations in the levels of iron, ferritin and other trace metals in Parkinson’s disease and other neurodegenera-
tive diseases affecting the basal ganglia. Brain 114(4), 1953–1975 (1991).
2. Ward, R. J., Zucca, F. A., Duyn, J. H., Crichton, R. R. & Zecca, L. The role of iron in brain ageing and neurodegenerative disorders.
Lancet Neurol. 13(10), 1045–1060 (2014).
3. Sian-Hülsmann, J., Mandel, S., Youdim, M. B. & Riederer, P. The relevance of iron in the pathogenesis of Parkinson’s disease. J.
Neurochem. 118(6), 939–957 (2011).
4. Belaidi, A. A. & Bush, A. I. Iron neurochemistry in Alzheimer’s disease and Parkinson’s disease: Targets for therapeutics. J. Neu-
rochem. 139, 179–197 (2016).
5. Kruszewski, M. Labile iron pool: The main determinant of cellular response to oxidative stress. Mutat. Res. Fundam. Mol. Mech.
Mutagen. 531(1–2), 81–92 (2003).
6. Zucca, F. A. et al. Interactions of iron, dopamine and neuromelanin pathways in brain aging and Parkinson’s disease. Prog. Neu-
robiol. 155, 96–119 (2017).
7. Lee, D. W. & Andersen, J. K. Iron elevations in the aging Parkinsonian brain: A consequence of impaired iron homeostasis?. J.
Neurochem. 112(2), 332–339 (2010).
8. Sukhorukova, E. G., Alekseeva, O. S. & Korzhevsky, D. E. Catecholaminergic neurons of mammalian brain and neuromelanin. J.
Evol. Biochem. Physiol. 50(5), 383–391 (2014).
9. Lee, J. H. & Lee, M. S. Brain iron accumulation in atypical parkinsonian syndromes: In vivo MRI evidences for distinctive patterns.
Front. Neurol. 10, 74 (2019).
10. Brooks, D. J. Diagnosis and management of atypical Parkinsonian syndromes. J. Neurol. Neurosurg. Psychiatry 72(suppl 1), i10–i16
(2002).
11. Dickson, D. W. Parkinson’s disease and parkinsonism: Neuropathology. Cold Spring Harb. Perspect. Med. 2(8), a009258 (2012).
12. Grandas, F. & Esteban, A. Eyelid motor abnormalities in progressive supranuclear palsy. J. Neural Transm. 42, 33–41 (1994).
13. Lamberti, P., De Mari, M., Zenzola, A., Aniello, M. S. & Defazio, G. Frequency of apraxia of eyelid opening in the general popula-
tion and in patients with extrapyramidal disorders. Neurol. Sci. 23(2), s81–s82 (2002).
14. Gupta, D., Saini, J., Kesavadas, C., Sarma, P. S. & Kishore, A. Utility of susceptibility-weighted MRI in differentiating Parkinson’s
disease and atypical parkinsonism. Neuroradiology 52(12), 1087–1094 (2010).
15. Sjöström, H., Granberg, T., Westman, E. & Svenningsson, P. Quantitative susceptibility mapping differentiates between Parkinso-
nian disorders. Parkinsonism Relat. Disord. 44, 51–57 (2017).
16. Foroutan, P. et al. Progressive supranuclear palsy: High-field-strength MR microscopy in the human substantia nigra and globus
pallidus. Radiology 266(1), 280–288 (2013).
17. Massey, L. A. et al. 9.4 T MR microscopy of the substantia nigra with pathological validation in controls and disease. NeuroImage
Clin. 13, 154–163 (2017).
18. Lee, H. et al. MRI T2 and T2* relaxometry to visualize neuromelanin in the dorsal substantia nigra pars compacta. NeuroImage.
211, 116625 (2020).
19. Rao, S. S. & Adlard, P. A. Untangling tau and iron: Exploring the interaction between iron and tau in neurodegeneration. Front.
Mol. Neurosci. 11, 276 (2018).
20. Shoeibi, A., Olfati, N. & Litvan, I. Frontrunner in translation: Progressive supranuclear palsy. Front. Neurol. 10, 1125 (2019).
21. Bartzokis, G., Lu, P. H. & Mintz, J. Human brain myelination and amyloid beta deposition in Alzheimer’s disease. Alzheimer’s
Dementia. 3(2), 122–125 (2007).
22. Möller, H. E. et al. Iron, myelin, and the brain: Neuroimaging meets neurobiology. Trends Neurosci. 42(6), 384–401 (2019).
23. Heidari, M. et al. Brain iron accumulation affects myelin-related molecular systems implicated in a rare neurogenetic disease family
with neuropsychiatric features. Mol. Psychiatry. 21(11), 1599–1607 (2016).
24. Peckham, M. E. et al. Novel pattern of iron deposition in the fascicula nigrale in patients with Parkinson’s disease: A pilot study.
Radiol. Res. Pract. 2016, 930501 (2016).
25. Duyn, J. H. & Schenck, J. Contributions to magnetic susceptibility of brain tissue. NMR Biomed. 30(4), e3546 (2017).
26. Wisnieff, C. et al. Quantitative susceptibility mapping (QSM) of white matter multiple sclerosis lesions: Interpreting positive
susceptibility and the presence of iron. Magn. Reson. Med. 74(2), 564–570 (2015).
27. Langley, J. et al. Multicontrast approach for comprehensive imaging of substantia nigra. NeuroImage. 112, 7–13 (2015).
28. Trujillo, P. et al. Contrast mechanisms associated with neuromelanin-MRI. Magn. Reson. Med. 78(5), 1790–1800 (2017).
29. Lewis, M. M. et al. Susceptibility MRI captures nigral pathology in patients with parkinsonian syndromes. Mov. Disord. 33(9),
1432–1439 (2018).
30. Kau, T. et al. Microvessels may confound the “swallow tail sign” in normal aged midbrains: A postmortem 7 T SW-MRI Study. J.
Neuroimaging 29(1), 65–69 (2019).
Scientific Reports | (2021) 11:2950 | https://doi.org/10.1038/s41598-021-82469-w 8
Vol:.(1234567890)www.nature.com/scientificreports/
31. Damier, P., Hirsch, E. C., Agid, Y. & Graybiel, A. M. The substantia nigra of the human brain: II. Patterns of loss of dopamine-
containing neurons in Parkinson’s disease. Brain 122(8), 1437–1448 (1999).
32. Litvan, I. et al. SIC Task Force appraisal of clinical diagnostic criteria for parkinsonian disorders. Mov. Disord. 18(5), 467–486
(2003).
33. Raman, M. R., Shu, Y., Lesnick, T. G., Jack, C. R. & Kantarci, K. Regional T1 relaxation time constants in ex vivo human brain:
Longitudinal effects of formalin exposure. Magn. Reson. Med. 77(2), 774–778 (2017).
34. Dawe, R. J., Bennett, D. A., Schneider, J. A., Vasireddi, S. K. & Arfanakis, K. Postmortem MRI of human brain hemispheres: T2
relaxation times during formaldehyde fixation. Magn. Reson. Med. 61(4), 810–818 (2009).
35. Birkl, C. et al. Effects of formalin fixation and temperature on MR relaxation times in the human brain. NMR Biomed. 29(4),
458–465 (2016).
36. Langkammer, C. et al. Quantitative susceptibility mapping (QSM) as a means to measure brain iron? A post mortem validation
study. Neuroimage. 62(3), 1593–1599 (2012).
37. Zhou, D., Liu, T., Spincemaille, P. & Wang, Y. Background field removal by solving the Laplacian boundary value problem. NMR
Biomed. 27(3), 312–319 (2014).
38. Liu, T., Spincemaille, P., De Rochefort, L., Kressler, B. & Wang, Y. Calculation of susceptibility through multiple orientation sampling
(COSMOS): A method for conditioning the inverse problem from measured magnetic field map to susceptibility source image in
MRI. Magn. Reson. Med. 61(1), 196–204 (2009).
39. Austin, C. et al. Factors affecting internal standard selection for quantitative elemental bio-imaging of soft tissues by LA-ICP-MS.
J. Anal. At. Spectrom. 26(7), 1494–1501 (2011).
40. Hughes, A. J., Daniel, S. E., Kilford, L. & Lees, A. J. Accuracy of clinical diagnosis of idiopathic Parkinson’s disease: A clinico-
pathological study of 100 cases. J. Neurol. Neurosurg. Psychiatry 55(3), 181–184 (1992).
41. Höglinger, G. U. et al. Clinical diagnosis of progressive supranuclear palsy: The movement disorder society criteria. Mov. Disord.
32(6), 853–864 (2017).
Acknowledgements
We are thankful that patients with progressive supranuclear palsy and Parkinson’s disease from the Pusan
National University Yangsan Hospital and healthy control subjects participated in this study. We thank the
patients and families for donating their brains to the Pusan National University Anatomical Donation Program
and the Pusan National University Hospital Brain Bank. We thank UNIST-Olympus Biomedical Imaging Center
(UOBC) for microscopy imaging and the Research Institute of Industrial Science and Technology (RIST) for LA-
ICP-MS imaging. This work was a collaborative study by the Ulsan National Institute of Science and Technology
and Pusan National University Yangsan Hospital.
Author contributions
H.L., J.H.L., and H.J.C. designed the study. H.L., E.J.K., and G.Y.H. acquired the experimental data. H.L., M.J.L.,
E.J.K., G.Y.H., J.H.L., and H.J.C. analyzed the data. H.L., J.H.L., and H.J.C. drafted the main manuscript. All
authors reviewed the manuscript.
Funding
This work was partially supported by grants from the National Research Foundation of Korea from the Korean
government (Nos. 2018R1A6A1A03025810, 2018M3C7A1056887). This research was supported by the ‘2020
Joint Research Project of Institutes of Science and Technology’. This research was also supported by a fund
(2018-ER6204-00, 2019-ER6202-00, 2020-ER6201-00) from Research of Korea Centers for Disease Control
and Prevention.
Competing interests
The authors declare no competing interests.
Additional information
Supplementary Information The online version contains supplementary material available at https://doi.
org/10.1038/s41598-021-82469-w.
Correspondence and requests for materials should be addressed to J.-H.L. or H.C.
Reprints and permissions information is available at www.nature.com/reprints.
Publisher’s note Springer Nature remains neutral with regard to jurisdictional claims in published maps and
institutional affiliations.
Open Access This article is licensed under a Creative Commons Attribution 4.0 International
License, which permits use, sharing, adaptation, distribution and reproduction in any medium or
format, as long as you give appropriate credit to the original author(s) and the source, provide a link to the
Creative Commons licence, and indicate if changes were made. The images or other third party material in this
article are included in the article’s Creative Commons licence, unless indicated otherwise in a credit line to the
material. If material is not included in the article’s Creative Commons licence and your intended use is not
permitted by statutory regulation or exceeds the permitted use, you will need to obtain permission directly from
the copyright holder. To view a copy of this licence, visit http://creativecommons.org/licenses/by/4.0/.
© The Author(s) 2021
Scientific Reports | (2021) 11:2950 | https://doi.org/10.1038/s41598-021-82469-w 9
Vol.:(0123456789)You can also read