Evaluation of DCE-MRI postprocessing techniques to assess metastatic bone marrow in patients with prostate cancer
←
→
Page content transcription
If your browser does not render page correctly, please read the page content below
Clinical Imaging 36 (2012) 308 – 315

 Evaluation of DCE-MRI postprocessing techniques to assess metastatic
              bone marrow in patients with prostate cancer
                      Nicolas Michoux⁎, Paolo Simoni, Bertrand Tombal, Frank Peeters,
                                  Jean-Pascal Machiels, Frédéric Lecouvet
    Institut de Recherche Expérimentale et Clinique (IREC), Université Catholique de Louvain, Cliniques Universitaires Saint-Luc, Brussels, Belgium
                                                    Received 9 June 2011; accepted 7 October 2011

Abstract

   Dynamic contrast-enhanced magnetic resonance imaging was performed in control patients with normal bone marrow and patients with
untreated bone metastases of prostate cancer (PCa). Perfusion data were assessed using region of interest-based and pixel-wise current
standard postprocessing techniques (signal intensity pattern, increase in signal intensity, upslope, time to peak, extended Kety model, k-
means clustering). Bone marrow perfusion is significantly increased in bone metastases of PCa compared to normal bone marrow. Pixel-wise
kinetic modeling should be recommended to assess tumoral processes affecting bone marrow microcirculation.
© 2012 Elsevier Inc. All rights reserved.

Keywords: Dynamic contrast-enhanced MRI (DCE-MRI); Prostate cancer (PCa); Bone metastases; Imaging biomarkers; Pharmacokinetics

1. Introduction                                                                microstructure [5,10], and the measurement of an arterial
                                                                               input function. The computationally intensive postproces-
   Current imaging screening for bone metastases of prostate                   sing to get quantitative estimates of the bone marrow
cancer (PCa) including technetium-99m bone scan, targeted                      microcirculation (including a precontrast mapping of T1 or a
X-rays, and magnetic resonance imaging (MRI) are not                           calibration procedure, the modeling of the contrast agent
effective in revealing early tumor changes induced by                          kinetics, and the implementation of a robust data fitting
anticancer drugs [1–3]. Dynamic contrast-enhanced MRI                          procedure) is also involved. These requirements often lead to
(DCE-MRI) is now recognized as a potential early predictor                     choosing the simplest analysis model over more realistic
of response to drug therapy and radiotherapy [4–7]. The                        tracer kinetic models. However, as qualitative or semiquan-
usefulness of the technique in various benign and malignant                    titative models of bone marrow perfusion have never been
musculoskeletal lesions [8] and its prognostic potential in                    formally validated [5], more sophisticated models should not
multiple myeloma [9] have been investigated. Despite these                     be excluded from the process of model selection.
results, quantitative DCE-MRI has never reached routine                            The aim of the study is to estimate the efficiency of the
clinical applications in bone imaging. The main reasons for                    current standard DCE-MRI postprocessing techniques to
this might be the need for intravenous contrast administra-                    assess bone marrow microcirculation. Qualitative analysis of
tion, the suboptimal effectiveness of low-molecular-weight                     signal intensity vs. time (SI) curves, region of interest (ROI)-
contrast agents for a precise assessment of the marrow                         based semiquantitative analysis, ROI-based kinetic modeling,
                                                                               pixel-based kinetic modeling, and kinetic parameters-based
   ⁎ Corresponding author. Université Catholique de Louvain, Hôpital
                                                                               clustering were assessed on the basis of two populations:
Saint-Luc, Radiology–Imaging Unit, Avenue Hippocrate 10, 1200 Brussels,
                                                                               patients with untreated bone metastases of PCa and control
Belgium. Tel.: +32 2 7642551; fax: +32 2 7705574.                              patients with normal bone marrow. Reference values of bone
   E-mail address: nicolas.michoux@uclouvain.be (N. Michoux).                  marrow perfusion, blood volume, and interstitial volume for

0899-7071/$ – see front matter © 2012 Elsevier Inc. All rights reserved.
doi:10.1016/j.clinimag.2011.10.002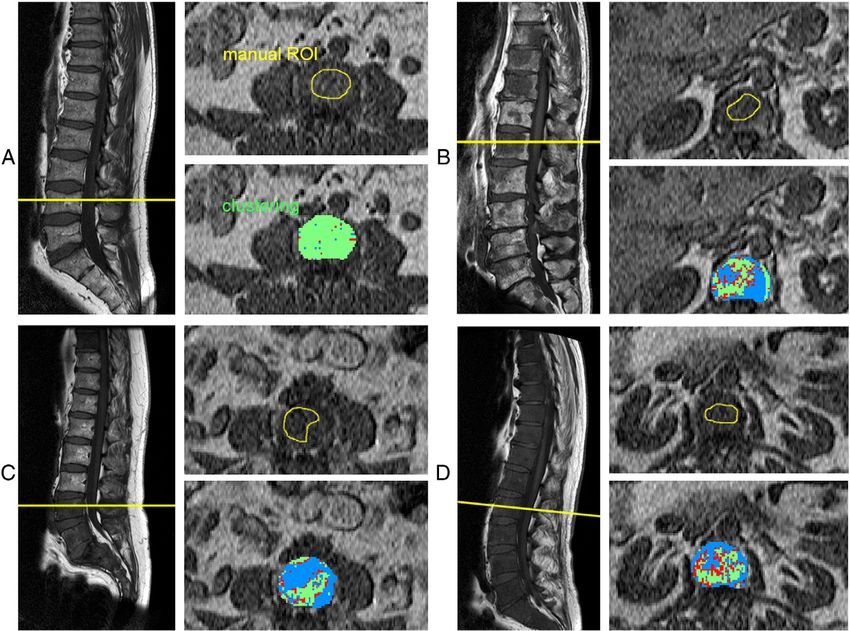
N. Michoux et al. / Clinical Imaging 36 (2012) 308–315                                         309

both populations were also provided. These values might                             the above-mentioned criteria. The study was approved by the
represent baseline information for further studies focused on                       local ethical committee, and written informed consent was
perfusion changes in bone metastases of PCa during treatment.                       obtained from patients.

2. Materials and methods                                                            2.2. Magnetic resonance standard imaging

2.1. Patients                                                                          All MRI examinations were performed on a 1.5-T scanner
                                                                                    (Gyroscan NT Intera 1.5 T; Philips Medical Systems, Best,
   Ten patients with bone metastases of PCa and 10 control                          the Netherlands) with the body coil. For each patient, a
patients without history of cancer were included in the study                       preliminary standard magnetic resonance examination of the
and underwent an MRI examination. Patients with bone                                spine was performed using T1 and proton density with fat
metastases of PCa had newly diagnosed PCa (mean age, 68                             saturation (PDFS) sequences (sagittal plane). Transverse
±9 years; range 52–80 years) referred by the oncology and/or                        sections were then programed on bone metastases identified
urology department to rule out bone metastases of the spine.                        on their preliminary images to delineate these lesions.
In all 10 patients, the MRI examination including DCE-MRI                           Control patients referred for back pain were also examined
was performed before any drug or radiation therapy was                              with transverse T1 and T2 images obtained on the anatomic
started. Because of the lack of histological proof, a 6-month                       levels relevant to the clinical question. Bone metastases were
follow-up by standard MRI survey for bone marrow was                                defined as an area of low signal intensity on T1-weighted
used as a gold standard for the confirmation of the malignant                       images compared to normal muscle and/or disk and
nature of the lesions considered as metastases and the                              intermediate to high signal intensity on the PDFS images.
stability of bone marrow considered as normal. In this 6-
month interval, patients with PCa received hormonal                                 2.3. DCE-MRI examination
therapy, and bone metastases were proved by any change
of size and/or signal of the lesion over this time period (see                          Bone marrow perfusion was assessed with a spoiled two-
Table 1). Control patients without history of PCa underwent                         dimensional turbo-Fast Low Angle SHot sequence. A nonslice-
MRI of the lumbar spine with contrast injection. All patients                       selective 90° preparation pulse was incorporated. Scan
were referred for a low-back-pain MRI workup by an                                  parameters were as follows: slice thickness L=10 mm, Field
academic orthopedist. Patients with known disease that                              Of View=262×400 mm, in-plane voxel size=1.02×1.56 mm
could potentially alter bone marrow changes were discarded                          after reconstruction, flip angle=15°, single shot, echo time=1.3
from the analysis. These were patients with history of cancer                       ms, repetition time=5.4 ms, a shot duration of 516 ms, and 200
even without evidence/history of bone metastases, with                              dynamics for a total acquisition time of 1 min 47 s. Patients
previous surgery of the lumbar spine, with chronic anemia                           received 8 ml of Gd-DTPA (Magnevist; Bayer Schering
(defined as hemoglobin level b12 g ml −1), or with chronic                          Pharma AG, Berlin, Germany) followed by 20 ml saline flush
inflammatory disease (defined as reactive C-protein N1.5 mg                         injected at a rate of 3 ml/s with an automated injector.
dL −1 and/or white blood cells N10,000 ml −1). All laboratory                           A single transverse slice that included bone metastases
tests were performed during the week before the MRI                                 or normal bone marrow and the aorta was continuously scanned
examination. The final control population consisted of eight                        using the fast-gradient echo sequence after contrast agent
patients, three men and five women (mean age, 56±14 years;                          injection. This single transverse slice was manually positioned
range 39–75 years) with normal bone marrow according to                             passing through the largest metastasis detected at the level of

Table 1
Patients with PCa bone metastases
Patients              Age              Gleason            PSA plasmatic            Total no. of lesions      Location of the        Size of the largest
                      (years)          score              level (ng/ml)                                      largest lesion a       lesion a (mm)
1                     80               8                    b0.1                   N10                        L2                    43
2                     67               8                  1470                     N10                        L4                    45
3                     55               9                     3                     N10                        L4                    45
4                     74               6                    11                     Diffuse infiltration      L2 b                   45
5                     70               6                  1069                     N10                        D7                    16
6                     52               7                  1369                     N10                        L4                    26
7                     74               7                   115                     N10                        L4                    23
8                     69               9                   202                     9                          L3                    39
9                     65               7                     3                     N10                        L5                    28
10                    56               7                   144                     N10                        L1                    16
PSA, Prostate-Specific Antigen.
     a
         Sample lesion for DCE-MRI.
     b
         Vertebral body considered as sample lesion: diffuse infiltration of bone marrow.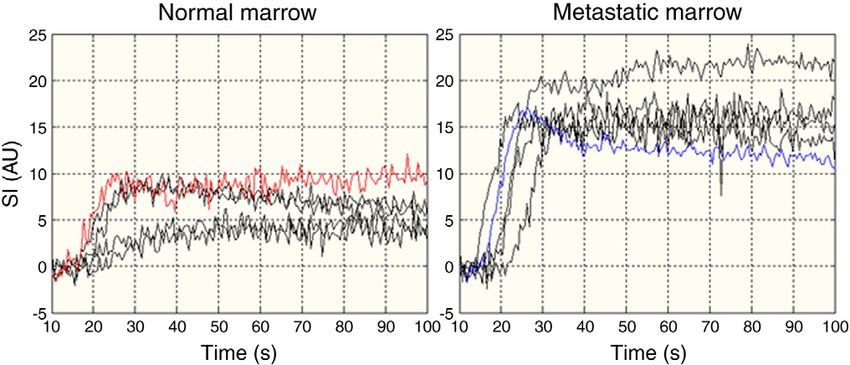
310                                         N. Michoux et al. / Clinical Imaging 36 (2012) 308–315

the spine on the basis of sagittal slices. In control patients, the          The extended Kety model with an individual arterial input
single slice was positioned at level of the upper third of the L3         function was used [14,15]. This model assumes a bidirec-
vertebral body to avoid the basivertebral veins and the cortex of         tional exchange between two compartments, the intravascu-
vertebral plates. The upper third of L3 vertebral body was                lar space (IVS) and the extravascular extracellular space
chosen because mechanic degenerative changes of bone                      (EES), as well as a contribution of the tracer in IVS. It can be
marrow are by far less common than in L4 and L5.                          written as:
                                                                                                                           K trans
2.4. Image postprocessing                                                 Ctissue ðt Þ = q:K trans :Cplasma ðt Þ  e − q      ve t   + vp :Cplasma ðt Þ ð3Þ

   The software Image J (National Institutes of Health,                   where ρ (ρ=1 g ml −1) is the tissue density, Cplasma (g ml −1) is
http://rsbweb.nih.gov/ij/) was used for the segmentation of               the concentration of contrast agent in IVS, Ctissue (g ml −1) is
the ROIs. An experienced musculoskeletal radiologist                      the concentration of contrast agent in the tissue, K trans=E·F
manually drew one ROI covering the aorta and another                      (ml s −1 g −1) is the product of the extraction fraction and
ROI in the bone marrow. For bone metastasis, a careful                    the tissue plasma flow, ve (%) is the EES accessible to the
delineation of the lesion on the basis of sagittal and axial              contrast agent, vp (%) is the fractional plasma volume of
images obtained before contrast agent injection was                       the contrast agent, and ⊗ denotes the convolution product.
performed. For normal marrow, the entire vertebral body                   The model contains three free parameters to fit, K trans , ve, and
(except for the cortices) on the axial image was included in              vp. The hematocrit Hct was fixed to 0.45 for all patients, and
the ROI. The program reported the ROI for each image of the               the arterial concentration of the tracer in whole blood was
time series and extracted the SI curves.                                  converted into the corresponding plasma quantity according
                                                                          to the following formula Cplasma(t)=Cblood(t)/(1−Hct).
2.5. Semiquantitative parameters                                              For each patient, the kinetic model was first fitted to the
                                                                          average R1 curve from the ROI. Then, it was fitted on a
   Bone marrow perfusion was first assessed using three                   pixel-by-pixel basis in the entire bone marrow of the vertebra
simple geometrical measurements of the signal intensity                   to generate three parametric maps based on K trans, ve, and vp.
enhancement [11]. The percentage increase (PI) in signal                  To obtain the coefficient K trans (in ml min −1 100 g −1),
intensity was calculated as follows:                                      the coefficient expressed (in ml s −1 g −1) was multiplied
     h                       i                                          by 60 s min −1 and by 100.
PI = SImax − SIP pre 4100 = SIP pre                  ð1Þ                      A statistical partitioning of the pixels in bone marrow
                                                                          based on the kinetic parameters was computed. Then, bone
where SIΣpre is the mean signal intensity measurement in the              metastases margins manually drawn by the radiologist on
ROI before contrast agent arrival and SImax is the maximum                the basis of T1-weighted imaging on precontrast T1 axial
signal intensity measurement in the ROI during the first pass             images were compared to the map generated with the
of the contrast agent. The upslope was calculated by linear               clustering method.
regression of the signal intensity on the interval [SIpre;
SImax], where SIpre is the signal intensity measurement                   2.7. Statistical analysis
measured just before the contrast agent uptake. The time
Tmax corresponding to the peak SImax was also measured.                      Optimization of the fits was achieved with a weighted
                                                                          nonlinear least squares procedure based on the Levenberg–
2.6. Kinetic parameters                                                   Marquardt method combined with a three-dimensional grid
                                                                          of starting parameter values to find the solution correspond-
   According to the procedure described in Ref. [12], SI                  ing to the true global minimum of the error function [16].
curves were converted into longitudinal relaxation rate R1                   The k-means clustering [17] approach, used to partition
vs. time curves. A linear relationship was assumed between                the pixels in the bone marrow area, was parameterized with a
R1 and contrast agent concentration according to the                      number of final clusters equal to 2, a preliminary clustering
following equation:                                                       phase on a random 10% subsample of the pixels and with the
                                                                          L1 distance to calculate the distance between centroid
R1 = R1post − R1pre = r1 C                                     ð2Þ        clusters. Pixels belonging to one cluster and showing a
                                                                          distance measure to another cluster less than 0.5 were
where R1post is the postcontrast longitudinal relaxation rate,            considered as poorly classified.
R1pre the precontrast longitudinal relaxation rate, r1 the                   Semiquantitative and kinetic parameters were expressed
longitudinal relaxivity of the contrast agent, and C is                   as mean±S.D. Patients' age and parameters were compared
concentration. In this equation, it is assumed that the                   between both groups with the Wilcoxon rank sum test. A
relaxivity of the contrast agent is the same in blood and                 P value of .05 was considered statistically significant. The
tumors and that the exchanges of water between intravas-                  performance of the various parameters in discriminating the
cular, extravascular, and intracellular spaces are fast [13].             normal bone marrow vs. the metastatic bone marrow was
N. Michoux et al. / Clinical Imaging 36 (2012) 308–315 311
studied by using nonparametric receiver operating charac- Table 2
teristic (ROC) curves. Cutoff values for PI, upslope, K trans, Mean values (±S.D.) of the semiquantitative and kinetic parameters
and ve as well as the corresponding sensitivity and specificity Patients Upslope a PI a Tmax Ktransa ve a vp a
were computed with exact 95% confidence intervals based PCa 1.59±0.57 72±19 28±5 57.7±22.8 12.7±4.17 1.68±1.25
on the F distribution [18]. As the area under the ROC curve Control 0.47±0.27 19±10 33±8 18.6±11.9 4.78±1.59 1.00±0.01
(AUC) is a summary measure of the parameter performance, Upslope in arbitrary unit·s−1, PI in %, Tmax in s, Ktrans and kep in ml min−1
we performed an unpaired statistical comparison of the 100 g−1, and ve, and vp in %.
a
AUCs. All calculations were done with Matlab (v. 6.5, rel. Significant differences between metastatic and normal bone marrow
13; MathWorks, Natick, MA, USA). (Wilcoxon rank sum test, Pb.05).
3. Results (AUC=0.96±0.05). The most discriminating cutoff values
were PIb38.02% (sensitivity, 100%; specificity, 100%),
Patients age did not differ between the controls and the v e b7.41 % (sensitivity, 100%; specificity 90%),
PCa patients (P=.39). Typical SI curves are presented in upslopeb0.92 AU·s −1 (sensitivity, 100%; specificity, 90%),
Fig. 1. In the control patients, an almost flat profile is and K trans b35.73 ml min −1 100 g −1 (sensitivity, 100%;
observed. In bone metastases, the patients exhibited specificity, 90%) for the normal bone marrow. A pairwise
different profiles with as common feature, a fast contrast comparison of AUC of ROC curves did not yield any
uptake and either a plateau or a rapid washout, but with an statistically significant differences. As a result, it was not
intensity enhancement always much higher to that observed possible to distinguish the above parameters according to
in normal bone marrow. SI curves measured from two ROIs their performance.
placed in normal and a tumoral area of the same patient Parametric maps are illustrated in Fig. 2. In normal bone
with bone metastases revealed similar differences, with a marrow, a homogeneous distribution of low K trans, ve, and
lower and slower intensity enhancement in the normal- vp values was typically observed. In bone metastases,
appearing area of the bone marrow. parametric maps vary among patients. Distributions of
Measurements of the semiquantitative and kinetic param- K trans , ve, and vp values are heterogeneous, revealing several
eters are summarized in Table 2. Bone metastases showed a functionally different areas in the bone marrow.
significantly higher upslope compared to normal bone Clustering based on K trans and ve provided maps with the
marrow (P=.0002) as well as a significantly higher PI lower number of pixels poorly classified compared to other
(P=.00005). No statistically significant difference was found combinations of two or three parameters including vp.
in the time-to-peak Tmax between both groups (P=.26). Bone Examples of clustering maps are presented in Fig. 3. In the
metastases showed a significantly higher value of K trans, ve, control patients, the partitioning typically results in a single
and vp compared to normal bone marrow (P=.0015, large area that is consistent with a manual delineation
P=.00004, and P=.0048, respectively). covering the entire bone marrow of the vertebra in the axial
The best estimated parameters used to predict the bone plane. In bone metastases, an overall good agreement was
marrow status were as follows: PI (AUC=1.00±0.00), ve observed between the area of the lesion delineated manually
(AUC=0.99±0.03), upslope (AUC=0.97±0.05), and K trans and the area identified by the partitioning as an area where
Fig. 1. Example of observed SI curves. The mean signal intensity before the contrast agent injection has been recentered on zero for a better comparison. Normal
bone marrow: the two lower black curves correspond to male patients, while the two upper black curves correspond to female patients. The red curve corresponds
to the area of normal bone marrow next to the lesion in a metastatic patient (Fig. 2C, nonenhancing area). Untreated bone metastases: the four black curves
demonstrate a higher and faster enhancement. The blue curve corresponds to the tumoral area in the second metastatic patient (Fig. 2C, enhancing area).312 N. Michoux et al. / Clinical Imaging 36 (2012) 308–315
Fig. 2. Parametric maps of bone marrow perfusion. The brighter the color code, the higher the value of the functional parameter. (A) A control patient is shown.
Maps do not show any local difference. Dark areas representing hypoperfused areas with both small vascular and interstitial volumes are small, sparse,
colocalized from one map to the other, and witnesses for an overall low perfusion of the marrow. (B–D) Patients with untreated bone metastases are shown. High
values of the transfer constant Ktrans, interstitial volume ve, and plasma volume vp are observed. Maps are heterogeneous. (B) One observes that nonenhancing
areas cannot be colocalized from one map to the other, which witnesses for the complex characteristics of the metastatic marrow microstructure. (C) Two
functionally different areas are present: the nonenhancing area with low perfusion/permeability and moderate interstitial and vascular volumes appearing as
normal bone marrow, and the enhancing area with high perfusion/permeability and moderate interstitial and vascular volumes appearing as metastatic marrow.
K trans values are higher. Substantial differences between allows for the segmentation of the lesion based on its
both methods of delineation can also be observed. measured functional characteristics.
4. Discussion 4.1. Qualitative, semiquantitative, and
quantitative methodology
The main results of the study are as follows. ROI-based
semiquantitative and quantitative methodologies provide Qualitative analysis showed that SI curves in patients with
clear cutoff values for the perfusion parameters, from bone metastasis are mainly characterized by a marked
which bone metastases of PCa can be distinguished from intensity enhancement. However, various patterns for the
normal bone marrow. Both methodologies show that the washout phase can be observed and are difficult to classify.
perfusion in normal bone marrow is lower compared to Analysis of SI patterns has been applied with success to the
that in bone metastases of PCa. Parametric maps based on detection and evaluation of breast cancer [19]. Chen and
K trans, ve, and vp allow for the characterization of the Shih [11] proposed a classification, more subjective than
heterogeneity of bone metastasis. Clustering analysis strict, of SI patterns in patients with compression fracture orN. Michoux et al. / Clinical Imaging 36 (2012) 308–315 313 Fig. 3. Sagittal T1-weighted images showing the transverse plan (yellow line) selected for the perfusion sequence, manual ROIs, and clustering maps superimposed on the first image of the perfusion sequence before contrast agent injection. The statistical partitioning of the pixels is estimated from the functional parameters Ktrans and ve. The pixel group with the lower mean Ktrans value is coded in blue, while the pixels group with the higher mean Ktrans value is coded in green. Pixels in red correspond to a poor classification result. Same patients as in Fig. 2 are presented. (A) A control patient is shown. The clustering results in one type of tissue only. (B–D) Patients with untreated bone metastases are shown. The clustering reveals two distinct areas, especially in patients B and C, suggesting two distinct types of tissue in the bone marrow. Pixels with a poor classification result are mainly localized on the border of both areas. metastatic vertebral lesions. Our results suggest that the the literature are available for comparison. Hillengass et al. analysis of SI patterns remains not very specific and is [9], using the model of Brix et al. [24], reported that high mainly useful for detecting an abrupt change in the bone values of parameters amplitude A (similar to our parameter marrow perfusion. PI) and exchange rate kep indicated diffuse or focal Values reported in the literature for semiquantitative infiltration of the bone marrow. Our study yielded kep parameters vary greatly [11,20,21]. In our study, PI ranged values 375±173 ml min −1 100 g −1 in the control patients between 10% and 29% for the control patients and between and 478±214 ml min −1 100 g −1 in patients with bone 53% and 91% for patients with PCa. This result is consistent metastasis, similarly to the findings of Hillengass et al. with Baur et al. [22], who suggested that a PI less 40% is (where kep ranged from 0 to 798 ml min −1 100 g −1). We observed in normal bone marrow of adults older than 30 did not observe any significant difference in kep values years. Likewise, our values for the upslope ranged between between the controls and the metastatic patients, but the role 0.20 and 0.74 for the control patients and between 1.02 and of a particular kinetic parameter as diagnostic variable may 2.16 for patients with PCa, which is consistent with the depend on the studied pathology. results of Montazel et al. [20] in patients with newly diagnosed hematologic malignancies. In another study [23], 4.2. Comparison of the methodologies the same team showed that PI and upslope increased significantly with the degree of bone marrow involvement. Similar performance, as well as substantial correlations Parameters K trans, ve, and vp were significantly lower in between the parameters (r≥0.7, data not shown), was found normal bone marrow than in bone metastases. Few data in between semiquantitative and quantitative methodology.
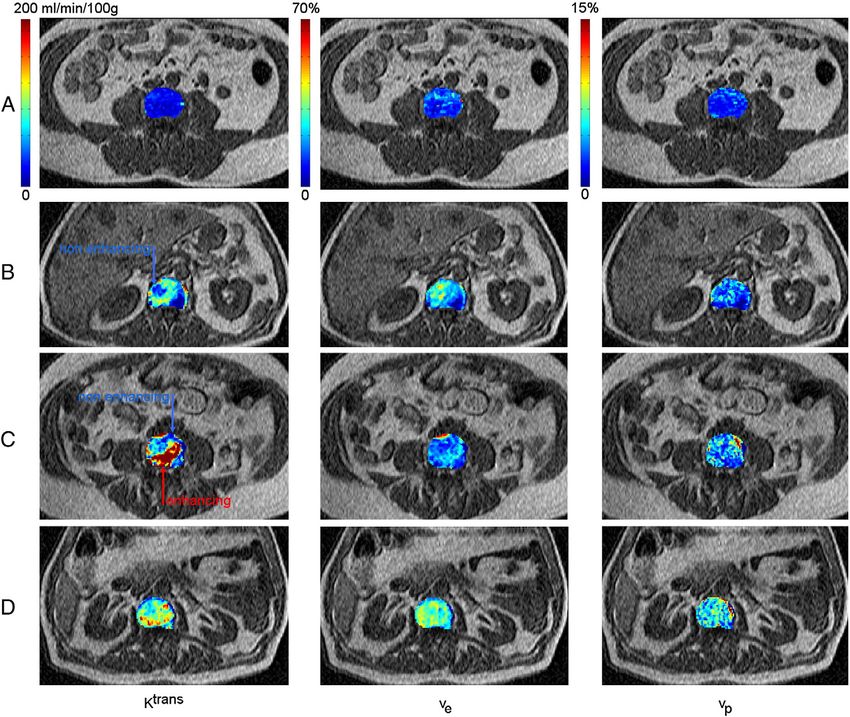
314                                        N. Michoux et al. / Clinical Imaging 36 (2012) 308–315

    Semiquantitative parameters depend on the definition of              patients with bone metastasis, the marrow of the involved
the interval [SIpre; SImax]. Interval limits are sensitive to            vertebra is partitioned into two distinct regions: the lesion
signal-to-noise ratio and may result from a subjective                   (identified a posteriori by comparison with a manual
choice when the contrast agent uptake and washout are both               delineation), where K trans is high, and the normal-appearing
slow, which is the case in normal bone marrow. Moreover,                 perilesional tissues, where K trans is low. Interestingly, the
semiquantitative parameters are well known to be depen-                  clustering maps result in a more detailed segmentation of the
dent on MRI protocols (magnetic field, coils, and sequence               lesion compared to the margins of the bone metastases drawn
parameters) and baseline T1 relaxation time of the tissue                on the basis of T1-weighted imaging. We can speculate that
before contrast injection. Recently, a series of curves                  DCE-MRI may reveal areas of subtle bone marrow
features (defined from areas measurement under SI curves                 infiltration at margins of the lesion in territories appearing
normalized to account for both baseline signal intensity and             normal on standard T1-weighted sequences as previously
signal intensity 3 min after contrast agent injection) have              demonstrated in myeloma [22]. Similar statistical approaches
been presented as insensitive to T1 value and protocol                   of DCE-MRI data already proved to be useful in detecting
parameters [25]. However, first assessment in patients with              and delineating the tumor (which, by extension, allows for
osteosarcoma showed only a weak correlation with the                     the quantitative measurement of the extension or the
transfer constant K trans.                                               shrinkage of the tumor between two examinations) and
    Kinetic modeling requires an accurate determination of the           grading its aggressiveness [34].
arterial input function (AIF) [26] and baseline T1 value.
Kinetic parameters have a clear physiological meaning,                   4.4. Limitations
though simplified regarding actual transport mechanisms
[27,28]. The extended Kety model has been reported as a                      The population we enrolled in this study was limited to 10
compromise between the Kety model, neglecting the vascular               patients because we focused our analysis on newly
contribution of the contrast agent, and the more physiological           diagnosed untreated bone metastases of PCa to provide
(and more complex) St Lawrence and Lee model, giving more                baseline values of perfusion, without biases induced by
accurate results but being also less precise because of the              previous drug therapy. The control population included five
interdependency of the parameters and their sensitivity to               women. Several previous articles reported a significant
initial values [29]. A recent study [30] suggested that kinetic          higher perfusion of bone marrow in younger patients,
models should explicitly incorporate a fraction of fat (as an            especially in women in fertile age [22]. This may, however,
additional parameter to be fitted or assume not fat because of           be considered as particularly suitable to determine a series of
using a perfect fact saturation radio frequency pulse) to get            cutoff values of perfusion between normal bone marrow and
unbiased measurements of the bone marrow perfusion.                      bone metastases of PCa.
                                                                             For each patient, we only studied the larger metastasis in
4.3. Pixel-wise quantitative methodology                                 order to obtain the largest ROI and the highest signal-to-
                                                                         noise ratio to fit the curve of enhancement. We deliberately
    Heterogeneity of tumoral perfusion may bias the                      avoided to simultaneously image more than one metastases,
interpretation of ROI-based parameters [31]. Our results                 which would have been possible by orientating the single
confirm that fact, showing that the spatial distribution of              slice on sagittal plane, parallel to the spine. An axial plane
K trans, ve, and vp values is heterogeneous in bone metastases,          focuses the analysis to single-bone metastases but also
while it is not in normal bone marrow. Therefore, the mean               provides a measurement of the AIF that is less prone to flow
perfusion parameters are significant in normal bone marrow               and pulsation artifacts as well as to partial volume effects. As
only. Beside, pixel-based methodologies may allow for the                bone metastases represent a heterogeneous population of
monitoring of the effects of vascular-targeting agents on each           malignant lesions, we are aware that the choice of a lesion as
perfusion parameter in the area of the lesion, in its immediate          a sample to monitor the response to drug therapy would be
vicinity, and in more distant locations [32]. To test this               purely arbitrary in clinical settings.
hypothesis, we performed a short study on 10 PCa patients                    In conclusion, pixel-wise kinetic modeling should
with known lumbar metastases scheduled to receive                        constitute the reference methodology to assess bone marrow
hormonal therapy or Taxotere (Sanofi-Aventis) therapy.                   microcirculation. The information provided by kinetic
These patients were imaged within 1 week before and 7 and                parameters regarding the tumoral processes affecting the
90 days after initial treatment. Our results showed that K trans,        bone marrow microcirculation justifies the additional cost in
ve, and vp maps were sensitive to treatment changes and                  data postprocessing. Especially, the measurement of an
allowed for the monitoring of the complex changes occurring              arterial input function is no more a limiting factor since
in the perfusion in response to therapy [33].                            alternative methods of AIF generation are currently
    Clustering based on the kinetic parameters allows for the            investigated [35] and may offer the possibility of acquiring
identification of regions with similar functional characteris-           images with a higher spatial resolution and/or signal-to-noise
tics within the bone marrow. Our results show that in the                ratio, as well as performing accurate kinetic modeling of
control patients, the bone marrow cannot be partitioned. In              DCE-MRI data in the whole spine. Future investigations
N. Michoux et al. / Clinical Imaging 36 (2012) 308–315 315
should focus on the relevance of K trans, ve, and vp maps as [17] MacQueen JB. Some methods for classification and analysis of
imaging biomarkers in the treatment monitoring and multivariate observations. Proc. 5th Berkeley Symposium on Mathe-
matical Statistics and Probability, Berkeley, University of California
follow-up of bone metastases of PCa treated by anti- Press, 1, 1967. p. 281–97.
angiogenetic/cytotoxic drugs. [18] DeLong ER, DeLong DM, Clarke-Pearson DL. Comparing the areas
under two or more correlated receiver operating characteristic curves: a
References non parametric approach. Biometrics 1988;44:837–45.
[19] Kuhl C. The current status of breast MR imaging. Part I. Choice of
[1] Chi KN, Bjartell A, Dearnaley D, et al. Castration-resistant prostate technique, image interpretation, diagnostic accuracy, and transfer to
cancer: from new pathophysiology to new treatment targets. Eur Urol clinical practice. Radiology 2007;244:356–78.
2009;56:594–605. [20] Montazel J-L, Divine M, Lepage E, Kobeiter H, Breil S, Rahmouni A.
[2] Biswal S, Resnick DL, Hoffman JM, Gambhir SS. Molecular imaging: Normal spinal bone marrow in adults: dynamic gadolinium-enhanced
integration of molecular imaging into the musculoskeletal imaging MR imaging. Radiology 2003;229:703–9.
practice. Radiology 2007;244:651–71. [21] Griffith JF, Yeung DKW, Antonio GE, et al. Vertebral bone mineral
[3] Bäuerle T, Bartlinga S, Berger M, et al. Imaging anti-angiogenic density, marrow perfusion, and fat content in healthy men and men
treatment response with DCE-VCT, DCE-MRI and DWI in an animal with osteoporosis: dynamic contrast-enhanced MR imaging and MR
model of breast cancer bone metastasis. Eur J Radiology 2010;73: spectroscopy. Radiology 2005;236:945–51.
280–7. [22] Baur A, Stäbler A, Bartl R, Lamerz R, Scheidler J, Reiser M. MRI
[4] Taylor JS, Reddick WE. Evolution from empirical dynamic contrast- gadolinium enhancement of bone marrow: age-related changes in
enhanced magnetic resonance imaging to pharmacokinetic MRI. Adv normals and in diffuse neoplastic infiltration. Skeletal Radiol 1997;26:
Drug Deliv Rev 2000;41:91–110. 414–8.
[5] Daldrup-Link HE, Tobias Henning T, Link TM. MR imaging of [23] Rahmouni A, Montazel J-L, Divine M, et al. Bone marrow with diffuse
therapy-induced changes of bone marrow. Eur Radiol 2007;17:743–61. tumor infiltration in patients with lymphoproliferative diseases:
[6] Leach MO, Brindle KM, Evelhoch JL, et al. The assessment of dynamic gadolinium-enhanced MR imaging. Radiology 2003;229:
antiangiogenic and antivascular therapies in early-stage clinical trials 710–7.
using magnetic resonance imaging: issues and recommendations. Br J [24] Brix G, Semmler W, Port R, et al. Pharmacokinetic parameters in CNS
Cancer 2005;92:1599–610. Gd DTPA enhanced MRI. J Comput Assist Tomogr 1991;15:621–727.
[7] O'Connor JP, Jackson A, Parker GJ, Jayson GC. DCE-MRI [25] Guo J-Y, Reddick WE. DCE-MRI pixel-by-pixel quantitative curve
biomarkers in the clinical evaluation of antiangiogenic and vascular pattern analysis and its application to osteosarcoma. J Magn Reson
disrupting agents. Br J Cancer 2007;96:189–95. Imaging 2009;30:177–84.
[8] Hawighorst H, Libicher M, Knopp MV, Moehler T, Kauffmann GW, [26] Yang C, Karczmar GS, Medved M, Oto A, Zamora M, Stadler WM.
van Kaick G. Evaluation of angiogenesis and perfusion of bone Reproducibility assessment of a multiple reference tissue method for
marrow lesions: role of semiquantitative and quantitative dynamic quantitative dynamic contrast enhanced-MRI analysis. Magn Reson
MRI. J Magn Reson Imaging 1999;10:286–94. Med 2009;61:851–9.
[9] Hillengass J, Wasser K, Delorme S, et al. Lumbar bone marrow [27] Jain RK. Transport of molecules in the tumor interstitium: a review.
microcirculation measurements from dynamic contrast-enhanced Cancer Res 1987;47:3039–51.
magnetic resonance imaging is a predictor of event-free survival in [28] Condon MS. The role of the stromal microenvironment in prostate
progressive multiple myeloma. Clin Cancer Res 2007;13:475–81. cancer. Seminars in Cancer Biology 2005;15:132–7.
[10] Dafni H, Kim S-J, Bankson JA, Sankaranarayanapillai M, Ronen SM. [29] Buckley DL, Roberts C, Parker GJ, Logue JP, Hutchinson CE. Prostate
Macromolecular dynamic contrast-enhanced (DCE)-MRI detects cancer: evaluation of vascular characteristics with dynamic contrast-
reduced vascular permeability in a prostate cancer bone metastasis enhanced T1-weighted MR imaging-initial experience. Radiology
model following anti-platelet-derived growth factor receptor (PDGFR) 2004;233:709–15.
therapy, indicating a drop in vascular endothelial growth factor [30] Biffar A, Sourbron S, Schmidt G, et al. Measurement of perfusion and
receptor (VEGFR) activation. Magn Reson Med 2008;60:822–33. permeability from dynamic contrast-enhanced MRI in normal and
[11] Chen W-T, Shih TT. Correlation between the bone marrow blood pathological vertebral bone marrow. Magn Reson Med 2010;64:
perfusion and lipid water content on the lumbar spine in female 115–24.
subjects. J Magn Reson Imaging 2006;24:176–81. [31] Peck KK, Slater G, Wang X, et al. Applications of dynamic contrast-
[12] Materne R, Smith AM, Peeters F, et al. Assessment of hepatic enhanced MRI in assessment of spinal bone marrow. Proceedings of
perfusion parameters with dynamic MRI. Magn Reson Med 2002;47: the 17th Annual Meeting of ISMRM, Honolulu, Hawaii, USA, 2009.
135–42. p. 4224. [abstract].
[13] Landis CS, Li X, Telang FW, et al. Determination of the MRI contrast [32] Montemurro F, Russo F, Martincich L, et al. Dynamic contrast
agent concentration time course in vivo following bolus injection: enhanced magnetic resonance imaging in monitoring bone metastases
effect of equilibrium transcytolemmal water exchange. Magn Reson in breast cancer patients receiving bisphosphonates and endocrine
Med 2000;44:563–74. therapy. Acta Radiol 2004;45:71–4.
[14] Larsson HB, Fritz-Hansen T, Rostrup E, Sondergaard L, Ring P, [33] Michoux N, Tombal B, Machiels JP, Lecouvet F. Follow-up of
Henriksen O. Myocardial perfusion modeling using MRI. Magn Reson parametric maps of the tumoral perfusion in patients with treated bone
Med 1996;35:716–26. metastases of prostate cancer. Proceedings of the 18th Annual Meeting
[15] Tofts PS, Brix G, Buckley DL, et al. Estimating kinetic parameters of ISMRM, Stockholm, Sweden, 2010. p. 3211. [abstract].
from dynamic contrast-enhanced T(1)-weighted MRI of a diffusable [34] Stoutjesdijk MJ, Veltman J, Huisman H, et al. Automated analysis of
tracer: standardized quantities and symbols. J Magn Reson Imaging contrast enhancement in breast MRI lesions using mean shift clustering
1999;10:223–32. for ROI selection. J Magn Reson Imaging 2007;26:606–14.
[16] Ahearn TS, Staff RT, Redpath TW, Semple SIK. The use of the [35] Yankeelov T, Luci J, Lepage M, et al. Quantitative pharmacokinetic
Levenberg–Marquardt curve-fitting algorithm in pharmacokinetic analysis of DCE-MRI data without an arterial input function: a
modelling of DCE-MRI data. Phys Med Biol 2005;50:85–92. reference region model. Magn Reson Imaging 2005;25:519–29.You can also read