Metabolomic analysis and signatures in motor neuron disease
←
→
Page content transcription
If your browser does not render page correctly, please read the page content below
Metabolomics Vol. 1, No. 2, April 2005 ( 2005)                                                                                                          101
DOI: 10.1007/s11306-005-4810-1

Steve Rozen
http://www.purl.com/STEVEROZEN/

                                                                                                                                                ,
     Metabolomic analysis and signatures in motor neuron disease
Steve Rozena,b, Merit E. Cudkowiczc, Mikhail Bogdanovd, Wayne R. Matsone, Bruce S. Kristald,f, Chris Beechera,
 Scott Harrisona, Paul Vourosg, Jimmy Flarakosg, Karen Vigneau-Callahane, Theodore D. Matsonh, Kristyn M.
                Newhallc, M. Flint Beald, Robert H. Brown Jr.i, and Rima Kaddurah-Daouka,*
                                    a
                                      Metabolon Inc., 800 Capitola Dr., Research Triangle Park, NC 27709
                            b
                             Whitehead Inst. for Biomedical Research, 9 Cambridge Center, Cambridge, MA 02142
                c
                  MGH, Neurology Clinical Trial Unit, Charlestown Navy Yard, Building 149, 13th St., Charlestown, MA 02129
                             d
                              Weill Medical College of Cornell University, 525 East 68 St., New York, NY 10021
                                              e
                                               ESA, Inc., 22 Alpha Rd., Chelmsford, MA 01824
                f
                 Dementia Research Service, Burke Medical Research Institute, 785 Mamaroneck Ave., White Plains, NY 10605
                         g
                          Department of Chemistry and Barnett Institute, Northeastern University, Boston, MA 02115
                           h
                            Department of Chemistry, University of Chicago, 5735 S. Ellis Ave., Chicago, IL 60637
                   i
                    MGH, Neurology, MGH East, Charlestown Navy Yard, Building 114, 13th St., Charlestown, MA 02129

                                           Received 20 March 2005; accepted 30 March 2005

          Motor neuron diseases (MND) are a heterogeneous group of disorders that includes amyotrophic lateral sclerosis (ALS) and
      result in death of motor neurons. These diseases may produce characteristic perturbations of the metabolome, the collection of small-
      molecules (metabolites) present in a cell, tissue, or organism. To test this hypothesis, we used high performance liquid
      chromatography followed by electrochemical detection to profile blood plasma from 28 patients with MND and 30 healthy controls.
      Of 317 metabolites, 50 were elevated in MND patients and more than 70 were decreased (p
102                                S. Rozen et al./Metabolomic analysis and signatures in motor neuron disease

most or all implicated pathways, thereby revealing a                       weight, medications, including experimental agents and
biochemical signature for the disease and providing new                    antioxidants, and tobacco use were collected. For par-
insights into disease mechanisms.                                          ticipants with MND, date and site of symptom onset,
    Metabolomics is the comprehensive study of the                         date of diagnosis, and family history of MND were
repertoire of small molecules present in cells, tissues, or                recorded. Controls were healthy subjects unrelated by
other biological samples (Harrigan and Goodacre,                           blood to MND patients. Table 1 summarizes the char-
2003). This approach attempts to capture global changes                    acteristics of subjects. For Study 1: twenty three had
and overall physiological status in biochemical networks                   sporadic ALS and five had pure LMN disease (Sup-
and pathways in order to elucidate sites of perturbations                  porting table 1). For Study 2: Seventeen subjects had
(Nicholson and Wilson, 2003; Kell, 2004; Lindon et al.,                    ALS and two had pure UMN disease (Supporting table
2004; van der Greef et al., 2004). It is currently being                   2). Four subjects had familial ALS (FALS), one of
investigated as a tool for drug safety assessment and                      whom had an SOD1 mutation. Three of the FALS
disease diagnosis (Lindon et al., 2004). Metabolic                         subjects exhibited only LMN signs. Supporting table 3
changes have been reported in patients with hyperten-                      lists subjects in common between studies 1 and 2. Sup-
sion and coronary heart disease (Brindle et al., 2002;                     porting tables 4 and 5 detail medications taken.
2003). Additionally, there is great interest in integrating
metabolomic, transcriptomic and proteomic data in a
                                                                           2.2. Sample preparation and analysis
systems biology approach to understanding global
changes in biological states (van der Greef et al., 2004).                    Plasma was obtained from blood drawn into two 10-
    We therefore investigated whether MNDs such as ALS                     mL green top tubes containing sodium heparin. All
are associated with detectable metabolic changes. Bio-                     samples were centrifuged at 1800 · g for 10 min within
chemical signatures in ALS could provide biomarkers for                    30 min of collection. The supernatants were aliquoted in
the disease and its progression, tools for better stratifi-                 multiple cryovials and frozen at )80C.
cation of patients, and novel therapeutic targets. At                         Plasma was prepared for analysis by extraction in
present, no single biochemical abnormality has the sen-                    acidified acetonitrile and analyzed by high performance
sitivity and specificity needed for diagnosing ALS                          liquid chromatography (HPLC) coupled with coulo-
(Rothstein et al., 1990; Camu et al., 1993; Beal et al., 1997;             metric array detection as previously described (Matson
Smith et al., 1998; Beuche et al., 2000; Bogdanov et al.,                  et al., 1984; Milbury, 1997; Kristal et al., 1998; 2002;
2000; Simpson et al., 2003). We looked for global bio-                     Vigneau-Callahan et al., 2001; Shi et al., 2002). During
chemical differences that might distinguish ALS from                        the preparation of samples, pools were created from
healthy controls and for biochemical signatures that                       equal-volume sub-aliquots of all samples. Thus, these
would enable further sub-classification of MNDs.                            pools comprised the aggregate analytical complexity of
                                                                           all the samples in the study, and, in principle, contained
                                                                           every significant peak present in any of the samples.
2. Materials and methods                                                   Aliquots of the pool were analyzed after every seven
                                                                           samples in the run sequence. The pooling served several
2.1. Clinical samples: MND and control subjects
                                                                           purposes. First, the periodic re-analysis of the pool
  Clinical samples were obtained from the MGH                              served as a control on the overall performance of the
Neurology Clinical Trial Unit. Research participants                       analytical instruments, since replicate analyses should
provided informed consent. Data on gender, age,                            produce similar chromatograms. Second, the pools

                                                                   Table 1
                                                        Summary of research participants

                                                       Study 1 MND vs Control                           Study 2 MND (non-Riluzole) vs Control

                                              MND (n=28)                  Controls (n=30)              MND (n=19)                 Controls (n=33)

Age in Years ± SD                               54.5 ± 12.4                55.6 ± 13.0                   52.3 ± 14.8               56.2 ± 13.5
Caucasian (%)                                  100                        100                            89                       100
Male (%)                                        62                         55                            68                        67
Non-smokers (%)                                 93                         90                            82                        88
Using antioxidantsa (%)                         89                         31                            84                        29
Average number of medicationsb                   9                          2                             7                         3
Disease duration in days from                 1856.6 ± 980.9                                           1485.2±763.3
  onset to death ± SD
a
  In both studies, the proportion of participants taking antioxidants was greater for patients than for controls (p < 8.8 · 10)6 and p < 3.4 · 10)4,
respectively, by Fisher’s exact test, two sided).
b
  In both studies, the average number of medications was significantly higher for patients than for controls (p < 2.1 · 10)6 and p < 9.4 · 10)3,
respectively, by t-test).
S. Rozen et al./Metabolomic analysis and signatures in motor neuron disease                    103

provided a benchmark for aligning chromatograms                    Figures 2 and 4 were based on the relative class associ-
from different samples in the temporal dimension, since             ation measure (Golub et al., 1999). For multivariate
all peaks in the samples should be in the pools. Third,            regression (Figures 3 and 5): Partial least squares discri-
the concentration of each peak was expressed as a per-             minant analysis (PLS-DA) was performed using SIMCA-
centage of the concentration of that peak in the middle            P, v10.5 (Umetrics, Kinnelon, NJ) as described (Manley,
pool run. Fourth, the replicate analyses of the pool               1994; Kennedy et al., 1997; Eriksson et al., 2001).
provided an estimate of the coefficient of variation
associated with each peak, that is, the standard devia-
                                                                   3. Results
tion of the peak height across pool replicates normalized
to mean peak height. Peaks considered in the analysis                 Our first study was designed to assess whether there
were those that had good precision in the replicate                are systematic differences between redox-active metab-
analyses of the pool. Of the 1500 peaks detected in the           olites in the blood of patients with MND and healthy
pooled samples, 317 were judged to meet this criterion in          controls (table 1). We analyzed the blood plasma of 30
study1 and 289 in study 2.                                         healthy controls and of 28 individuals with MND using
                                                                   electrochemical detection, which consists of high per-
                                                                   formance liquid chromatography separation followed
2.3. Mass spectrometric analysis
                                                                   by with coulometric array detection. This technique
   LC-MS analysis was conducted on an HP1090 LC                    separates compounds in two dimensions: by hydropho-
(Wilmington, DE) equipped with a Thermo Betasil C18                bicity and oxidation potential (figure 1). Chromato-
125 · 2.1 mm, 5 lm reversed phased column (San Jose,               graphic data were reduced to tabular form by initial
CA) with a binary isocratic composition of 65/35% B/A              signal processing, which included aligning the chroma-
(A=95/5 and B=20/80 of 10 mM ammonium formate/                     tograms in the temporal dimension, followed by the use
methanol) at a flow rate of 0.2 mL/min. The LC was                  of peak heights as estimators of compound concentra-
coupled to a Finnigan LCQ classic ion trap (San Jose, CA)          tion. We obtained relative concentrations for 317
or Micromass Q-Tof mass spectrometer (Manchester,                  metabolites (Supporting Data Set 1).
UK) fitted with an electrospray ionization source and                  Initial exploration of these 317 metabolites in 58
operated in full scan mode in the range from 50 to 500 Da.         individuals suggested that some metabolites had differ-
   GC-MS analysis was carried out on a Thermo                      ent concentrations in normal versus MND plasma. The
PolarisQ gas chromatograph coupled with an ion-trap                concentrations of some of these metabolites are shown
mass spectrometer (GC-MS). The system was fitted with               graphically in figure 2. Each column in the grid repre-
a 30 m long, 0.25 mm I.D. RTX-5 with a film thickness               sents an individual, and each row represents a single
of 0.25 lm 0.1 lm (Restek Corp. PA). After an initial              metabolite. The color of each cell indicates the concen-
hold time of five min, the GC column temperature was                tration of one metabolite in one person, relative to the
programmed from 40C to a final temperature of 340C                concentrations of that metabolite in all the samples. For
at a rate of 20C/min. The sample was prepared for GC-             a given metabolite, blue shades indicate lower-than-
MS analysis by dissolving in 0.5 mL of N, O-Bis(trim-              average concentrations, red shades higher-than-average
ethylsilyl)-trifluoroacetamide (BSTFA) containing 1%                concentrations. Panel A shows metabolites with gener-
Trimethylchlorosilane (TMCS) (Pierce, IL) catalyst and             ally higher concentrations in MND patients than in
heating in a sealed vial to 60C for 15 min to form                controls, and panel B shows metabolites with generally
trimethylsilyl derivatives. The derivatized sample                 lower concentrations in MND patients than in controls.
was then injected without further preparation into the             We analyzed these data to determine if these differences
GC-MS for characterization by electron impact ioniza-              were statistically significant after taking into consider-
tion and chemical ionization (CI; CH4 reagent gas).                ation the multiple hypothesis testing implicit in the
                                                                   examination of 317 metabolites. We used permutation
                                                                   tests that randomly reshuffled diagnostic categories to
2.4. Data mining
                                                                   assess which metabolites had statistically significant
   To determine which metabolites were significantly                differences between controls and MND patients. These
elevated or reduced in MND: We used three measures of              tests confirmed that over 100 metabolites showed sig-
class association, the t-statistic, Pearson’s correlation          nificantly different concentrations in normal versus
coefficient, and the ‘relative class association’ measure            MND plasmas (p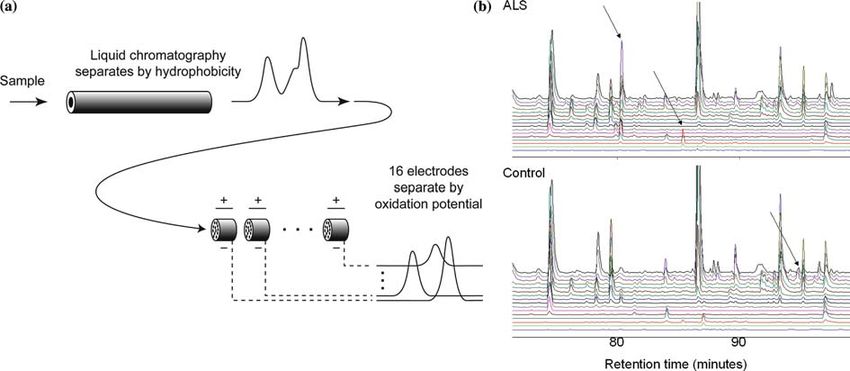
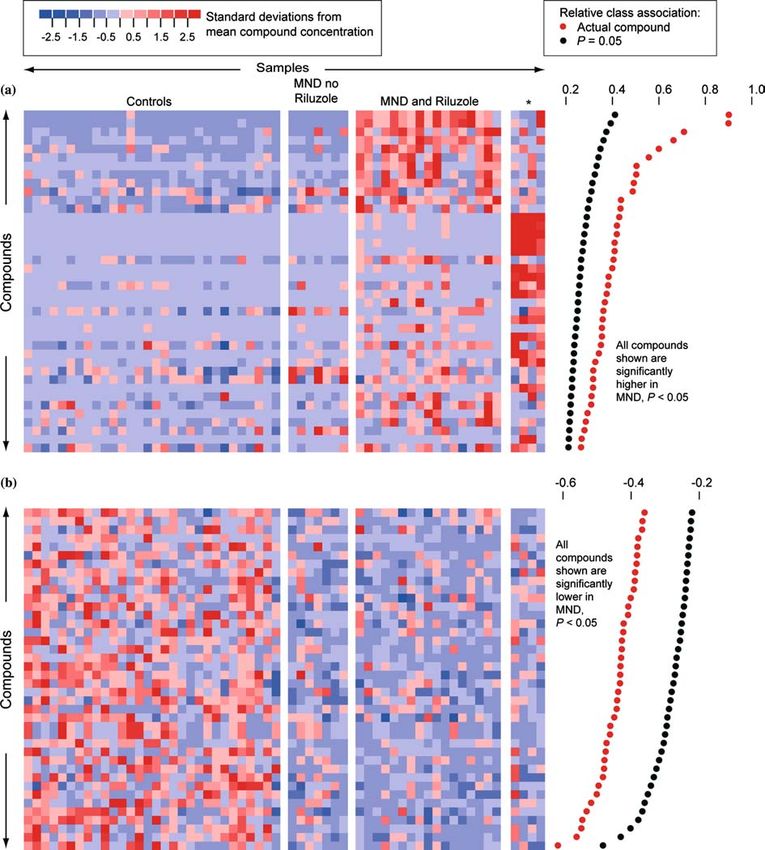
104                                 S. Rozen et al./Metabolomic analysis and signatures in motor neuron disease

Figure 1. Metabolic profiling using coulometric array detection, a form of electrochemical detection. (a) Coulometric array detection separates
molecules in two dimensions: hydrophobicity and oxidation potential. Samples are injected into a high performance liquid chromatography
(HPLC) column, where they are fractionated by hydrophobicity. The eluent of the column flows through porous electrodes representing 16 different
electrical potentials—the coulometric array. These electrodes detect redox-active metabolites by measuring their oxidation potentials. Each
electrode generates one chromatogram. Thus, the output consists of 16 parallel chromatograms corresponding to 16 different oxidation potentials.
The height of a peak in one of the output chromatograms provides the concentration of a metabolite with a particular hyrdophobicity and oxidation
potential. As indicated schematically in this figure, this method is able to use oxidation potential to separate peaks that still overlap after separation
by hydrophobicity. (b) Coulometric array chromatograms from plasmas of an ALS patient and a healthy control. Arrows indicate three differences
between the chromatograms. Chromatograms are arranged from the lowest oxidation potential at the bottom to highest at the top.

which LMN disease was over-represented and that was                           porting Data Set 2). Permutation tests carried out as on
characterized by a distinctive signature of highly corre-                     the first data set showed six metabolites for which high
lated metabolites. As shorthand we will refer to this last                    concentrations were significantly associated with MND
subgroup as the subgroup ‘enriched for LMN’. The dis-                         (figure 4). The lower number of metabolites that were
tinctive signature of this group apparently does not stem                     significantly elevated in MND in this study compared to
from any medication specific to this subgroup. Only                            study 1 appeared to be due to the absence of Riluzole-
vitamin E was common to all members of this subgroup,                         associated compounds and to a smaller sample size.
and vitamin E is also taken by a large portion of subjects                    Over 70 metabolites had concentrations significantly
who do not show this signature (Supporting table 4).                          lower in MND plasma. We also found a projection into
   We next analyzed these data to determine if the                            two dimensions that clearly and significantly separated
metabolites were capable of distinguishing four sub-                          the normal controls from the MND patients (p
S. Rozen et al./Metabolomic analysis and signatures in motor neuron disease                                  105

Figure 2. Metabolites with significantly different concentrations in normal and MND plasmas in study 1. (a) Metabolites higher in MND
patients than in controls. Each row represents a metabolite, each column represents a healthy control or a patient, and each colored square
represents the relative concentration of a single metabolite in a single person. Compounds are sorted by decreasing association with MND.
Significant association measures at p=0.05 are indicated by black dots at the right. The association measures for the actual data are indicated by
red dots. A metabolite is significantly associated with MND if its relative class association (indicated by the red dot) is > than the relative class
association in 95% of the randomly permuted replicates (indicated by the black dot). The metabolites that are high in MND define three
subgroups. These consist of patients not taking Riluzole, patients taking Riluzole, and four patients with a distinctive signature (indicated by an
asterisk). Three of these patients had LMN disease. Supporting figure 1 provides identifiers for metabolite peaks and study participants. (b)
Metabolites lower in MND patients. Supporting figure 2 provides identifiers for metabolite peaks and study participants.

buffer system. The retention times of peaks 1 ([M +                         indicative of the presence of a Riluzole moiety on either
H]+=357.048) and 2 ([M + H]+=359.068) were 4.57                            of the two protonated species. MS/MS fragmentation
and 10.04 min, respectively. That of Riluzole was                          data obtained with both Q-Tof and ion trap mass
19.55 min. Inclusion of the heteroatoms of Riluzole                        spectrometers produced the following fragment ions: m/
(F-3, O; S; N-2) in the consideration of these exact                       z 340, 322, 282, and 264 for the parent of m/z 357 and
masses, yielded no reasonable elemental combination                        the series: m/z 341, 267, 251, and 249 for the parent of
106                              S. Rozen et al./Metabolomic analysis and signatures in motor neuron disease

Figure 3. PLS-DA distinguished subgroups of MND in study 1. Models using projections into three dimensions provided statistically significant
separations between subgroups (p < 0.01 by permutation test—random assignment of samples to subgroups). (a) Model including the four
patients with a distinctive signature, three of whom had LMN disease, indicated by an asterisk. (b) Model excluding these patients.

Figure 4. Metabolites with significantly different concentrations in normal controls and in MND patients not taking Riluzole. Six metabolites
were significantly higher in MND patients not taking Riluzole than in normal controls. Over 70 metabolites were significantly lower in MND
patients. Supporting figure 3 provides identifiers for metabolite peaks and study participants.

m/z 359. By comparison, MS/MS of protonated Riluz-                      possibility of a conjugate or a fragment or an induced
ole yielded mostly low abundance fragments of m/z 208,                  metabolite which may lead to a species of molecular
193 166, and 149. This would suggest that the two peaks                 mass outside of our scan range.
are not directly derived metabolites of the drug. How-                     When the isolated fraction was subsequently exam-
ever, due to the limited scan range (50–500 Da) in which                ined by GC-MS electron impact ionization, two peaks
the LC-MS data were acquired, this does not exclude the                 were observed with spectra consistent with those for the
S. Rozen et al./Metabolomic analysis and signatures in motor neuron disease 107
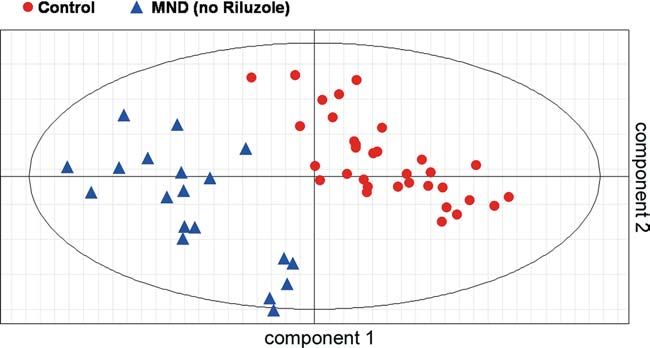
Figure 5. PLS-DA distinguished MND from controls in study 2. A model using a projection into two dimensions provided a statistically
significant separation (p108 S. Rozen et al./Metabolomic analysis and signatures in motor neuron disease
We thank L. Bruijn of the ALS Foundation, Lacomblez, L., Bensimon, G., Leigh, P., Guillett, P. and Meininger, V.
D. W. Cleveland, J. Rebek Jr., J.D. Rothstein, and (1996). Dose-ranging study of riluzole in amyotrophic lateral
sclerosis. Lancet 347, 1425–1431.
P. Schimmel for scientific discussions.
Lambrechts, D., Storkebaum, E., Morimoto, M., Del-Favero, J.,
Desmet, F., Marklund, S., S.W. and et al. (2003). VEGF is a modifier
of amyotrophic lateral sclerosis in mice and humans and protects
References motoneurons against ischemic death. Nat. Genet. 34, 383–394.
Beal, M., Ferrante, R., Browne, S., Matthews, R., Kowall, N. and Lilienfeld, D.E., Chan, E., Ehland, J., Godbold, J., Landrigan, P.J.,
Brown, R. (1997). Increased 3-Nitrotyrosine in both sporadic and Marsh, G. and Perl, D.P. (1989). Rising mortality from moto-
familial amyotrophic lateral sclerosis. Ann. Neurol. 42, 644–654. neuron disease in the USA, 1962–84. Lancet. 1, 710–713.
Bensimon, G., Lacomblez, L. and Meininger, V. (1994). A controlled Lindon, J.C., Holmes, E. and Nicholson, J.K. (2004). Metabolomics
trial of Riluzole in amyotrophic lateral sclerosis. N. Engl. J. and its role in drug development and disease diagnosis. Expert
Med. 330, 585–591. Rev. Mo. Diagn. 4, 189–199.
Beuche, W., Yushchenko, M., Mader, M., Maliszewska, M., Felgen- Manley, B. (1994). Multivariate Statistical Methods: A Primer. (second
hauer, K. and Weber, F. (2000). Matrix metalloproteinase-9 is ed.). CRC Press, Boca Raton.
elevated in serum of patients with amyotrophic lateral sclerosis. Matson, W., Langials, P., Volicer, L., Gamache, P., Bird, E. and
Neuroreport. 11, 3419–3422. Mark, K. (1984). N-electrode three dimensional liquid chro-
Bogdanov, M., Brown, R.H., Matson, W., Smart, R., Hayden, D., matography with electrochemical detection for determination of
O’Donnell, H., Flint Beal, M. and Cudkowicz, M. (2000). neurotransmitters. Clin. Chem. 30, 1477–1488.
Increased oxidative damage to DNA in ALS patients. Free McGuire, V., Longstreth, W., Koepsell, T. and Belle, G.van (1996).
Radic. Biol. Med. 29, 652–658. Incidence of ALS in three counties in western Washington state.
Brindle, J., Antti, H., Holmes, E., Traner, G., Nicholson, J., Bethell, Neurology. 47, 571–573.
H., Clarke, S., Schofield, P., McKilling, E., Mosedale, D. and Milbury, P. (1997). CEAS generation of large multiparameter data-
Grainer, D. (2002). Rapid and non-invasive diagnosis of the bases for determining categorical process involvement of bio-
presence and severity of coronary hear disease using 1H-NMR- molecules, Coulometric Array Detectors for HPLC, V.S.P.
based metabonomics. Nat. Med. 8, 1439–1444. International Science, Utrecht, the Netherlands, pp. 125–141.
Brindle, J., Nicholson, J., Schofield, P., Grainger, D. and Holmes, E. Mitsumoto, H., Chad, D. and Pioro, E. (1998). Amyotrophic Lateral
(2003). Application of chemometrics to 1H NMR spectroscopic Sclerosis. Oxford Press, New York.
data to investigate a relationship between human serum meta- Nicholson, J. K. and Wilson, I. D. (2003). Understanding ‘global’
bolic profiles and hypertension. Analyst. 128, 32–36. systems biology: metabonomics and the continuum of metabo-
Camu, W., Billiard, M. and Baldy-Moulinier, M. (1993). Fasting lism. Nat. Rev. Drug Discov. 2, 668–676.
plasma and CSF amino acid levels in amyotrophic lateral scle- Puls, I., Jonnakuty, C., LaMonte, B., Holzbaur, E., Tokito, M., Mann,
rosis: a subtype analysis. Acta Neurol. Scand. 88, 51–55. E., Floeter, M., Bidus, K., Drayna, D., Oh, S., Brown, R.,
Cleveland, D. and Rothstein, J. (2001). From Charcot to Lou Gehrig: Ludlow, C. and Fischbeck, K. (2003). Mutant dynactin in motor
Deciphering selective motor neuron death in ALS. Nat. Rev. neuron disease. Nat. Genet. 33, 455–456.
Neurosci. 2, 806–819. Rosen, D., Siddique, T., Patterson, D., Figlewicz, D., Sapp, E., Hentati,
Eriksson, L., Johansson, E., Kettaneh-Wold, N. and Wold, S. (2001). A., Donaldson, D., Goto, J., O’Reagan, J. and Deng, H. (1993).
Multi and Megavariate Analysis: Principles and Applications. Mutations in Cu/Zn superoxide dismutase gene are associated
Umetrics, Umea. with familial amyotrophic lateral sclerosis. Nature 362, 59–62.
Golub, T.R., Slonim, D.K., Tamayo, P., Huard, C., Gaasenbeek, M., Rothstein, J., Tsai, G., Kuncl, R., et al. (1990). Abnormal excitatory
Mesirov, J.P., Coller, H., Loh, M.L., Downing, J.R., Caligiuri, amino acid metabolism in amyotrophic lateral sclerosis. Ann.
M.A., Bloomfield, C.D. and Lander, E.S. (1999). Molecular Neurol. 28, 18–25.
classification of cancer: class discovery and class prediction by Rowland, L. and Shneider, N. (2001). Amyotrophic lateral sclerosis.
gene expression monitoring. Science 286, 531–537. N Engl. J. Med. 344, 1688–1700.
Hadano, S., Hand, C., Osuga, H., Yanagisawa, Y., Otomo, A., Devon, Shi, H., Vigneau-Callahan, K., Matson, W. and Kristal, B. (2002).
R., Miyamoto, N., Showguchi-Miyata, J., Okada, Y., Singaraja, Attention to relative response across sequential electrodes
R., Figlewicz, D., Kwiatkowski, T., Hosler, B., Sagie, T., improves quantitation of coulometric array. Anal. Biochem. 302,
Skaung, J., Nasir, J., Brown, R.J., Scherer, S., Rouleau, G., 239–245.
Hayden, M. and Ikeda, J. (2001). A gene encoding a putative Simpson, E., Henkel, J., Henry, Y., Smith, R. and Appel, S. (2003).
GTPase regulator is mutated in familial amyotrophic lateral Elevated levels of 4-HNE in the sera of patients wtih amyo-
sclerosis 2. Nat. Genet. 29, 166–173. trophic lateral sclerosis. Neurology 60, A242.
Harrigan, G.G. and Goodacre, R. (Eds) (2003). Metabolic Profiling: Smith, R., Henry, Y., Mattson, M. and Appel, S. (1998). Presence of
Its Role in Biomarker Discovery and Gene Function Analysis. 4-hydroxynonenal in cerebrospinal fluid of patients with spo-
Kluwer Academic Publishers, Boston. radic amyotrophic lateral sclerosis. Ann. Neurol. 44, 696–699.
Kell, D.B. (2004). Metabolomics and system biology: making sense of Greef, J.van der, Stroobant, P. and Heijden, R.van der (2004). The role
the soup. Curr. Opin. Microbiol. 7, 296–307. of analytical sciences in medical systems biology. Curr. Opin.
Kennedy, R., Lee, Y., vanRoy, B., Redd, C. and Lippman, R. (1997). Chem. Biol. 8, 559–565.
Solving Data Mining Problems Through Pattern Recognition. Vigneau-Callahan, K., Shestopalov, A., Milbury, P., Matson, W. and
Prentice Hall PTR, Indianapolis. Kristal, B. (2001). Characterization of diet-dependent metabolic
Kristal, B., Vigneeau-Callahan, K. and Matson, W. (1998). Simulta- serotypes: I. Analytical and biological variability issues. J Nutr.
neous analysis of the majority of low-molecular weight, redox- 131, 924S–932S.
active compounds from mitochondria. Anal Biochem. 263, 18–25. Yang, Y., Hentati, A., Deng, H., Dabbagh, O., Sasaki, T., Hirano, M.,
Kristal, B.S., Vigneau-Callahan, K. and Matson, W.R. (2002). Hung, W., Ouahchi, K., Yan, J., Azim, A., Cole, N., Gascon,
Simultaneous analysis of multiple redox-active metabolites from G., Yagmour, A., Ben-Hamida, M., Pericak-Vance, M., Hen-
biological matrices. Meth. Mol. Biol. 186, 185–194. tati, F. and Siddique, T. (2001). The gene encoding alsin, a
Kurtzke, J. and Kurland, L. (1989). The epidemiology of neurologic protein with three guanine-nucleotide exchange factor domains,
disease in Joynt, R. (Eds), Clinical Neurology. J.B. Lippincot, is mutated in a form of recessive amyotrophic lateral sclerosis.
Philadelphia, pp. 1–43. Nat. Genet. 29, 160–165.You can also read