DO AUDITORY MISMATCH RESPONSES DIFFER BETWEEN ACOUSTIC FEATURES? - MPG.PURE
←
→
Page content transcription
If your browser does not render page correctly, please read the page content below
BRIEF RESEARCH REPORT
                                                                                                                                     published: 01 February 2021
                                                                                                                               doi: 10.3389/fnhum.2021.613903

                                           Do Auditory Mismatch Responses
                                           Differ Between Acoustic Features?
                                           HyunJung An 1 , Shing Ho Kei 1 , Ryszard Auksztulewicz 1,2*† and Jan W. H. Schnupp 1*†
                                           1
                                            Department of Neuroscience, City University of Hong Kong, Kowloon, Hong Kong, 2 Department of Neuroscience, Max
                                           Planck Institute for Empirical Aesthetics, Frankfurt, Germany

                                           Mismatch negativity (MMN) is the electroencephalographic (EEG) waveform obtained
                                           by subtracting event-related potential (ERP) responses evoked by unexpected deviant
                                           stimuli from responses evoked by expected standard stimuli. While the MMN is thought
                                           to reflect an unexpected change in an ongoing, predictable stimulus, it is unknown
                                           whether MMN responses evoked by changes in different stimulus features have different
                                           magnitudes, latencies, and topographies. The present study aimed to investigate
                                           whether MMN responses differ depending on whether sudden stimulus change occur
                                           in pitch, duration, location or vowel identity, respectively. To calculate ERPs to standard
                                           and deviant stimuli, EEG signals were recorded in normal-hearing participants (N = 20;
                                           13 males, 7 females) who listened to roving oddball sequences of artificial syllables. In
                            Edited by:
                       Martin Sommer,      the roving paradigm, any given stimulus is repeated several times to form a standard,
     University of Göttingen, Germany      and then suddenly replaced with a deviant stimulus which differs from the standard.
                      Reviewed by:         Here, deviants differed from preceding standards along one of four features (pitch,
                       Lavinia Slabu,
       Université Côte d’Azur, France
                                           duration, vowel or interaural level difference). The feature levels were individually chosen
                      Erich Schröger,      to match behavioral discrimination performance. We identified neural activity evoked by
         Leipzig University, Germany
                                           unexpected violations along all four acoustic dimensions. Evoked responses to deviant
                  *Correspondence:
                                           stimuli increased in amplitude relative to the responses to standard stimuli. A univariate
                   Jan W. H. Schnupp
               wschnupp@cityu.edu.hk       (channel-by-channel) analysis yielded no significant differences between MMN responses
                Ryszard Auksztulewicz      following violations of different features. However, in a multivariate analysis (pooling
                   rikismo@gmail.com
                                           information from multiple EEG channels), acoustic features could be decoded from the
     † These   authors have contributed    topography of mismatch responses, although at later latencies than those typical for
                    equally to this work
                                           MMN. These results support the notion that deviant feature detection may be subserved
                   Specialty section:      by a different process than general mismatch detection.
        This article was submitted to
                                           Keywords: electroencephalography, mismatch negativity, predictive coding, auditory processing, multivariate
             Cognitive Neuroscience,
                                           decoding
                a section of the journal
    Frontiers in Human Neuroscience

         Received: 04 October 2020
         Accepted: 07 January 2021
                                           INTRODUCTION
        Published: 01 February 2021
                                           Neural activity is typically suppressed in response to expected stimuli and enhanced following novel
                           Citation:       stimuli (Carbajal and Malmierca, 2018). This effect is often summarized as a mismatch response,
 An H, Ho Kei S, Auksztulewicz R and
                                           calculated by subtracting the neural response waveform to unexpected deviant stimuli from the
   Schnupp JWH (2021) Do Auditory
 Mismatch Responses Differ Between
                                           response to expected standard stimuli. Auditory deviance detection has been associated with a
                  Acoustic Features?       human auditory-evoked potential, the mismatch negativity, occurring at about 150–250 ms from
   Front. Hum. Neurosci. 15:613903.        sound change onset (Naatanen, 2007; Garrido et al., 2008). The principal neural sources of the
   doi: 10.3389/fnhum.2021.613903          MMN are thought to be superior temporal regions adjacent to the primary auditory cortex, as

Frontiers in Human Neuroscience | www.frontiersin.org                          1                                      February 2021 | Volume 15 | Article 613903
An et al.                                                                                              Feature Dependency of Mismatch Responses

well as frontoparietal areas (Doeller et al., 2003; Chennu et al.,       dimensions (Caclin et al., 2006). The notion that mismatch
2013). Initially, the MMN was interpreted as a correlate of pre-         responses to violations of different features are mediated by
attentive encoding of physical features between standard and             independent mechanisms is also supported by studies showing
deviant sounds (Doeller et al., 2003). However, more recent              that MMN (as well as the later P3a component) typically
studies have led to substantial revisions of this hypothesis, and        decreases following two identical deviants presented in direct
currently, the most widely accepted explanation of the MMN is            succession, but remains stable following two deviants which vary
that it reflects a prediction error response.                            from the standard along different features (for a review, see
   An important theoretical question remains whether mismatch            Rosburg et al., 2018).
signaling has a domain-general or domain-specific (feature-                  However, in most previous studies (Giard et al., 1995;
dependent) implementation in the auditory processing pathway.            Schroger, 1995; Paavilainen et al., 2001; Phillips et al., 2015;
A recent study using invasive recordings from the cortical               Rosburg et al., 2018), physical differences between deviants
surface (Auksztulewicz et al., 2018) demonstrated that neural            and standards were not behaviorally matched across different
mechanisms of predictions regarding stimulus contents (“what”)           features or participants, raising the possibility that differences
and timing (“when”) can be dissociated in terms of their                 in mismatch-evoked activity might to some extent be explained
topographies and latencies throughout the frontotemporal                 by differences in stimulus salience (Shiramatsu and Takahashi,
network, and that activity in auditory regions is sensitive to           2018). This was also the case in the more recent studies on
interactions between different kinds of predictions. Additionally,       MMN responses to multiple acoustic features (Phillips et al.,
biophysical modeling of the measured signals has shown                   2015) or in previous roving paradigms (Garrido et al., 2008).
that predictions of contents and timing are best explained               Interestingly, a recent study investigating the MMN to acoustic
either by short-term plasticity or by classical neuromodulation,         violations along multiple independent features in the auditory
respectively, suggesting separable mechanisms for signaling              cortex of anesthetized rats (An et al., 2020) revealed that the
different kinds of predictions. However, these dissociations might       topography of MMN signals was highly diverse across not only
be specific to predictions of contents vs. timing, which may have        acoustic features but also individual animals, even though several
fundamentally different roles in processing stimulus sequences           sources of inter-subject variability (e.g., electrode placement)
(Friston and Buzsaki, 2016).                                             were better controlled than in typical non-invasive studies,
   Interestingly, an earlier magnetoencephalography (MEG)                suggesting that the spatial resolution of non-invasive methods
study (Phillips et al., 2015) provided evidence for a hierarchical       such as EEG or MEG might not be sufficient for mapping more
model, whereby violations of sensory predictions regarding               subtle differences between mismatch responses to violations of
different stimulus contents were associated with similar response        different features. The few EEG studies that did use behaviourally
magnitudes in auditory cortex, but different connectivity patterns       matched deviant sounds across different features either used
at hierarchically higher levels of the frontotemporal network.           very small sample sizes (N = 8; Deouell and Bentin, 1998) or
This result is consistent with the classical predictive coding           were limited to relatively specialized perceptual characteristics
hypothesis in which reciprocal feedforward and feedback                  (e.g., different timbre features; Caclin et al., 2006). In contrast,
connections at the lower levels of the hierarchy are thought to          our study used a larger sample size (N = 20) and manipulated
signal prediction errors and predictions regarding simple sensory        relatively general sound dimensions (location, pitch, duration,
features, but hierarchically higher levels are thought to signal         and syllable identity). Our primary goal was to test whether
more complex predictions and prediction errors, integrating over         mismatch responses to violations of different features differ in
multiple features (Kiebel et al., 2008). Several studies, however,       magnitude or latency, in an attempt to replicate previous studies
reported independent processing of prediction violations along           (Deouell and Bentin, 1998). However, in addition to testing the
different acoustic features or sound dimensions. An earlier              effects of acoustic feature on the MMN time-course in a mass-
study (Giard et al., 1995) investigated the neural correlates            univariate analysis (i.e., on an electrode-by-electrode basis), we
of mismatch processing across three different acoustic features          also aimed at decoding acoustic features from differences in
(frequency, intensity, and duration). Mismatch responses to              MMN topography in a multivariate analysis (i.e., pooling signals
each feature were source-localized by fitting equivalent current         from multiple electrodes).
dipoles to EEG signals, and the results indicated that violations
of different features can be linked to dissociable sources,              MATERIALS AND METHODS
suggesting the involvement different underlying populations.
Similar conclusions have been reached in another set of studies          Participants
(Schroger, 1995; Paavilainen et al., 2001), which quantified the         Twenty volunteers (13 males and 7 females; mean age 23.9
additivity of MMN to changes along different acoustic features,          years old) enrolled in the study upon written informed consent.
either in isolation or by combining two or more features. In             All participants self-reported as having normal hearing and
these studies, the MMN response to violating two features                no history of neurological disorders, and all but two were
could largely be reproduced by adding the MMN responses                  right-handed. All participants but one were native Hong Kong
to violating two single features, suggesting that the latter are         residents, and their mother tongue was Cantonese. A musical
mutually independent. A more recent study has combined these             training questionnaire indicated that 16 participants had no
two approaches (source localization and additivity analyses),            musical training, and the remaining participants had
An et al.                                                                                                                 Feature Dependency of Mismatch Responses

 FIGURE 1 | (A) Schematic representation of the stimulation sequences. The first stimulus in each train (solid circles) represents a deviant sound, while the last
 (hatched circles) represents a standard sound. (B) The range of each acoustic feature used to construct stimuli in the EEG experiment. Red line indicates the median
 value of each feature (across participants), blue bars and black whiskers represent mean and SD of upper and lower ranges across participants.

seated in a sound-attenuated and electrically shielded room in                        sequences, the stimulus duration was set to 120 ms and the inter-
front of a computer screen. They were instructed to fixate on                         stimulus intervals (ISIs) were fixed at 500 ms. Stimuli formed
a fixation cross displayed on the screen during the acoustic                          a roving oddball sequence: after 4–35 repetitions of a given
stimulation. All experimental procedures were approved by the                         stimulus (forming a standard), it was replaced with another
Human Subjects Ethics Sub-Committee of the City University                            (deviant) stimulus, randomly drawn from the set of 5 possible
of Hong Kong.                                                                         levels (Figure 1A). Roving oddball sequences corresponding to
                                                                                      different features were administered in separate blocks, in a
Stimuli                                                                               randomized order across participants. The total number of
The present study employed a roving oddball paradigm in                               stimuli in each block was ∼2,000, including 200 deviant stimuli
which auditory deviants could differ from preceding standards                         and 200 corresponding (immediately preceding) standards.
along one of four independent acoustic features. Specifically,
we manipulated two consonant-vowel (CV) syllable stimuli, /ta/                        Experimental Procedure
and /ti/ (Retsa et al., 2018), along the following independent                        We recorded signals from 64 EEG channels in a 10–20 system
acoustic features: duration, pitch, interaural level difference (ILD)                 using an ANT Neuro EEG Sports amplifier. EEG channels were
or vowel (An et al., 2020). Prior to the EEG recording, per                           grounded at the nasion and referenced to the Cpz electrode.
participant, we estimated the feature interval yielding ∼80%                          Participants were seated in a quiet room and fitted with
behavioral performance by employing a 1-up-3-down staircase                           Brainwavz B100 earphones, which delivered the audio stimuli via
procedure. In each staircase trial, two out of three stimuli,                         a MOTU Ultralite MK3 USB soundcard at 44.1 kHz. EEG signals
chosen at random, were presented at a mean level of a given                           were pre-processed using the SPM12 Toolbox for MATLAB.
feature (e.g., a 50/50 vowel mixture or a 0 dB ILD) while the                         The continuous signals were first notch-filtered between 48 and
third stimulus was higher or lower than the mean level by                             52 Hz and band-pass filtered between 0.1 and 90 Hz (both filters:
a certain interval. Participants had to indicate which stimulus                       5th order zero-phase Butterworth), and then downsampled
was the “odd one out.” Following three consecutive hits, the                          to 300 Hz. Eye blinks were automatically detected using the
interval decreased by 15%; following a mistake, the interval                          Fp1 channel, and the corresponding artifacts were removed
increased by 15%. Each participant performed 30 staircase trials                      by subtracting the two principal spatiotemporal components
for each feature (Figure 1B). For the roving oddball stimulus                         associated with each eye blink from all EEG channels (Ille

Frontiers in Human Neuroscience | www.frontiersin.org                             3                                         February 2021 | Volume 15 | Article 613903
An et al. Feature Dependency of Mismatch Responses
et al., 2002). Then, data were re-referenced to the average of were retained for further analysis. In decoding acoustic features,
all channels, segmented into epochs ranging from −100 ms we adopted a sliding window approach, integrating over the
before to 400 ms after each stimulus onset, baseline-corrected relative voltage changes within a 100 ms window around each
to the average pre-stimulus voltage, and averaged across trials time-point (Wolff et al., 2020). To this end, per channel and
to obtain ERPs for deviants and standards for each of the four trial, the time segments within 100 ms of each analyzed time-
acoustic features. point were down-sampled by binning the data over 10 ms bins,
resulting in a vector of 10 average voltage values per component.
Data Analyses Next, the data were de-meaned by removing the component-
First, to establish the presence of the MMN response, we specific average voltage over the entire 100 ms time window
converted the EEG time-series into 3D images (2D spatial from each component and time bin. These steps ensured that
topography × 1D time-course) and entered them into a the multivariate analysis approach was optimized for decoding
general linear model (GLM) with two factors (random effect transient activation patterns (voltage fluctuations around a zero
of mismatch: deviant vs. standard; fixed effect of participant), mean) at the expense of more stationary neural processes (overall
corresponding to a paired t-test. Statistical parametric maps differences in mean voltage) (Wolff et al., 2020).
were thresholded at an uncorrected p < 0.005, and the resulting The binned single-trial mismatch fluctuations were then
spatiotemporal clusters of main effects were tested for statistical concatenated across components for subsequent leave-one-
significance at the family-wise error corrected threshold pFWE out cross-validation decoding. Per trial and time point, we
< 0.05, taking into account the spatiotemporal correlations and calculated the Mahalanobis distance (De Maesschalck et al.,
multiple comparisons across channels and time points. 2000) (scaled by the noise covariance matrix of all components)
In an additional control analysis, we have tested whether between the vector of concatenated component fluctuations
the mismatch responses observed in this study were modulated of this trial (test trial) and four other vectors, obtained from
by adaptation effects, which have been shown to be especially the remaining trials, and corresponding to the concatenated
prominent in the N1 range (Baldeweg et al., 2004). To component fluctuations averaged across trials, separately for each
this end, per standard stimulus (i.e., the last stimulus in a of the four features. The resulting Mahalanobis distance values
sequence of identical stimuli), we have calculated the number were averaged across trials, separately for each acoustic feature,
of stimuli separating it from the preceding deviant (i.e., the resulting in 4 × 4 distance matrices. These distance matrices were
first stimulus in a sequence of identical stimuli). If our summarized per time point and participant as a single decoding
results were indeed confounded by adaptation, the difference estimate, by subtracting the mean off-diagonal from diagonal
between responses evoked by deviants vs. standards should be terms (Figure 3A).
modulated by the number of stimuli preceding each deviant. In a final analysis, since we have observed univariate
To test this hypothesis, we have regressed out the number of mismatch responses as well as multivariate mismatch-based
preceding stimuli from single-trial standard-evoked responses feature decoding at similar latencies (see Results), we have
(using two regressors: a linear regressor, coding for the actual tested whether these two effects are related. To this end, we
number of preceding stimuli, and a log-transformed regressor, performed a correlation analysis between single-trial decoding
approximating empirically observed adaptation effects; (e.g., estimates (i.e., the relative Mahalanobis distance values between
Baldeweg et al., 2004), and subjected the residuals to the EEG topography corresponding to mismatch responses following
remaining univariate analysis steps (i.e., averaging the single-trial violations of the same vs. different features), and single-trial
responses to obtain ERPs, and performing statistical inference MMN amplitudes. We calculated Pearson correlation coefficients
while correcting for multiple comparisons across channels and across single trials, per channel, time point, and participants.
time points). The resulting correlation coefficients were subject to statistical
Then, to test whether MMN amplitudes differed between inference using statistical parametric mapping (one-sample t-
stimulus features, ERP data were entered into a flexible-factorial test; significance thresholds as in the other univariate analysis,
GLM with one random factor (participant) and two fixed corrected for multiple comparisons across time points and
factors (mismatch: deviant vs. standard; feature: pitch, duration, channels using family-wise error).
ILD, and vowel), corresponding to a repeated-measures 2 × 4
ANOVA. Statistical significance thresholds were set as above.
Finally, to test whether mismatch responses can be used to RESULTS
decode the violated acoustic features, we subjected the data
to a multivariate analysis. Prior to decoding, we calculated Taken together, in this study, we tested whether auditory
single-trial mismatch response signals by subtracting the EEG mismatch responses are modulated by violations of independent
signal evoked by each standard from the signal evoked by the acoustic features. First, consistent with previous literature
subsequent deviant. Data dimensionality was reduced using PCA (Doeller et al., 2003; Garrido et al., 2008), we observed
(principal component analysis), resulting in spatial principal overall differences between the ERPs evoked by deviant stimuli
components (describing channel topographies) and temporal vs. standard stimuli, in a range typical for MMN responses
principal components (describing voltage time-series), sorted as well as at longer latencies (Figure 2A). Specifically, the
by the ratio of explained variance. Only those top components univariate ERP analysis confirmed that EEG amplitudes differed
which, taken together, explained 95% of the original variance, significantly between deviants and standards when pooling over
Frontiers in Human Neuroscience | www.frontiersin.org 4 February 2021 | Volume 15 | Article 613903An et al. Feature Dependency of Mismatch Responses
FIGURE 2 | (A) The topography (left) and time-course (right) of the mismatch response. The highlighted topography cluster represents the significant difference
between deviants and standards. Based on this cluster, the average waveform of the evoked response is plotted separately for auditory standards (blue) and deviants
(red). The horizontal bars (black) indicate time points with a significant difference between deviants and standards. Shaded areas denote SEM (standard error of the
mean) across participants. (B) The average response to acoustic standards (blue) and deviants (red) for different feature conditions, extracted from the same cluster
as in (A). No interaction effects were significant after correcting for multiple comparisons across channels and time points.
all the acoustic features tested. This effect was observed over auditory regions, but instead were reflected in more distributed
two clusters: the central EEG channels showed a significant activity patterns (frontotemporal connectivity estimates).
mismatch response between 115 and 182 ms (cluster-level pFWE The resulting decoding time-courses of each participant
< 0.001, Tmax = 3.94), while posterior channels showed a were entered into a GLM and subject to one-sample t-tests,
significant mismatch response between 274 and 389 ms (cluster- thresholded at an uncorrected p < 0.05 and correcting for
level pFWE < 0.001, Tmax = 5.46), within the range of a multiple comparisons across time points at a cluster-level
P3b component. A control analysis, in which we controlled for pFWE < 0.05. In this analysis, significant acoustic feature
single-trial adaptation effect to the standard tones, yielded a decoding was observed between 247 and 350 ms relative to tone
virtually identical pattern of results as the original analysis (two onset (cluster-level pFWE = 0.000, Tmax = 2.77) (Figure 3B).
significant clusters of differences between responses to deviants Thus, when pooling information from multiple EEG channels,
vs. standards: an earlier cluster between 130 and 143 ms over acoustic features could be decoded from the topography of
central channels, cluster-level pFWE < 0.001, Tmax = 15.48, and mismatch responses, although at later latencies than typical
a later cluster between 317 and 327 ms over posterior channels, for MMN.
cluster-level pFWE < 0.001, Tmax = 17.48). Since we have observed both univariate mismatch responses
Although the ERP time-courses differed between deviant and multivariate mismatch-based feature decoding at late
and standard stimuli when pooling over violations of different latencies (univariate: 274–389 ms; multivariate: 247–350 ms),
acoustic features, a univariate (channel-by-channel) analysis we have performed an additional single-trial correlation
revealed no significant differences in the amplitudes or time- analysis to test whether these two effects are related. This
courses of mismatch responses between independent stimulus analysis (Figure 3C) has yielded no significant clusters
features (Figure 2B). These results are consistent with a previous of correlation coefficients between single-trial mismatch
study (Phillips et al., 2015) which found that multiple deviant amplitudes and decoding estimates, while correcting for
stimulus features (frequency, intensity, location, duration, and multiple comparisons across channels and time points
silent gap) were not associated with differences in activity in the (Tmax = 3.74, all pFWE > 0.005).
Frontiers in Human Neuroscience | www.frontiersin.org 5 February 2021 | Volume 15 | Article 613903An et al. Feature Dependency of Mismatch Responses
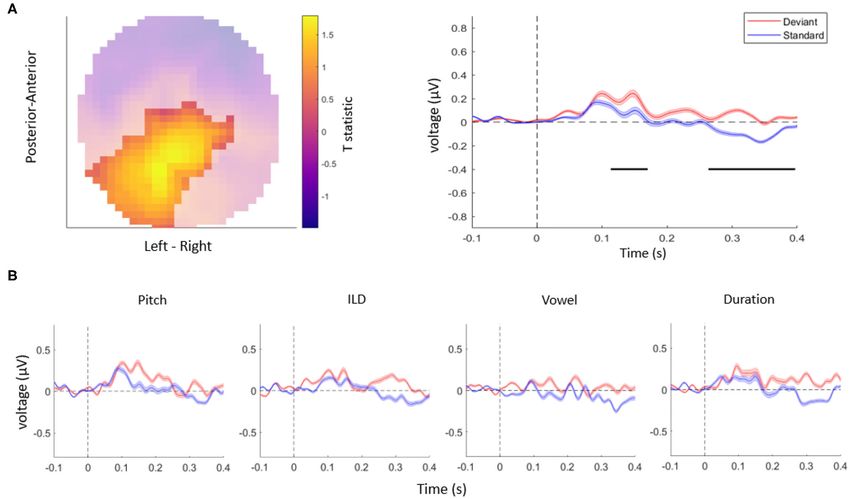
FIGURE 3 | (A) Decoding methods. Left panel: for each trial, we calculated the Mahalanobis distance, based on multiple EEG components (here shown schematically
for two components), between the mismatch response in a given (test) trial (empty circle) and the average mismatch responses based on the remaining trials (black
circle: same feature as test trial; gray circles: different features). Right panel: after averaging the distance values across all trials, we obtained 4 by 4 similarity matrices
between all features, such that high average Mahalanobis distance corresponded to low similarity between features. Based on these matrices, we summarized feature
decoding as the difference between the diagonal and off-diagonal terms. (B) Multivariate analysis. The average time course of the decoding of acoustic features
based on single-trial mismatch response. The gray-shaded area denotes the SEM across participants, and the horizontal bar (black) shows the significant time
window. (C) Decoding vs. MMN correlation analysis. Plot shows the time-series of mean correlation coefficients between single-trial decoding estimates and
single-trial MMN amplitudes, calculated for Cz/Cpz channels and averaged across participants (shaded areas: SEM across participants). No significant correlations
were observed when correcting for multiple comparisons across channels and time points.
DISCUSSION another study has used magnetoencephalography to identify
mid-latency effects of local prediction violations of simple
In this study, since a univariate analysis of interactions between stimulus features, and contrasted them with later effects of global
mismatch signals and acoustic features might not be sensitive prediction violations of stimulus patterns (Recasens et al., 2014).
enough to reveal subtle and distributed amplitude differences Taken together, these studies would suggest that, in paradigms
between conditions, we adopted a multivariate analysis aiming at where multiple acoustic features vary independently (such as
decoding the violated acoustic feature from single-trial mismatch here), a plausible pattern of results would be that independent
response topographies. This demonstrated that acoustic features feature predictions should be mismatched at relatively early
could be decoded from the topography of mismatch responses, latencies, since an integrated representation is not required. Here,
although at later latencies than typical for MMN (Figure 3B). however, we found feature-specificity in the late latency range,
An earlier oddball study (Leung et al., 2012) examined ERP rather than in the mid-latency range. The discrepancy between
differences to violations of four features (frequency, duration, our results and the previous studies might be explained by
intensity, and interaural difference). The study found that different stimulus types. While the previous studies used simple
frequency deviants were associated with a significant amplitude acoustic stimuli, here we used complex syllable stimuli, possibly
change in the middle latency range. This result indicated that tapping into the later latencies of language-related mismatch
deviant feature detection may be subserved by a different process responses, as compared to MMN following violations of non-
than general mismatch detection. Consistent with this notion, speech sounds.
Frontiers in Human Neuroscience | www.frontiersin.org 6 February 2021 | Volume 15 | Article 613903An et al. Feature Dependency of Mismatch Responses
Speech sounds have been hypothesized to be processed In conclusion, the present study identified functional
in separate streams which independently derive semantic dissociations between deviance detection and deviance feature
information (“what” processing) and sound location (“where” detection. First, while mismatch responses were observed at
processing) (Kaas and Hackett, 2000; Tian et al., 2001; Schubotz latencies typical for the MMN as well as at longer latencies,
et al., 2003; Camalier et al., 2012; Kusmierek and Rauschecker, channel-by-channel analyses revealed no robust differences
2014). In most animal studies, the hierarchical organization of between mismatch responses following violations of different
the auditory cortex has been linked to a functional distribution acoustic features. However, we demonstrate that acoustic features
of stimulus processing, such that core (hierarchically lower) could be decoded at longer latencies based on fine-grained
regions respond preferentially to simple stimuli, whereas belt spatiotemporal patterns of mismatch responses. This finding
and other downstream (hierarchically higher) regions respond suggests that deviance feature detection might be mediated
to more complex stimuli such as band-passed noise and speech by later and more distributed neural responses than deviance
(Rauschecker et al., 1995; Recanzone et al., 2000; Rauschecker detection itself.
and Tian, 2004; Kusmierek and Rauschecker, 2009; Rauschecker
and Scott, 2009). This is supported by evidence functional DATA AVAILABILITY STATEMENT
magnetic resonance imaging (fMRI) studies in humans (Binder
et al., 2000) showing that earlier auditory regions (Heschl’s gyrus The raw data supporting the conclusions of this article will be
and surrounding fields) respond preferentially to unstructured made available by the authors, without undue reservation.
noise stimuli, while progressively more complex stimuli such
as frequency-modulated tones show more lateral response ETHICS STATEMENT
activation patterns. In that study, speech sounds showed
most pronounced activations spreading ventrolaterally into the The studies involving human participants were reviewed and
superior temporal sulcus. This result supports a hierarchical approved by Human Subjects Ethics Sub-Committee of the City
model of auditory speech processing in the human auditory University of Hong Kong. The patients/participants provided
cortex based on complexity and integration of temporal and their written informed consent to participate in this study.
spectral features. Based on this notion, the relatively long latency Written informed consent was obtained from the individual(s)
of neural responses compared to previous studies using pure for the publication of any potentially identifiable images or data
tones might be partially explained by the fact that we used included in this article.
spectrally and temporally complex speech stimuli.
However, our results can also be explained in terms of AUTHOR CONTRIBUTIONS
a hierarchical deviance detection system based on predictive
coding (Kiebel et al., 2008). On this account, neural responses HA: formal analysis, writing original draft, conceptualization,
supporting the lower and higher hierarchical stages communicate and conducted experiment. SH: conducted experiment
continuously through reciprocal pathways. When exposed to and formal analysis. RA: formal analysis, supervision,
repetitive stimuli, the bottom-up (ascending) sensory inputs project administration, and conceptualization. JS: project
can be “explained away” by top-down (descending) connections administration, conceptualization, investigation, and
mediating prediction signaling, resulting in weaker prediction supervision. All authors contributed to the article and approved
error signaling back to the hierarchically higher regions. the submitted version.
Substituting the predicted standard with unpredicted deviant
results in a failure of top-down suppression by prior predictions. FUNDING
This leads to an increased prediction error signaling back to
higher regions, providing an update for subsequent predictions. This work has been supported by the European Commission’s
As a result, the later and more distributed activity patterns Marie Skłodowska-Curie Global Fellowship (750459 to RA), the
might reflect higher-order prediction errors, signaled to regions Hong Kong General Research Fund (11100518 to RA and JS), and
integrating multiple stimulus features and representing the entire a grant from European Community/Hong Kong Research Grants
range of stimuli likely to appear in a particular context. Council Joint Research Scheme (9051402 to RA and JS).
REFERENCES Baldeweg, T., Klugman, A., Gruzelier, J., and Hirsch, S. R. (2004). Mismatch
negativity potentials and cognitive impairment in schizophrenia. Schizophr.
An, H., Auksztulewicz, R., Kang, H., and Schnupp, J. W. H. (2020). Cortical Res. 69, 203–217. doi: 10.1016/j.schres.2003.09.009
mapping of mismatch responses to independent acoustic features. Hear. Res. Binder, J. R., Frost, J. A., Hammeke, T. A., Bellgowan, P. S., Springer, J. A.,
399:107894. doi: 10.1016/j.heares.2020.107894 Kaufman, J. N., et al. (2000). Human temporal lobe activation by speech and
Auksztulewicz, R., Schwiedrzik, C. M., Thesen, T., Doyle, W., Devinsky, O., nonspeech sounds. Cereb. Cortex 10, 512–528. doi: 10.1093/cercor/10.5.512
Nobre, A. C., et al. (2018). Not all predictions are equal: “What” and Caclin, A., Brattico, E., Tervaniemi, M., Naatanen, R., Morlet, D., Giard,
“When” predictions modulate activity in auditory cortex through different M. H., et al. (2006). Separate neural processing of timbre dimensions
mechanisms. J. Neurosci. 38, 8680–8693. doi: 10.1523/JNEUROSCI.0369-1 in auditory sensory memory. J. Cogn. Neurosci. 18, 1959–1972.
8.2018 doi: 10.1162/jocn.2006.18.12.1959
Frontiers in Human Neuroscience | www.frontiersin.org 7 February 2021 | Volume 15 | Article 613903An et al. Feature Dependency of Mismatch Responses
Camalier, C. R., D’Angelo, W. R., Sterbing-D’Angelo, S. J., de la Mothe, L. A., Phillips, H. N., Blenkmann, A., Hughes, L. E., Bekinschtein, T. A., and Rowe,
and Hackett, T. A. (2012). Neural latencies across auditory cortex of macaque J. B. (2015). Hierarchical organization of frontotemporal networks for the
support a dorsal stream supramodal timing advantage in primates. Proc. Natl. prediction of stimuli across multiple dimensions. J. Neurosci. 35, 9255–9264.
Acad. Sci. U.S.A. 109, 18168–18173. doi: 10.1073/pnas.1206387109 doi: 10.1523/JNEUROSCI.5095-14.2015
Carbajal, G. V., and Malmierca, M. S. (2018). The neuronal basis of Rauschecker, J. P., and Scott, S. K. (2009). Maps and streams in the auditory cortex:
predictive coding along the auditory pathway: from the subcortical nonhuman primates illuminate human speech processing. Nat. Neurosci. 12,
roots to cortical deviance detection. Trends Hear. 22:2331216518784822. 718–724. doi: 10.1038/nn.2331
doi: 10.1177/2331216518784822 Rauschecker, J. P., and Tian, B. (2004). Processing of band-passed noise in
Chennu, S., Noreika, V., Gueorguiev, D., Blenkmann, A., Kochen, S., Ibanez, A., the lateral auditory belt cortex of the rhesus monkey. J. Neurophysiol. 91,
et al. (2013). Expectation and attention in hierarchical auditory prediction. J. 2578–2589. doi: 10.1152/jn.00834.2003
Neurosci. 33, 11194–11205. doi: 10.1523/JNEUROSCI.0114-13.2013 Rauschecker, J. P., Tian, B., and Hauser, M. (1995). Processing of complex
De Maesschalck, R., Jouan-Rimbaud, D., and Massart, D. L. (2000). sounds in the macaque nonprimary auditory cortex. Science 268, 111–114.
The Mahalanobis distance. Chemomet. Intellig. Lab. Syst. 50, 1–18. doi: 10.1126/science.7701330
doi: 10.1016/S0169-7439(99)00047-7 Recanzone, G. H., Guard, D. C., and Phan, M. L. (2000). Frequency
Deouell, L. Y., and Bentin, S. (1998). Variable cerebral responses to equally and intensity response properties of single neurons in the auditory
distinct deviance in four auditory dimensions: a mismatch negativity study. cortex of the behaving macaque monkey. J. Neurophysiol. 83, 2315–2331.
Psychophysiology 35, 745–754. doi: 10.1111/1469-8986.3560745 doi: 10.1152/jn.2000.83.4.2315
Doeller, C. F., Opitz, B., Mecklinger, A., Krick, C., Reith, W., and Schroger, Recasens, M., Grimm, S., Wollbrink, A., Pantev, C., and Escera, C. (2014).
E. (2003). Prefrontal cortex involvement in preattentive auditory deviance Encoding of nested levels of acoustic regularity in hierarchically organized
detection: neuroimaging and electrophysiological evidence. Neuroimage 20, areas of the human auditory cortex. Hum. Brain Mapp. 35, 5701–5716.
1270–1282. doi: 10.1016/S1053-8119(03)00389-6 doi: 10.1002/hbm.22582
Friston, K., and Buzsaki, G. (2016). The functional anatomy of time: what and Retsa, C., Matusz, P. J., Schnupp, J. W. H., and Murray, M. M.
when in the brain. Trends Cogn. Sci. 20, 500–511. doi: 10.1016/j.tics.2016.05.001 (2018). What’s what in auditory cortices? Neuroimage 176, 29–40.
Garrido, M. I., Friston, K. J., Kiebel, S. J., Stephan, K. E., Baldeweg, T., and Kilner, doi: 10.1016/j.neuroimage.2018.04.028
J. M. (2008). The functional anatomy of the MMN: a DCM study of the roving Rosburg, T., Weigl, M., Thiel, R., and Mager, R. (2018). The event-related
paradigm. Neuroimage 42, 936–944. doi: 10.1016/j.neuroimage.2008.05.018 potential component P3a is diminished by identical deviance repetition,
Giard, M. H., Lavikahen, J., Reinikainen, K., Perrin, F., Bertrand, O., Pernier, but not by non-identical repetitions. Exp. Brain Res. 236, 1519–1530.
J., et al. (1995). Separate representation of stimulus frequency, intensity, and doi: 10.1007/s00221-018-5237-z
duration in auditory sensory memory: an event-related potential and dipole- Schroger, E. (1995). Processing of auditory deviants with changes in
model analysis. J. Cogn. Neurosci. 7, 133–143. doi: 10.1162/jocn.1995.7.2.133 one versus two stimulus dimensions. Psychophysiology 32, 55–65.
Ille, N., Berg, P., and Scherg, M. (2002). Artifact correction of the ongoing EEG doi: 10.1111/j.1469-8986.1995.tb03406.x
using spatial filters based on artifact and brain signal topographies. J. Clin. Schubotz, R. I., von Cramon, D. Y., and Lohmann, G. (2003). Auditory what,
Neurophysiol. 19, 113–124. doi: 10.1097/00004691-200203000-00002 where, and when: a sensory somatotopy in lateral premotor cortex. Neuroimage
Kaas, J. H., and Hackett, T. A. (2000). Subdivisions of auditory cortex and 20, 173–185. doi: 10.1016/S1053-8119(03)00218-0
processing streams in primates. Proc. Natl. Acad. Sci. U.S.A. 97, 11793–11799. Shiramatsu, T. I., and Takahashi, H. (2018). Mismatch negativity in rat auditory
doi: 10.1073/pnas.97.22.11793 cortex represents the empirical salience of sounds. Front. Neurosci. 12:924.
Kiebel, S. J., Daunizeau, J., and Friston, K. J. (2008). A hierarchy of time-scales and doi: 10.3389/fnins.2018.00924
the brain. PLoS Comput. Biol. 4:e1000209. doi: 10.1371/journal.pcbi.1000209 Tian, B., Reser, D., Durham, A., Kustov, A., and Rauschecker, J. P. (2001).
Kusmierek, P., and Rauschecker, J. P. (2009). Functional specialization of Functional specialization in rhesus monkey auditory cortex. Science 292,
medial auditory belt cortex in the alert rhesus monkey. J. Neurophysiol. 102, 290–293. doi: 10.1126/science.1058911
1606–1622. doi: 10.1152/jn.00167.2009 Wolff, M. J., Kandemir, G., Stokes, M. G., and Akyurek, E. G. (2020). Unimodal and
Kusmierek, P., and Rauschecker, J. P. (2014). Selectivity for space and time in early bimodal access to sensory working memories by auditory and visual impulses.
areas of the auditory dorsal stream in the rhesus monkey. J. Neurophysiol. 111, J. Neurosci. 40, 671–681. doi: 10.1523/JNEUROSCI.1194-19.2019
1671–1685. doi: 10.1152/jn.00436.2013
Leung, S., Cornella, M., Grimm, S., and Escera, C. (2012). Is fast auditory Conflict of Interest: The authors declare that the research was conducted in the
change detection feature specific? An electrophysiological study in absence of any commercial or financial relationships that could be construed as a
humans. Psychophysiology 49, 933–942. doi: 10.1111/j.1469-8986.2012. potential conflict of interest.
01375.x
Naatanen, R. (2007). The mismatch negativity - where is the big Copyright © 2021 An, Ho Kei, Auksztulewicz and Schnupp. This is an open-access
fish? J. Psychophysiol. 21, 133–137. doi: 10.1027/0269-8803.21. article distributed under the terms of the Creative Commons Attribution License (CC
34.133 BY). The use, distribution or reproduction in other forums is permitted, provided
Paavilainen, P., Valppu, S., and Naatanen, R. (2001). The additivity of the the original author(s) and the copyright owner(s) are credited and that the original
auditory feature analysis in the human brain as indexed by the mismatch publication in this journal is cited, in accordance with accepted academic practice.
negativity: 1+1 approximate to 2 but 1+1+1 < 3. Neurosci. Lett. 301, 179–182. No use, distribution or reproduction is permitted which does not comply with these
doi: 10.1016/S0304-3940(01)01635-4 terms.
Frontiers in Human Neuroscience | www.frontiersin.org 8 February 2021 | Volume 15 | Article 613903You can also read