Behavior of Grouted Sleeve Splice for Steel Profile under Tensile Loadings - MDPI
←
→
Page content transcription
If your browser does not render page correctly, please read the page content below
Article

Behavior of Grouted Sleeve Splice for Steel Profile
under Tensile Loadings
Feng Lin 1,2,* and Peng Zhao 2
 1 Key Laboratory of Performance Evolution and Control for Engineering Structures (Tongji University),
   Ministry of Education, Shanghai 200092, China
 2 Department of Structural Engineering, Tongji University, Shanghai 200092, China; zhaopengld@163.com

 * Correspondence: lin_feng@tongji.edu.cn

 Received: 22 March 2020; Accepted: 24 April 2020; Published: 27 April 2020

 Abstract: Two groups of grouted sleeve splices for steel profile were tested to investigate their
 tensile behavior, serving as pilot studies for novel prefabricated reinforced concrete shear wall
 structures. In the first group, four splice specimens with different embedded lengths of steel profile
 were monotonic tensile loaded to determine an appropriate anchorage length. In the second group,
 three splice specimens with a conservative anchorage length of steel profile were tested under
 repeated tensile loading, cyclic loading at high stress, and cyclic loading at large strain, respectively.
 Parametric studies were then conducted on sleeve thickness, grout strength, offset of steel profile,
 and misalignment of steel profile using finite element method (FEM)-based models. The results
 show that the splices in the second group behaved well with minor residential deformation and
 almost no pinching effect. The optimized sleeve thickness could be appropriately determined using
 FEM models. The compressive strengths of the grout exceeding a threshold value and the offset of
 steel profile had minor influence on splice behavior, while the misalignment of steel profile had a
 pronounced effect.

 Keywords: steel profile; grouted splice; grout-filled sleeve; anchorage length; FEM model

1. Introduction
     Precast concrete structures are constructed worldwide because they speed up construction,
require less labor, and minimize the impact on the environment compared to cast-in-situ concrete
structures [1–2]. Consequently, precast construction is extensively used in many countries in
commercial and institutional buildings [3] as well as in bridge engineering [4]. A majority of precast
components are fabricated in factories, transported to the construction site, and connected to
implement structural integrity. To achieve this process, using grout to connect reinforcing steel bars
in adjacent components is regarded as a preferred technology due to controllable tolerance and no
need to weld at construction site.
     Two main technologies can be identified for connecting rebars in precast concrete structures, i.e.,
grouted sleeve splice and grouted duct connection. For the grouted sleeve splice, Figure 1 illustrates
a cross section of such splice of typical configuration. Two reinforcing steel bars were collinear and
inserted into the sleeve. After that, commercially available grout, which is specifically prepared for
the grouted sleeve splices, was poured into the sleeve using dedicated facilities. The grout is cement-
based and featured with high fluidity, slightly expanding, and high early strength. Over the last few
decades, many experimental and numerical studies have been conducted to understand the failure
modes, influencing factors and structural performance of the grout-filled splices [5−13]. These studies
have revealed that rebar fracture and rebar pull-out for splices under tensile loading were the most
common failure modes that occurred in tests. The critical factors that influenced the structural

Materials 2020, 13, 2037; doi:10.3390/ma13092037                              www.mdpi.com/journal/materials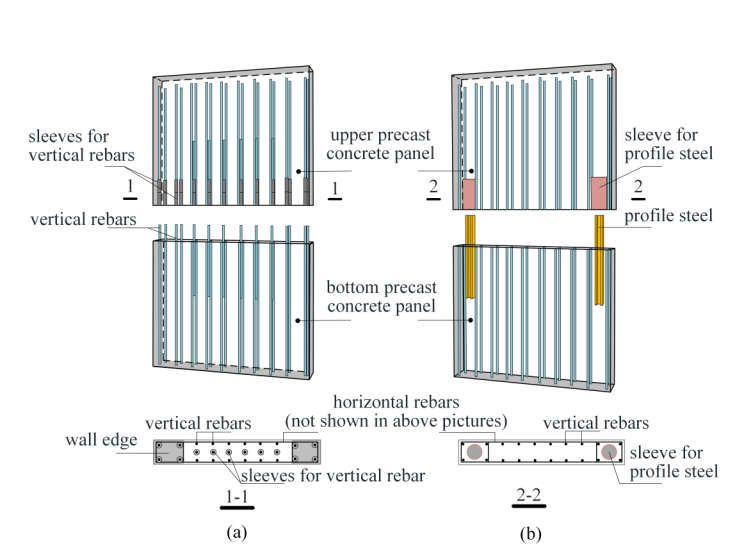
Materials 2020, 13, 2037                                                                                      2 of 21

performance of the splices were proved to be the embedded length of the rebar, sleeve configuration
and grout strength. Test results also have indicated that the ultimate strengths and deformability of
the splices is slightly lower than those of the connected rebars, respectively. The grout-filled sleeve
provides radial confinement to enhance the bond through interaction among the sleeve, grout and
rebars, resulting in a transfer of tensile or compressive force between the two discontinued rebars.
For the grouted duct connection, non-contact lap splices are used for rebars [14−16]. The rebars
protruding from one precast component are grouted into corrugated steel ducts encased in the other
one. When using these connections in precast columns, two smaller-diameter rebars, adjacent to each
duct, are usually present [16].
     Grouted sleeve splices are often used in precast concrete shear walls due to efficient construction
and economic reasons. A typical example of using grouted sleeve splices to connect an upper and
bottom precast concrete panel at a construction site is illustrated in Figure 2a. Vertical rebars protrude
from the bottom fixed panel. The upper movable panel contains the embedded sleeves at the same
location as the rebars, and then adjusts to an appropriate location so that the rebars in the bottom
panel can be accurately inserted into the sleeves. Afterwards, the upper panel is temporarily fixed,
and grout is poured into the sleeves. Eventually, the upper and bottom panels will vertically connect
to form a horizontal joint after the grout hardens.

      Figure 1. A cross section of a grouted sleeve splice of typical configuration to connect reinforcing steel
      bars.

     However, a trouble occasionally occurs in construction site when inserting a row of rebars into
the sleeves due to limited construction tolerance [7]. For reasonable transfer of force, the sleeve
diameter is designed slightly larger (e.g., a few millimeters) than the matched rebar diameter.
Currently in China, precast concrete shear walls have their lengths commonly ranging from 3 to 4 m,
with the rebars arranged in a single row and a rebar number of at least six (excluding the rebars
embedded in the wall edges as illustrated in Figure 2a) after optimization. In fact, assembly accuracy
can be affected by many factors, including manufacturing error and possible rebar collision between
different components during the transportation process. Consequently, many efforts are made to
correct the defective rebar at the construction site, resulting in a potential safety risk and reduction
of assembly efficiency [17,18].
     A novel alternative to mitigate this problem is proposed in this study [19]. The basic idea is to
change the vertical rebar connection mode from the conventional “distribution along the wall” to
“concentration in the wall edges.” As illustrated in Figure 2b, sleeves and steel profiles are embedded
in the upper and bottom panels, respectively, and are connected by pouring grout. In Figure 2b, the
grout also fills the horizontal joint between the two panels as is the case in conventional precast
concrete shear walls using grouted sleeve splices for rebars. The cross sectional area of the steel profile
can be determined based on the principle of “equivalent bearing capacity.” In other words, the
bearing capacity of a conventional precast concrete shear wall and the proposed one should be
approximately equivalent in terms of bending and direct shear resistances. Conceptually, the
proposed precast concrete shear wall has the advantages of reasonable structural form to resist
bending moment and direct shear, high defect tolerance, and efficient assembly.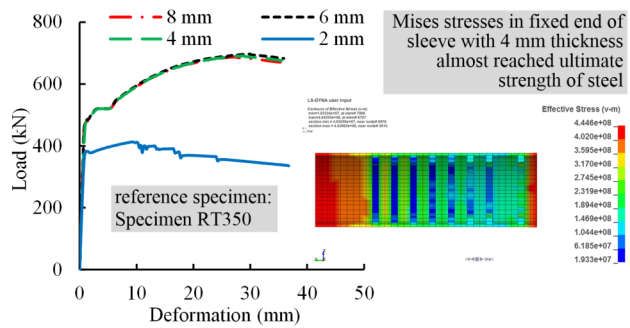
Materials 2020, 13, 2037                                                                                   3 of 21

      Figure 2. Precast concrete shear walls with (a) splices to connect vertical rebars; and (b) splices for
      steel profiles.

     The structural performance of the novel precast concrete shear wall should be comprehensively
investigated. As a pilot research, this study aimed to investigate the behavior of the grouted sleeve
splice for the steel profile (to be referred to as splice from this point forward) under different tensile
loadings by means of experimental and numerical studies. The tensile loadings contained four
loading schemes, i.e., monotonic tensile loadings (MT), repeated tensile loading (RT), cyclic loading
at high stress (HS), and cyclic loading at large strain (LS). The last three loading schemes involve a
splice under service loads, winds and frequent earthquakes, and rare earthquakes, respectively. After
that, finite element method (FEM)-based models were built, validated, and used to perform
parametric studies to provide further understanding as to how the critical parameters affect the
tensile behavior of the splices.

2. Experimental Program

2.1. Specimens
     The prototype of a concrete shear wall is cast-in-place with a thickness of 200 mm and a length
of 3200 mm including two 400-mm-long wall edges. The wall was seismically designed and typically
reinforced in accordance with Chinese code GB50011 [20]. That is, the wall body, excluding wall
edges, has a vertical reinforcement ratio of 0.25% for distributed reinforcing steel bars, and each wall
edge was vertically reinforced with six 12-mm-diameter rebars. The bending bearing capacity of the
prototype wall is 4752 kN·m with a compressive strength of concrete of 26.8 MPa, nominal strength
of the reinforcing steel bars of 360 MPa and an axial compression ratio of 0.15. For the novel precast
concrete shear wall with identical geometry to the prototype wall, the cross sectional area of each
steel profile was calculated to be about 1280 mm2, based on the “equivalent bearing capacity”
principle of bending moment, which takes into consideration the nominal strength of the steel profile
of 345 MPa. An H-type cross section was used for the steel profile.
     Table 1 presents the details of the splice specimens divided into two test groups, which were
fabricated at different times. In the first test group of four splices, steel profiles were embedded in
the grout with different embedded lengths L (i.e., L = 500, 400, 300, and 200 mm) to investigate the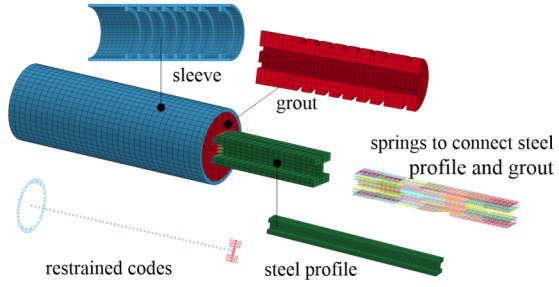
Materials 2020, 13, 2037                                                                         4 of 21

anchorage length of the steel profile. The specimens were statically tested under monotonic tensile
loading. After completing the tests in the first group, three splices in the second test group with a
conservative anchorage length of steel profile (i.e., 350 mm) were loaded under different loading
schemes, as presented in Section 2.3.

                                       Table 1. Specimen details.

                Cross Section     Cross      Embedded      Number of Number
Group Specimen                                                                 Loading
               of Steel Profile Section of Length of Steel Steel Ring of Steel
 No.     No.                                                                   Scheme
                    (mm)       Sleeve (mm) Profile, L (mm)    ribs     Studs
  1    MT500 I46 × 46 × 12 × 8 Φ121 × 6          500           10        8       MT
       MT400                                     400           10        6       MT
       MT300                                     300            8        4       MT
       MT200                                     200            4        2       MT
  2    RT350 I46 × 46 × 12 × 8 Φ121 × 6          350            8        6       RT
       HS350                                     350            8        6       HS
        LS350                                    350            8        6       LS

     Figure 3 illustrates the geometry and configuration of the specimens. Sleeves were designed with
the intent to provide (1) easy manufacturing, (2) avoidance of sleeve fracture under loading due to a
weak cross section of the sleeve, and (3) avoidance of grout pull-out from the sleeve under loading
due to grout-sleeve bond failure. To achieve this, common seamless steel pipes were used to produce
the sleeves. The adopted steel pipes had an outer diameter of 121 mm and a wall thickness of 6 mm.
Steel studs of 8 mm diameter and 15 mm length were welded on the surface of the steel profile, and
10-mm-diameter steel ring ribs were welded into the inner surface of the sleeves to enhance the grout-
sleeve bond performance. In addition, for each specimen, a thin steel plate was welded near one of
the sleeve ends to form a closed end. Small steel strips were welded on the inner surface of the plate
to appropriately position the steel profile. When assembling, the steel profile was first inserted into
the sleeve and appropriately positioned before the grout was directly poured into the sleeve. All
specimens were cured outdoors until testing.

                           Figure 3. Geometry and configuration of specimens.

2.2. Materials
     Table 2 and Figure 4 present the material properties and stress-strain curves for the steel profile
and sleeve steel, respectively [21]. Table 3 presents the compressive strength and flexural strength of
the grout which were tested on prism specimens (40 × 40 × 160 mm3) in accordance with JG/T408-
2013 [22]. All data in the tables represent the mean values resulting from three material specimens.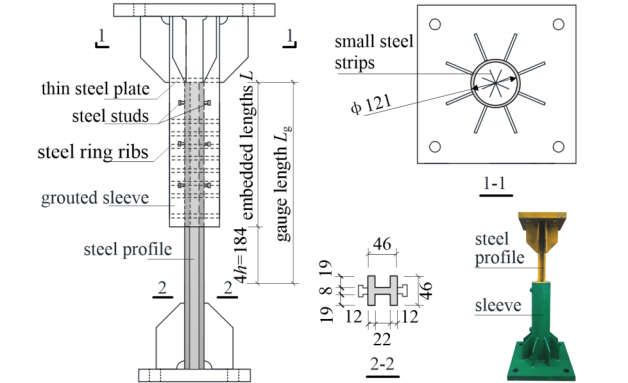
Materials 2020, 13, 2037                                                                                            5 of 21

The high-strength grout used in the study was provided by Shanghai Livable Building Science &
Technology Co., Ltd. The ready-to-mix grout was mixed using a water-to-grout ratio of 0.13 (32.5 L
of water: 25 kg of grout) following the operation instructions provided by the manufacturer. The
grout was fully mixed to form a well homogenous mixture before pouring.

                               Table 2. Material properties for steel profile and sleeve steel [21].

                                      Yield           Ultimate        Elasticity
                    Group                                                            Yield Strain      Ultimate Strain
   Material                          Strength         Strength        Modulus
                     No.                                                                 (%)                (%)
                                      (MPa)            (MPa)            (GPa)
 Steel profile             1           437.4            580.0            215             0.203               16.6
                           2           410.0            543.7            222             0.185               14.5
    Steel for              1           420.7            624.0            227             0.185               14.5
    sleeves                2           445.2            599.7            229             0.194               13.2

                                          Table 3. Material properties for grout [22].

  Group       Compressive Strength Flexural Strength                      Elasticity Modulus           Tensile Strength
   No.              (MPa)               (MPa)                                 (×104 MPa)                    (MPa)
    1                68.0                12.7                                       -                          -
    2                95.8                17.4                                     3.89                       7.44
             Note: Elasticity modulus and tensile strength of the grout in group 1 were not measured.

         Figure 4. Stress-strain curves of steel profile and sleeve steel in the first and second test groups.

2.3. Test Setup and Instrumentation
      Figure 5 illustrates test setup using a 2000 kN servo-hydraulic actuator. The loading was
statically applied and the forces were automatically recorded by a data acquisition installed in the
actuator. Table 4 presents the loading procedures for loading schemes of monotonic tensile loading
(MT) for the specimens in the first test group, and repeated tensile loading (RT), cyclic loading at high
stress (HS), and cyclic loading at large strain (LS) for the specimens in the second test group. These
loading schemes were in conformity with the Chinese code JGJ355-2015 [23] and similar to the
international acceptance criteria AC133 [24]. As mentioned in Section 1, the last three loading schemes,
i.e., RT, HS, and LS, relate to a splice under service loads, winds and frequent earthquakes, and rare
earthquakes, respectively, as discussed in [10].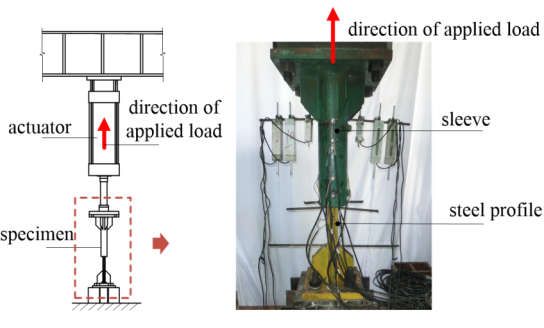
Materials 2020, 13, 2037                                                                                       6 of 21

                           Table 4. Loading procedures for different loading schemes.

    Loading Scheme                                             Loading Procedure
   Monotonic tensile           0          ultimate load       measuring elongation at ultimate load, usgt
  loading (applied for
   Specimens MT500,
  MT400, MT300 and
        MT200)

Repeated tensile loading       0          0.6Fym*   0       0.6Fym        0   0.6Fym           ultimate load
 (applied for Specimen         measuring elongation at ultimate load, usgt
        RT350)
                                          Pu

                                       0.6Fym
                                                                                       Cycle

 Cyclic loading at high        0    (0.9Fym     −0.5Fym)...(0.9Fym    −0.5Fym)      ultimate load
  stress (applied for          measuring elongation at ultimate load after reversing 20 times, u20
  Specimen HS350)                        Pu
                                      0.9Fym
                                                                    ...
                               Load

                                      0.5Fym                                       Cycle
                                                    One time
                                                         20 times

    Cyclic loading at     0 (2εym* −0.5Fym)…(2εym −0.5Fym) (5εym −0.5Fym)…(5εym −0.5Fym)
large strain (applied for    ultimate load
    Specimen LS350)       measuring residual deformation after reversing four times, u4
                           and measuring residual deformation after reversing another four times, u8

     * Note: Fym and εym denote force corresponding to yield strength and yield strain of steel profile,
respectively.

     Figure 6 illustrates the arrangement of displacement transducers and strain gauges for Specimen
RT350 as an example. The splice deformations within gauge length Lg (where Lg = L + 4 h, L and h =
46 mm denote an embedded length of the steel profile and cross sectional height of the steel profile,
respectively) could be obtained using the mean value of the deformations measured using
displacement transducers D1 and D4. As a result, the relative elongation at ultimate loads, δsgt, is
calculated by dividing the elongations at ultimate loads usgt by Lg using Equation (1):

                                                          =                                                    (1)

     The sleeve deformation could be gained using the mean value of the deformations measured
using displacement transducers D3 and D6. The relative deformations between the steel profile and
grout due to the slip at the opening end of each sleeve could be calculated as the difference between
sleeve deformation and the mean value of the deformations measured using displacement
transducers D2 and D5. In addition, strain gauges were glued on the surfaces of the steel profile and
sleeves to monitor their strain development and distribution.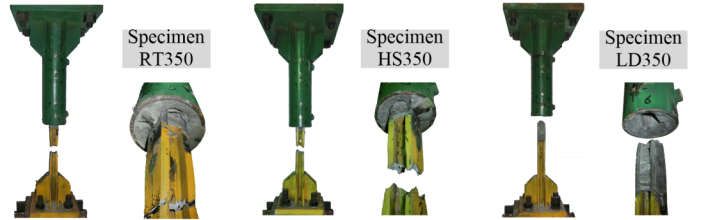
Materials 2020, 13, 2037                                                                             7 of 21

                                            Figure 5. Test setup.

           Figure 6. Arrangement of displacement transducers and strain gauges for Specimen RT350.

3. Test Results

3.1. The First Test Group
      Two failure modes were observed and illustrated in Figure 7, i.e., steel profile fracture for
Specimens MT500, MT400 and MT300, as well as steel profile pull-out for Specimen MT200.
      Figure 8 presents the load-deformation curves for Specimens MT500, MT400, and MT300, which
can be identified by separating into three parts, i.e., pre-yield, yield, and post-yield parts. Before
yielding, the specimens deformed slightly. Then, circular cracks occurred in the grout located in the
opening end of the sleeves when the specimens approached yielding. After yielding, the grout at this
location gradually dropped off and, finally, steel profiles fractured at ultimate loads. However, for
Specimen MT200, the load–deformation curve oscillates after ultimate load as a result of repeated
failure and compaction of local grout clung to studs. That is, the local grout could partially recover
the resistance instantly after failure and compaction.
      Table 5 presents the primary results of the specimens in the first test group. It was found that
the average yield strengths and average ultimate strengths of Specimens MT500, MT400, and MT300
increased about 6% and 2% compared to those of the steel profile, respectively. This can possibly be
attributed to the presence of weld seams, which enhanced the tensile resistance of the steel profile.
However, the relative elongations at ultimate loads were significantly less than those of the steel
profile, i.e., approximately 5.2% vs. 16.6%. This is a common observation for the grouted splices of
reinforcing steel bars [6,10,23] and is mainly due to the weak deformation capacity of the sleeve
region, which is further discussed in Section 3.2.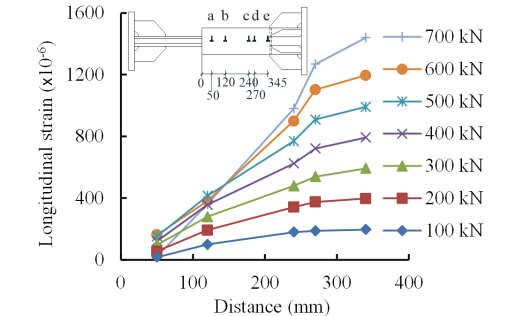
Materials 2020, 13, 2037                                                                               8 of 21

     Based on these results, the anchorage length related to the failure mode of steel profile fracture
was between 200 and 300 mm for the used splices in the first test group. However, an anchorage
length of the steel profile was conservatively taken as 350 mm in the second test group, considering
the possible variation of the geometry, materials, and construction quality.

      Figure 7. Failure mode of steel profile fracture for Specimens MT500, MT400 and MT300, as well as
      steel profile pull-out for Specimen MT200.

              Figure 8. Load-deformation curves for Specimens MT500, MT400, MT300, and MT 200.

                           Table 5. Primary results for specimens in the first test group.

        Measured Cross                                                                Relative      Failure
                          Yield             Yield   Ultimate Ultimate
Specimen Sectional Area                                                           Elongations at    Mode of
                          Loads            Strength  Loads   Strength
  No.    of Steel Profile                                                         Ultimate Loads,     Steel
                          (kN)              (MPa)     (kN)    (MPa)
              (mm2)                                                                    δsgt (%)      Profile
 MT500         1328        610                 460         783          589              3.8        Fracture
 MT400         1328        616                 464         791          596              3.4        Fracture
 MT300         1304        600                 460         772          592              5.2        Fracture
 MT200         1280        602                 470         658          514              2.2        Pull-out

3.2 The Second Test Group
     The failure mode of steel profile fracture was observed and is illustrated in Figure 9 for Specimens
RT350, HS350 and LD350.
     Figure 10 and Table 6 present the load-deformation curves and primary results of these specimens,
respectively. The observations during testing were similar to those of Specimens MT500, MT400, and
MT300. Therefore, they are not presented for brevity. In general, results found that (1) the load-
deformation curves can be identified as three parts, i.e., pre-yield, yield and post-yield parts; (2) the
curve skeletons, ultimate strengths and relative elongations at ultimate loads of the three specimens
were similar to each other. Similar results were also found in tests of grouted splices for reinforcing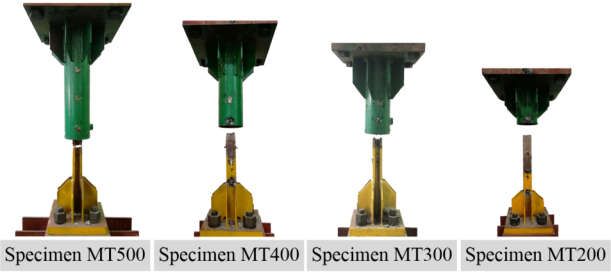
Materials 2020, 13, 2037                                                                                   9 of 21

steel bars [10]; (3) residual deformations were minor, i.e., usgt = 0.165 mm for Specimen RT350, u20 = 0.185
mm for Specimen HS350, u4 = 0.285 mm and u8 = 0.410 mm for Specimen LD350; and (4) pinching effect
was hard to identify for Specimens HS350 and LD350, which meant the slip between the steel profile
and grout was insignificant.

              Figure 9. Failure mode of steel profile fracture for Specimens RT350, HS350 and LD350.

                           Table 6. Primary results for specimens in the second test group.

         Measured Cross                                                             Relative           Failure
                                    Yield Yield Ultimate Ultimate
Specimen Sectional Area of                                                      Elongations at         Mode of
                                    Loads Strength Loads Strength
  No.      Steel Profile                                                        Ultimate Loads,          Steel
                                    (kN) (MPa)      (kN)  (MPa)
               (mm2)                                                                δsgt (%)            Profile
 RT350          1237                  531      430         708        572             6.1              Fracture
 HS350          1311                  540      412         721        550             6.2              Fracture
 LD350          1240                  546      440         718        580             6.6              Fracture

     In addition, responses of the specimens were investigated in terms of load-slip curves, strain
development of the steel profiles, strain development of the sleeves, and deformation contributions
for the specimens at ultimate loads. First, the slips between the steel profiles and sleeves for
Specimens RT350, HS350, and LD350 at ultimate loads were 16.8, 16.4, and 22.6 mm, respectively.
These slips were observed to contribute mainly by the slips between the steel profiles and grout,
while the slips between grout and the sleeves were minor. The slip of Specimen LD350 was about 35%
larger than those of Specimens RT350 and HS350 because the loading scheme of large deformation
leads to slip increase. Second, the strain developments of the steel profiles revealed that the steel
profiles were uniformly tensioned to failure and an eccentric loading was not observed. Third, sleeve
strains of the three specimens were similar to each other and dominantly developed in the
longitudinal direction illustrated in Figure 11 for Specimen RT350 as an example. Figure 11 shows
that the sleeve behaved elastically and the maximum strain appeared in the closed end of the sleeve.
In fact, sleeve deformation was a combination of three responses, i.e., longitudinal elongation,
circumferential contraction due to the Poisson effect, and radial expansion after grout cracking [9,11].
Finally, Figure 12 compares the deformation contribution of Specimen RT350 at ultimate load. The
relative elongation within gauge length is contributed by three parts, i.e., (1) the steel profile, (2) the
slip between the steel profile and grout, and (3) the integral body of “sleeve + grout” segment
including the slip between them. It was found that the deformation capacity of splices was
contributed mainly by parts (1) and (2), and the contribution provided by part (3) was minor.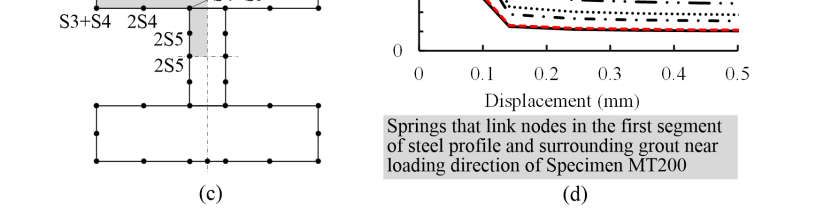
Materials 2020, 13, 2037                                                                          10 of 21

                Figure 10. Load-splice deformation curves for Specimens RT350, HS350 and LD350.

                           Figure 11. Longitudinal strains of sleeve for Specimen RT350.
Materials 2020, 13, 2037 11 of 21
Figure 12. Comparison of deformation contribution within gauge length of Specimen RT350 at
ultimate load.
4. Numerical Studies
The purpose of this section was to further understand the behavior of the grouted sleeve splices
for steel profile under tensile loadings and to optimize the geometrical configuration of the splices.
Finite element method (FEM)-based models were built using Ansys/Ls-Dyna software [25] to conduct
parametric studies.
4.1. FEM Models
FEM models were built with consideration of element types, material models, contact definition,
and boundary condition. First, the eight-node solid element, Solid65, was used for the grout, steel
profiles, and sleeves. One center integral point in solid elements with high computational efficiency
was adopted, however, associated with undesired zero energy modes (hourglass modes). To
eliminate these modes, a stiffness based hourglass control method (IHQ = 4) was used. Second, the
Karagozian & Case (K&C) concrete model was adopted for modeling the concrete without
consideration of strain rate effect. This material model was used by researchers to simulate the
behavior of concrete under quasi-static loading with consideration of the confining effect under
hydrostatic pressures [26,27]. Figure 13a illustrates the stress-strain relationship of the grout under
uniaxial loading in the first and second test groups. Steel profile was modeled using the Cowper
symbols model (*MAT_PIECEWISE_LINEAR_PLASTICITY) without consideration of strain rate
effect. Steel profile failed when its axial ultimate strength was reached. Figure 13b illustrates the
stress-strain relationship of steel profiles under axial tension for the specimens in the first and second
test groups. For the steel sleeves, an elastic, perfectly plastic model with uniform material parameters
was adopted because (1) the material properties of the sleeves used in the first and second test groups
were almost identical to each other; and (2) steel sleeves did not reach yielding in tests. Figure 13c
illustrates the stress–strain relationship of steel under axial tension for sleeves in elastic and plastic
stages. Third, the contact between the steel profile and grout was simulated using the penalty
function method (*CONTACT_AUTOMATIC_SURFACE_TO_SUR-FACE)with default parameters
in software Ls-dyna to implement appropriate bond behavior. Finally, boundary condition was
achieved by (1) restraining all degrees of freedom of the nodes in the closed end of the sleeves; (2) for
the nodes in the longitudinal axis of the steel profiles, restraining their translational degrees of
freedom in two directions other than in the loading direction; (3) for the nodes in the loading end of
the steel profiles, restraining their translational and rotational degrees of freedom in two directions
other than in the loading direction; and (4) applying displacement on the nodes of the steel profiles
in the loading end along its longitudinal axis.Materials 2020, 13, 2037 12 of 21
Figure 13. Material models for (a) grout; (b) steel profiles; and (c) sleeves.
Two difficulties arose in the modeling. One was the simulation of the bond stress-slip
relationship between the steel profile and grout. The other was the modeling of the shear force-slip
relationship between the studs and surrounding grout. For the sleeves and grout, almost no slip was
observed between them; therefore, a perfect bond was adopted. To resolve the first difficulty, it is
believed that the bond action along the loading direction is dominant compared to that in the other
two directions (i.e., circumferential and radial directions). Studies reveal that the bond behavior
between the steel profile and concrete is affected by many factors including the thickness of concrete
cover, transverse reinforcement ratio, anchorage length of steel profile, and concrete strength [28]. In
particular, the bond stress-slip relationship depends on the location and position of the steel profile,
which means the distance to the loading end of the steel profile, and flanges / web of steel profile,
respectively. However, bond behavior between steel profile and grout is not available in the literature
to the best of the authors’ knowledge. Thus, the bond stress–slip relationship between steel profile
and concrete proposed by Yang [29] using push-out tests was adopted for that of steel profile and
grout. As usual, the bond stress–slip relationship was implemented using spring elements in the
software. To do this, two steps were adopted. In the first step, an imbedded steel profile was divided
into certain number of segments along the loading direction. In this study the segment length was
uniformly taken as 50 mm, as schematically presented in Figure 14b. For each segment, the force–
deformation relationship for spring elements is expressed as Equation (2):
= ( )× (2)
where F denotes spring force, τ means bond stress which depends on the slip between steel profile
and grout, s, and Ai represents subordinate area of node i, and is illustrated in Figure 14a. As a result,
for a specific segment of steel profile, five types of springs (i.e., S1~S5) were generated on the surface
of steel profile according to Equation (2) and indicated in Figure 14c in a quarter of the cross section
of steel profile. As an example, Figure 14d depicts the force-deformation relationship of five springs
linking the nodes in the first segment of steel profile and the surrounding grout near the opening end
of Specimen MT200. Actually, the sharp of these curves were a little bit similar to the curve sharp of
the well-known bond stress-slip relationship between deformed bar and concrete. These springs were
modeled using a nonlinear spring model (*MAT_SPRING_GENERAL_NONLINEAR) provided by
the software. In the second step, different segment resulted in different groups of five springs, which
were used in the FEM models of the splices.
For the second difficulty, the often used shear force-slip relationship for studs and concrete
proposed by Ollgaard [30] was adopted for that of the studs and grout, and is expressed in Equations
(3) and (4):
. .
P/ , = (1 − ) (3)
, = 0.5 ≤ (4)Materials 2020, 13, 2037 13 of 21
where P and s denote shear force and slip, respectively; Pu,st refers to the ultimate shear resistance of
studs; As and fu are the cross sectional area of studs and the ultimate strength of the steel used for
studs, respectively; Ec and fc represent elasticity modulus and compressive strength of grout,
respectively. Evidently, the curve of Equations (3) and (4) depend on the ultimate slip, which widely
varies in the literature, e.g., 5.08 mm [30], 1.25 mm [31], and more than 10 mm [32]. In this study, the
ultimate slip was taken as 9 mm. Figure 15 compares the shear force-slip curves for studs used in this
study and that proposed in [30], resulting in minor difference. Consequently, nonlinear spring
elements were used to describe the shear force–slip behavior in FEM models. Finally, Figure 16
illustrates the FEM model built for Specimen RT350 as an example, including 15,454 elements and
1,002,804 nodes.
Figure 14. Implementation of bond stress-slip relationship for steel profile and grout in FEM models:
(a) computation of Ai; (b) segments of steel profile along the loading direction; (c) springs Sl~S5; and
(d) force-displacement relationship of springs Sl~S5.Materials 2020, 13, 2037 14 of 21
Figure 15. Shear force-slip curves for studs used in this study and proposed by Ollgaard [30].
Figure 16. FEM model for Specimen RT350.
4.2. Model Verification
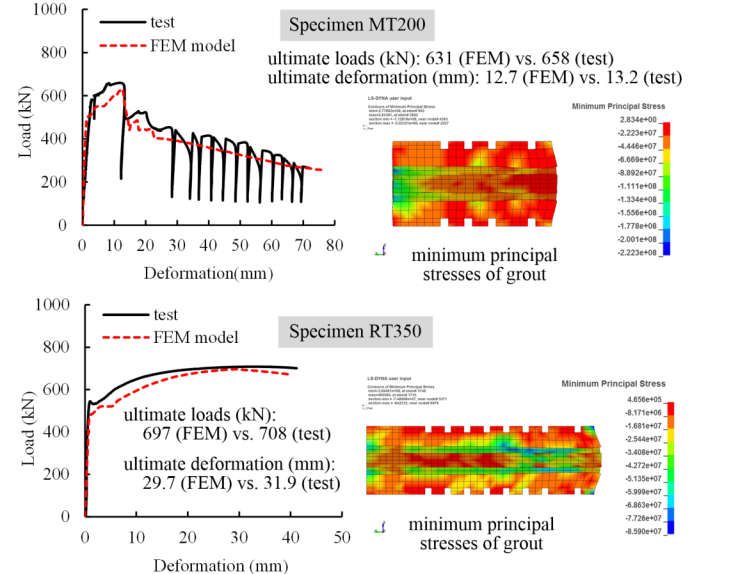
Numerical results were verified against test results using Specimens MT200 and RT350 because
they represented two typical failure modes, i.e., fracture and pull-out of steel profile, respectively. In
computation, both specimens were monotonically loaded, resulting in identical failure modes to
those observed in tests. Figure 17 compares the load-deformation curves of Specimens MT200 and
RT350 using FEM models and test data, and proper agreement was achieved for Specimens RT350.
However, for Specimen MT200 the curve profile in test was properly depicted and a fluctuation of
the curve in test was not simulated. This is because the FEM model could not well capture the
repeated failure and compaction of local grout clung to studs that actually occurred in test. In addition,
minimum principal stresses illustrated in Figure 17 were far more than the compressive strengths of
grout under uniaxial loading, indicating appropriate simulation of the confining effect of grout
caused by the sleeves. Finally, close results using FEM models and in tests were obtained in terms of
strain development of the steel profiles, strain development of the sleeves, and deformation
contributions for the specimens at ultimate loads. These results are not presented for brevity. Thus,
the FEM models are reliable and can be used to perform parametric studies.Materials 2020, 13, 2037 15 of 21
Figure 17. Load-deformation curves of Specimens MT200 and RT350 using FEM models and test data.
4.3. Parametric Studies
Splice behavior was influenced by a quantity of parameters including sleeve thickness, grout
strength, offset of steel profile, and misalignment of steel profile. Table 7 presents the designed
specimens for parametric studies using FEM models. In each case of parametric studies, a reference
specimen was selected. Only the value of one parameter of the reference specimen varied, while the
others remained unchanged. All specimens were monotonically loaded to failure.
Table 7. Designed specimens for parametric studies using FEM models.
Ultimate
Reference Value for Yield Load Ultimate Load Defor- δsgt
Parameter Failure Mode
Specimen Parameter (kN) (kN) mation (%)
(mm)
Sleeve Specimen 2 mm sleeve fracture - 413 9.2 1.7
thickness RT350 4 mm steel profile 520 697 28.7 5.4
fracture
6 mm steel profile 520 697 29.7 5.6
fracture
8 mm steel profile 520 697 29.7 5.6
fracture
Grout Specimen 20 MPa steel profile - 503 2.5 0.5
strength RT350 pull-out
40 MPa steel profile 520 687 28.9 5.4
fracture
60 MPa steel profile 520 683 26.9 5.0
fracture
80 MPa steel profile 520 787 26.0 4.9
fractureMaterials 2020, 13, 2037 16 of 21
96 MPa steel profile 520 697 29.7 5.6
fracture
Offset Specimen 0 mm steel profile 520 697 29.7 5.6
RT350 fracture
4 mm steel profile 520 697 30.5 5.7
fracture
8 mm steel profile 520 697 30.3 5.6
fracture
Mis- Specimen 0 rad steel profile 520 697 29.7 5.6
alignment RT350 fracture
0.008 rad steel profile 520 683 29.0 5.4
fracture
0.016 rad steel profile 520 678 27.0 5.1
fracture
0.040 rad steel profile 520 633 14.7 2.8
fracture
0.162 rad steel profile 520 539 5.7 1.1
fracture
0.324 rad steel profile 520 521 3.5 0.7
fracture
4.3.1. Sleeve Thickness
Previous studies revealed that increasing sleeve thickness leads to enhance the confining effect
in the radial direction, and further increases the bond action between steel profile and grout [33]. In
the tests, the sleeve thickness was conservatively taken as 8 mm for all specimens. In parametric study,
Specimens RT350 was taken as reference specimen and sleeve thickness was individually set to 2, 4,
6, and 8 mm. Figure 18 illustrates load-deformation curves for these specimens and critical results are
presented in Table 7. Results found that, (1) the failure mode of the specimen with sleeve thickness
of 2 mm was sleeve fracture; (2) the failure mode of specimens with sleeve thicknesses of 4, 6, or 8
mm was steel profile fracture, and their ultimate loads almost remained unchanged; and (3) the stress
in the fixed end of the sleeve with 4 mm thickness almost reached the ultimate strength of steel, and
the splice was at the risk of failure. However, splices with sleeves of 6 and 8 mm thicknesses behaved
elastically. As a result, the proper sleeve thickness for the splice in this case was recommended to
range from 4 to 6 mm.
Figure 18. Load-deformation curves for specimens with different sleeve thicknesses using FEM
models.
4.3.2. Grout StrengthMaterials 2020, 13, 2037 17 of 21
Grout strength affects the failure mode of splices, which can be demonstrated by investigating
the responses of splices with different grout strengths under loading. For reference specimen RT350,
the compressive strengths of the grout were individually taken as 96, 80, 60, 40, and 20 MPa. The
currently used grout in construction in China commonly ranged from 80 to 95 MPa [23]. Figure 19
illustrates the load-deformation curves for these specimens, and the critical results are presented in
Table 7. It was revealed that the splice failed due to steel profile pull-out when the compressive
strength of 20 MPa was used for the grout, resulting in a fairly low ultimate resistance. However, the
failure mode of steel profile fracture occurred when the splices’ grout had a compressive strength of
more than 40 MPa. In these cases, their ultimate loads and ultimate deformations were close to each
other. This implied that increasing compressive strengths of the grout had little effect on the splice
performance if the compressive strength threshold was exceeded.
Figure 19. Load-deformation curves for specimens with different grout strengths using FEM models.
4.3.3. Offset
Offset and misalignment occasionally occurred during splice manufacturing and at the
construction site. For reference specimen RT350, Figure 20 illustrates the steel profile moving along
the x axis (strong axis) and offsetting from the z axis (weak axis) by 4 and 8 mm, i.e., 0.324 and 0.648
times the radius of gyration with respect to the z axis. Critical results are presented in Table 7. Results
indicated that the ultimate loads and ultimate deformation were almost unaffected by offset in these
cases. Similar results were also observed in [12] using grouted sleeves for splicing rebars.
Figure 20. Offset of profile steel from the z axis.
4.3.4. MisalignmentMaterials 2020, 13, 2037 18 of 21
Figure 21 illustrates the misalignment of steel profile in reference Specimen RT350. The eccentric
angles were set to 0.00014, 0.00029, 0.00072, 0.00288, and 0.00576 rad, resulting in load eccentricities
at the steel profile end of 0.1, 0.2, 0.5, 2, and 4 mm, which were 0.008, 0.016, 0.040, 0.162, and 0.324
times the radius of gyration with respect to the z axis, respectively. The eccentricity of loading was
approximately equivalent to the combined action of a tensile force and a moment imposed at the steel
profile end. Figure 21 illustrates load–deformation curves for these specimens and critical results are
presented in Table 7. It was revealed that the misalignment had a pronounced effect on splice
behavior. The ultimate load and ultimate deformation decreased as the misalignment increased,
although the elastic behavior of these specimens kept almost unchanged. This was attributed to a
non-uniform stress distribution along the cross section of the steel profile, which led to the premature
fracture of splices [10].
Figure 21. (a) Misalignment of steel profile; (b) load-deformation curves for specimen with different
load eccentricities using FEM models; and (c) elastic parts of these curves.
5. Conclusions
Seven grouted sleeve splices for the steel profile were designed and tested under various loading
schemes of MT, RT, HS, and LS to investigate their tensile behavior. Parametric studies using FEM
models were performed to understand the influence of sleeve thickness, grout strength, offset of steel
profile, and misalignment of steel profile on splice behavior. Based on the experimental and
numerical results, the following conclusions can be drawn:
(1) Splices with an appropriate anchorage length of the steel profile behaved well under
loading schemes of RT, HS, and LS. The skeletons of the load-deformation curves, ultimate strengths
and relative elongations at ultimate loads were similar to each other. Minor residential deformation
and almost no pinching effect were observed.
(2) Proper sleeve thickness could be determined using the numerical approach to optimize the
configuration of splices.Materials 2020, 13, 2037 19 of 21
(3) Splice performance was insignificantly affected by the offset of the steel profile and the
compressive strengths of grout that exceeded the threshold value. However, splice behavior was
significantly affected by the misalignment of the steel profile.
Based on the limited test data and numerical results in this study, grouted sleeve splices for the
steel profile presented appropriate performance with potential application in the proposed precast
reinforced concrete shear wall structures. However, further research is needed to investigate the
tensile behavior of the splices with a variety of parameters comparable to those in practice. In addition,
subsequent studies on the structures are ongoing by the authors to identify their direct shear and
seismic performance.
Author Contributions: Conceptualization, methodology, writing, project administration and funding
acquisition, F.L.; experiment designing, experiment performing and numerical simulations, P.Z. Both authors
have read and agreed to the published version of the manuscript.
Funding: This research was funded by the Science and Technology Committee of the Shanghai Municipality
(Grant No. 17DZ1203200) and the National Key R&D Program of China (Grant No. 2017YFC1500704).
Conflicts of Interest: The authors declare no conflict of interest.
Nomenclature:
Nomenclature
Ai Subordinate area of node i of steel profile Pu,stUltimate shear resistance of studs
As Cross sectional area of studs RT Repeated tensile loading
Ec Elasticity modulus of grout s Slip between steel profile and grout
F Spring force u4 Residual deformation after reversing four times of a LS-
fc Compressive strength of grout series splice
Residual deformation after reversing eight times of a LS-
fu Ultimate strength of the steel used for studs u8
series splice
Force corresponding to yield strength of Elongation at ultimate load after reversing 20 times of a
Fym u20
steel profile HS-series splice
h Cross sectional height of steel profile
usgt Elongations at ultimate loads within gauge length
HS Cyclic loading at high stress
MTMonotonic tensile loading
δsgt Relative elongation at ultimate loads within gauge length
L Embedded length of steel profile
Lg Gauge length of specimens εym Yield strain of steel profile
LS Cyclic loading at large strain
τ Bond stress due to slip between steel profile and grout
P Shear force of studs
Pu Ultimate shear resistance of specimens
References
1. Yahya, C.K.; Sri, S.; Robert, B.F.; Jose, I.R. Seismic-resistant precast concrete structures: State of the art. J.
Struct. Eng. 2018, 144, 3118001.
2. Elliott, K.S. Precast Concrete Structures; CRC Press: Boca Raton, FL, USA, 2017.
3. Arditi, D.; Ergin, U.; Günhan, S. Factors affecting the use of precast concrete systems. J. Archit. Eng. 2000,
6, 79–86.
4. Ameli, M.J.; Brown, D.N.; Parks, J.E.; Pantelides, C.P. Seismic column-to-footing connections using grouted
splice sleeves. ACI Struct. J. 2016, 113, 1021–1030.
5. Einea, A.; Yamane, T.; Tadros, M.K. Grout-filled pipe splices for precast concrete construction. PCI J. 1995,
40, 82–93.
6. Ling, J.H.; Rahman, A.B.A.; Ibrahim, I.S. Feasibility study of grouted splice connector under tensile load.
Constr. Build. Mater. 2014, 50, 530–539.
7. Henin, E.; Morcous, G. Non-proprietary bar splice sleeve for precast concrete construction. Eng. Struct.
2015, 83, 154–162.
8. Ling, J.H.; Rahman, A.B.A.; Ibrahim, I.S.; Hamid, Z.A. Tensile capacity of grouted splice sleeves. Eng. Struct.
2015, 111, 285–296.Materials 2020, 13, 2037 20 of 21
9. Hosseini, S.J.A.; Rahman, A.B.A.; Osman, M.H.; Saim, A.; Adnan, A. Bond behavior of spirally confined
splice of deformed bars in grout. Constr. Build. Mater. 2015, 80, 180–194.
10. Lin, F.; Wu, X.B. Mechanical performance and stress-strain relationships for grouted splices under tensile
and cyclic loadings. Int. J. Concr. Struct. Mater. 2016, 10, 435–450.
11. Zheng, Y.F.; Guo, Z.X.; Liu, J.B.; Chen, X.N.; Xiao, Q.D. Performance and confining mechanism of grouted
deformed pipe splice under tensile load. Adv. Struct. Eng. 2016, 19, 86–103.
12. Huang, Y.; Zhu, Z.G.; Naito, C.J.; Yi, W.J. Tensile behavior of half grouted sleeve connections: Experimental
study and analytical modeling. Constr. Build. Mater. 2017, 152, 96–104.
13. Kuang, Z.P.; Zheng, G.Y. Computational and experimental mechanical modelling of a composite grouted
splice sleeve connector system. Materials 2018, 11, 306.
14. Park, R. Perspective on the seismic design of precast concrete structures in New Zealand. PCI J. 1995, 40,
40–60.
15. International Federation for Structural Concrete (FIB). Seismic Design of Precast Concrete Building Structures;
Bulletin No. 27; International Federation for Structural Concrete (FIB): Lausanne, Switzerland, 2003; ISBN
978-2-88394-067-3.
16. Tullini, N.; Minghini, F. Cyclic test on a precast reinforced concrete column-to-foundation grouted duct
connection. Bull. Earthq. Eng. 2020, 18, 1657–1691.
17. Xu, F.; Wang, K.; Wang. S.; Li, W.; Liu, W.; Du, D. Experimental bond behavior of deformed rebars in half-
grouted sleeve connections with insufficient grouting defect. Constr. Build. Mater. 2018, 185, 264–274.
18. Cao, Z.J.; Li, Q.W. Effect of connection deficiency on seismic performance of precast concrete shear wall-
frame structures. J. Earthq. Tsunami 2019, 13, 1940005.
19. Lin, F.; Zhao, P.; Fang, Z. A novel precast concrete shear wall. Chinese Patent, ZL201720190683.0, 2 March
2018.
20. Ministry of Housing and Urban-Rural Development of the People’s Republic of China. Code for Seismic
Design of Buildings (GB50011-2010); China Architecture & Building Press: Beijing, China, 2010. (In Chinese)
21. Standardization Administration of the People’s Republic of China. Metallic Materials-Tensile Testing-Part 1:
Method of Test at Room Temperature (GB/T 228.1-2010); China Standard Publishing House: Beijing, China,
2011. (In Chinese)
22. Ministry of Housing and Urban-Rural Development of the People’s Republic of China. Cementitious Grout
for Coupler of Rebar Splicing (JG/T408-2013); China Standard Publishing House: Beijing, China, 2013. (In
Chinese)
23. Ministry of Housing and Urban-Rural Construction of the People’s Republic of China. Technical Specification
for Grout Sleeve Splicing of Rebars (JGJ355-2015); China Architecture & Building Press: Beijing, China, 2015.
(In Chinese)
24. ICC Evaluation Service Inc. Acceptance Criteria for Mechanical Connector Systems for Steel Reinforcing Bars
(AC133); ICC Evaluation Service Inc: Birmingham, AL, USA, 2014.
25. Hallquist, J.O. LS-DYNA Theory Manual; Livermore Software Technology Corporation: Livermore, CA,
USA, 2016.
26. Youssf, O.; ElGawady, M.A.; Mills, J.E. Displacement and plastic hinge length of FRP-confined circular
reinforced concrete columns. Eng. Struct. 2015, 101, 465–476.
27. Xu, J.C.; Wu, C.Q.; Li, Z.X.; Ng, C.T. Numerical analysis of shear transfer across an initially uncrack
reinforced concrete member. Eng. Struct. 2015, 102, 296–309.
28. Wang, X.; Liu, Y.; Yang, F.; Lu, Y.; Li, X. Effect of concrete cover on the bond-slip behavior between steel
section and concrete in SRC structures. Constr. Build. Mater. 2019, 229, 116855.
29. Yang, Y. Study on the Basic Theory and Application of Bond-Slip Behavior of Steel Reinforced Concrete.
Ph. D. Thesis, Xi’an University of Architecture and Technology, Xi’an, China, 2003. (In Chinese)
30. Ollgaard, J.G.; Slutter, R.G.; Fisher, J.W. Shear strength of stud connectors in lightweight and normal-
weight concrete. AISC Eng. J. 1971, 8, 55–64..
31. Sebastian, W.M.; McConnel, R.E. Nonlinear FE analysis of steel-concrete composite structures. J. Struct.
Eng. 2000, 126, 662–674.Materials 2020, 13, 2037 21 of 21
32. Nguyen, H.T.; Kim, S.E. Finite element modeling of push-out tests for large stud shear connectors. J. Constr.
Steel Res. 2009, 65, 1909–1920.
33. Kim, H. Bond strength of mortar-filled steel pipe splices reflecting confining effect. J. Asian Archit. Build.
Eng. 2012, 11, 125–132.
© 2020 by the authors. Licensee MDPI, Basel, Switzerland. This article is an open access
article distributed under the terms and conditions of the Creative Commons Attribution
(CC BY) license (http://creativecommons.org/licenses/by/4.0/).You can also read