The Heat-Affected Zone Toughness of Low-Carbon Microalloyed Steels

Page created by Sandra Paul
 
CONTINUE READING
The Heat-Affected Zone Toughness of Low-Carbon Microalloyed Steels
The Heat-Affected Zone Toughness of
                     Low-Carbon Microalloyed Steels

                                   The influence of N and P on notch toughness
                                              appears to be significant

                                      BY C. THAULOW, A. J. PAAUW AND K. GUTTORMSEN

 ABSTRACT. Low-fracture toughness has            hardness for structural steels is largely        1970's for offshore applications, was
 been correlated with brittle zones in the       governed by the carbon content, the             used as a reference steel. To understand
HAZ of low-carbon microalloyed steels.           reduction of this element was desirable,        the brittle behavior, it is important to
This investigation has focused on t w o          but its reduction lowered the strength          locate which part of the HAZ reveals a
aspects of that problem:                         level. Developments in steel production         low-toughness level, and also to evaluate
    1) The extent and the properties of          resulted in the introduction of thermo-         if brittle areas can reveal brittle fracture
the brittle zones as a function of heat          mechanical rolling operations, which cre-       behavior in large specimens and can
input, refinement by subsequent weld             ated the possibility of a large grain refine-   initiate a final fracture behavior. In such a
layers and postweld heat treatment.              ment of the microstructure that could           context, it is of interest to look at the
    2) The possibility of surface crack initi-   compensate for strength losses. The roll-       situation near the plate surface, since
ation in the cap layer.                          ing practice is primarily based on the          from a theoretical point of view, fractur-
   The first aspect has been examined            inhibition of austenite grain growth by         ing is unlikely to occur from small surface
using weld thermal simulation testing,           means of microalloying element additions        cracks.
including CCT diagrams, notch toughness          of Nb, V and Ti. Consequently, new
measurements and microstructural exam-           classes of low-carbon microalloyed steels       Background for the Tests
inations. The second has been investi-           were developed and were introduced
gated using shallow surface notch CTOD           into modern offshore structures.                Single Bead Weldment
testing of bead-in-groove weldments.                Because of the critical nature of off-          Figure 1A illustrates several zones in
with detailed fracture surface examina-          shore activities, highlighted by tragic acci-   the HAZ of a single bead weldment. Each
tions. A good qualitative relationship was       dents, a thorough evaluation of the             zone can be characterized by a certain
established between the weld thermal             toughness behavior of weldments is              microstructural composition, which also
simulation testing, the microstructural          required. During such studies, low-frac-        can clearly be seen on a macroetched
analysis and the CTOD tests. Two low-            ture toughness levels were registered in        specimen (Fig. 1B); however, each zone
toughness zones were identified. Of spe-         weldments of a low-carbon micro-                has no sharp transition, but does have a
cial interest are the crack arrest proper-       alloyed steel in both as-welded (AW) and        transition region. Descending from the
ties, the influence of elements such as N,       postweld heat-treated (PWHT) condi-             weld interface into the base metal results
P and Nb, and the significance of local          tions. Toughness was evaluated by               in a decreasing peak temperature (Tp),
brittle zones with respect to the risk of        means of crack tip opening displacement         implying that the different zones can be
failure of welded structures.                    (CTOD) testing. To evaluate the brittle         indicated with peak temperatures as fol-
                                                 phenomena in the HAZ in more detail,            lows: coarse-grained zone, 1590°C
Introduction                                     the Norwegian Petroleum Directorate ini-        (2894°F) < T p < 1100°C;                fine-grained
                                                 tiated a research project including nine        zone, 1100°C ( 2 0 1 2 ° F ) < T p < 850°C;
   The offshore activities in the North Sea      low-carbon microalloyed steels and one          partially transformed zone,                   850°C
have to a large extent relied on welded          C-Mn steel. The C-Mn steel, used in the         (1562°F) < T p < 700°C; and tempered
structures of medium-strength steel. In                                                          zone, 7 0 0 ° C ( 1 2 9 2 ° F ) < T p .
the past, research indicated that the hard-
                                                                                                    The temperatures are only given as
ness requirements in the heat-affected
                                                          KEY WORDS                              indications, since the actual temperatures
zone (HAZ) required welding with low
                                                            Low-Carbon Steel                     depend on chemical composition and
heat inputs. At the same time, it was
                                                            Microalloyed Steel                   welding parameters. The coarse-grained
determined that high heat inputs should
                                                                                                 zone is more or less characterized by
be avoided because they contributed to                      Weldment
                                                                                                 quenched microstructures of bainite/
reduced toughness levels in the HAZ. As                     HAZ
                                                                                                 martensite. The increase in peak temper-
                                                            Weld Simulation Test
                                                                                                 ature also resulted in an increase in aus-
                                                            Notch Toughness
                                                                                                 tenite grain growth, followed by a subse-
C. THAULOW and A. j. PAAUW are with the                     Fracture Toughness
                                                                                                 quent coarsening of the microstructure.
Foundation for Scientific and Industrial                    Crack Initiation
                                                                                                 Consequently, there is a clear microstruc-
Research, Norwegian Institute of Technology,                Fracture Surface
Trondheim, Norway. K. GUTTORMSEN is with                                                         tural gradient in each zone; however, the
                                                            Influence of P, N
the Norwegian Petroleum Directorate, Sta-                                                        microstructure is the same. The fine-
vanger, Norway.                                                                                  grained zone is characterized by a fine

266-s I SEPTEMBER 1987
The Heat-Affected Zone Toughness of Low-Carbon Microalloyed Steels
ferrite grain structure, which resulted
from the normalizing heat treatment of
the base metal. In the partially trans-
formed region, the peak temperature
was too low to produce a complete                                                                                              Peak
transformation. The pearlite has been                                                                                          temperature
transformed, but the transformation at                 Coarse grained zone                                                                    Tp
the ferrite grain boundaries was only
partial. Finally, the tempered region is               Fine g r a i n e d z o n e
characterized by a thermal treatment of                                                                                                       1100°<
the base material, but no change in the                Partially t r a n s f o r m e d z o n e
                                                                                                                                          -   850°C
microstructure was observed by optical
                                                       Tempered zone
microscopy. For each point in the HAZ,                                                                                                    —700°C
or line parallel the weld interface, the
thermal history is indicated schematically
in Fig. 1A. The temperature cycle is char-
acterized by the peak temperature (TD)
and the cooling time from 800° to 500°C                                                                Tp = 1350 C
(Ats/s). The last parameter indicates                                                      Temp.
how rapidly the material cools down
and is dependent on the welding para-
meters. Increasing heat input increases
the cooling time, and consequently,
changes the microstructure. Another                                                                                    time
important aspect is that increasing the
cooling time (for instance heat input)
increases the extent of the zones (broad-
er zones).

Multipass Weldment
   The situation in a multipass weldment
can be constructed from the condition
shown in Fig. 2. Weld 1 in this figure can
be assumed to be the single bead weld in
Fig. 1. The subsequent weldment, Weld
2, will change the HAZ of Weld 1. How-
ever, it is different from the HAZ of a
single bead weldment. The original
microstructure is not the ferrite/pearlite
microstructure of the base metal, but the
bainite/martensite of the coarse-grained
zone. The thermal history in such a HAZ
can be characterized by two tempera-
ture cycles, as indicated in Fig. 2. Subse-
quent weld beads will influence the
microstructures by a tempering heat                 Fig. 1— The heat-affected zone (HAZ) of a single bead weldment. A-A schematical presentation
treatment mechanism.                                of the different zones in the HAZ of a single bead weldment; B-a macrosection of a bead in
                                                    groove weldment, Steel 2
Investigated Steels
                                                    steels, while one steel (Steel 8) is a C-Mn           carbon microalloyed steels is low (0.08-
   The chemical compositions are pre-               steel of the quality used previously for              0.12 wt-%) compared to the C-Mn steel
sented in Table 1. Nine steels are classi-          offshore structures.                                  (0.18 wt-%). However, all the steels have
fied as modern low-carbon microalloyed                 The carbon content of the nine low-                a similar Mn content, in the range of

Table 1—Chemical Composition of the Investigated Steels

                                                          Chemical Composition (wt-%)                                                              ppm
               C      Si    Mn       P          S        Cu       Ni       Cr       Mo       V       Ti         Nb        Al        N          O         H

 Steel   1    0.09   0.51   1.56   0.021      0.005      0.13    0.14     0.02      0.01    0.01    0.002      0.041    0.036     0.010       40
The Heat-Affected Zone Toughness of Low-Carbon Microalloyed Steels
L= 4W

                     i._Vi_-
                                                                                                                             W= B

                                                                               CTOD TEST SPECIMEN       BxB , Surface notched

                                                                                                    a/W = 0.05 - 0.1

             Cycli             Cycle 2
     Temp,
                                 (Tp]L,r 900

                                  time

Fig. 2 — The temperature cycle in a multipass weldment                 Fig. 3 —A — The surface notched CTOD specimen; B — the position of
                                                                       the electro-discharged notch in the bead-in-groove weldment

1.3-1.6 wt-%.                                     All steels were normalized after con-        perature (Tp) and a cooling time from
   All steels are microalloyed with Nb, but    trolled rolling, resulting in fine-grained     800° to 500°C (1472° to 932°F) (At 8/ s).
in different quantities, ranging from 0.017    ferrite and pearlite in a clear banding        By positioning a dilatometer on the spec-
to 0.048 wt-%. Other microalloying ele-        distribution. The plate thicknesses ranged     imen, the phase transformation was reg-
ments include Mo, V, Ti and Al. The levels     from 40 to 60 mm (1.5 to 2.4 in.).             istered by recording the change in vol-
are low for M o , V and Ti, with an               The low-carbon microalloyed steels          ume. After the simulation tests, the spec-
exception for Steel 2, which has a Ti          have similar mechanical properties: upper      imens were machined to Charpy V-notch
content of 0.011 wt-%. The Al content          yield stress, 340-380 MPa (49.3-55.1 ksi);     specimens to determine notch tough-
varies between 0.017 and 0.036 wt-%,           tensile strength, 480-520 MPa (69.6-75.4       ness. Furthermore, the microstructure
but that is a low level for steels. All        ksi); elongation, 30-35%; percentage           was investigated by preparing the speci-
microalloying elements are affected by         reduction of area, 70-80%; and Charpy          mens with grinding, polishing and etching
the N content, which varies from 80 to         V-notch absorbed energy at - 4 0 = C ,         in 2% Nital.
140 ppm.                                       250-300 ) (184-221 ft-lb). The C-Mn steel         The surface fracture toughness speci-
   Small amounts of Cu and Ni are              exhibits a similar level for mechanical        mens were extracted from single-pass
present in the steels at a level
The Heat-Affected Zone Toughness of Low-Carbon Microalloyed Steels
Steel 1     —                          Steel 6        — •> — .
                                                                                                   Steel 2

                                                                                                  Steel 3                                 Steel 9             .     u   —
                                                                                                  Steel 4
                                     200
                                                                    0-—                            300
                                      J                                                                        1            \
                                                                           a
                                                                                                                                            Tp = 1350°C
                             CVN                                                                     J
                                                                                                               is                \

                                 S
                                     100

                                          ^
                                              fi"°
                                               27
                                                    fi                                    CVN.22oc
                                                                                                   200
                                                                                                               Li >
                                                                                                               11 l v

                                                                                                                l\ 1 \
                                                                                                                        \
                                                                                                                                     \

                                       0
                -6 0   -40   -20           0        20    40       60     80 o c 100
                                                                                                               . \\l             x

   Fraction
              100
               %
                         *—8^^
                                                                                                   100
                                                                                                              ,U '                                                      -

   brittle     50
                                          8 ^       0
                                                                                                                \ \ \ •••                                               -
   fracture                                         8 \                                                                                   _ . _ - - '
                                                                                                     0
                 0
                -6 0   -40   -20          0         20    40       60     80 0 1 30                      c                  10                     20          s        30
                                                                             °C
                                                                                                                                              At
                                                                                                                                     *"            8/5

Fig. 4 - The transition curve of the Charpy V-notch energy and the                     Fig. 5- The influence of the cooling time (At8/5) on the notch toughness
fraction of brittle fracture of the simulated weld thermal microstructure              at -22°C of the simulated weld thermal specimens, comparing the
of Steel 1 (T = 1350°G and At8/5 = 12 s)                                               curves of the investigated steels

Weld Thermal Simulation Results                                on a few steels to investigate:                     UB — upper bainite which is differen-
                                                                  1) The influence of a postweld heat                  tiated between:
   The main tests were divided into t w o                      treatment. The weld thermal specimens                   SP —side plate structure often
parts:                                                         were heat treated for 1 h at 600°C                           growing from former austenite
    1) The influence of the cooling time                       (1112°F) before testing.                                     grain boundaries with plates
(Ats/s) for a peak temperature of 1350°C                          2) The influence of a double weld                         separated by austenite/mar-
(2462°F). As indicated in Fig. 1, the peak                     thermal simulation cycle. By performing a                    tensite/carbide aggregates;
temperature of 1350°C is in the middle                         second weld thermal cycle, it was intend-               AF —acicular intergranular ferrite
of the peak temperature range of the                           ed to analyze the changes occurring in                        plate/needle separated by
coarse-grained zone, and this peak tem-                        multipass welding.                                            high-angle boundaries;
perature is used as a first characterization                                                                       M —martensite.
of the coarse-grained zone. By changing
                                                               Influence of the Cooling Time for a Peak
the cooling time (At 8/5 ) of the tempera-                                                                             What was observed was largely mar-
                                                               Temperature of 1350° C
ture cycle, the influence of the heat input                                                                         tensite and upper bainite consisting of
on the coarse-grained zone can be ana-                            The cooling time (Ats/s) w a s varied             side plate ferrite and acicular ferrite, in
lyzed.                                                         between 4 s and 24 s, and a summary of               which the side plate ferrite structure was
   2) The influence of the peak tempera-                       the Charpy V-notch toughness is present-             the dominating component. At the lon-
ture (Tp) for a cooling time of 12 s. The                      ed in Fig. 5. Steels 5 and 7 were not                gest cooling time, the structures of all
HAZ consists of different microstructural                      investigated since their compositions are            steels (excluding Steel 10), including the
zones, and a gradient exists in each zone.                     similar to the other steels. The highest             C-Mn steel, was upper bainite, as shown
To investigate this situation, the peak                        toughness is observed for Steel 10, fol-             schematically in Fig. 6A. For the low-
temperature of the weld thermal simula-                        lowed by Steel 4. The other steels                   carbon microalloyed steels, the same
tion cycle was systematically reduced                          revealed a similar behavior, with low                microstructure was observed at the cool-
from 1350° to 700°C (2462° to 1292°F)                          toughness at cooling times greater than             ing time of 12 s, while the C-Mn steel
for a series of specimens.                                     10 s. At lower cooling times, the tough-             displayed a large amount of martensite.
   From the weld thermal specimens, the                        ness increases significantly. It should be           However, at the shortest cooling time,
notch toughness was determined, and                            noted that the C-Mn steel (Steel 8) fol-             deviations were observed. For instance,
the microstructures analyzed. The transi-                      lowed this tendency, too.                            Steel 2 had a reduced amount of mar-
tion curve of a simulated microstructure                          Three cooling times were chosen,                  tensite compared to the other steels. As
for Steel 1, T p = 1350°C and At 8 / 5 = 12                    Af.8/5 = 4 / 5 s, 12 s and 24 s, and the             expected, the microstructure of the C-
s, is shown in Fig. 4. The lower shelf of                      microstructures investigated were as fol-           M n steel was martensite.
the curve is positioned at ss —20°C                            lows:                                                  With an increase in the cooling time, a
(—4°F), which implies that this tempera-                                                                           considerable coarsening of the micro-
ture was probably most sensitive to a                          P    — pearlite;                                    structure was observed. This condition is
change in microstructure with a coincid-                       F    — polygonal, equiaxed ferrite often            related to the increase in austenite grain
ing change in transition temperature.                                located at former austenite grain             size with the increase in cooling time —
   A secondary project was carried out                               boundaries;                                   Fig. 6B. Also, Steel 10 showed an increase

                                                                                                             WELDING RESEARCH SUPPLEMENT 1269-s
The Heat-Affected Zone Toughness of Low-Carbon Microalloyed Steels
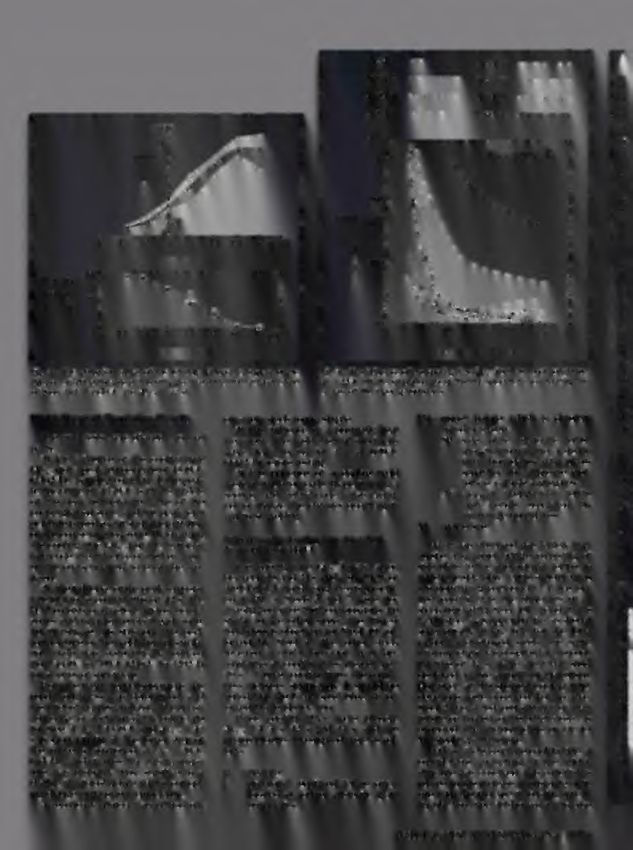
Steel 2                       Steel 4           \7               Steel 8            <

    Steel 3                        Steel 6          •                Steel 9            O

      B
                                                                                                          •tig. y ^ w "
     .2              100
      o               %
     2          i,
     0)              60
     •**

     c                                                              Tp = 1350 C
     (D
     CQ                0
                                                                                         30

                                                          At 8 / 5
                                                                Steel 10           •
                 150

           in
           c
         a       100
           a.
           O)
        a>
       ^.
       'c
           aj
           u>
       <
                     50

                                                                    Tp - 1350 C

                                      10                      20                        30

                                                         At 8 / 5
 B
Fig. 6 —A — The influence of the cooling time (Ats/s) on the fraction of                                 Fig. 7 — A comparison between the simulated weld thermal microstruc-
bainite in the microstructure; B — the prior austenite grain size                                        ture of Steel 6 and Steel 10 (Tp = 1350°C, M8/5 = 24-25 s)

in austenite grain size as t h e c o o l i n g t i m e               l o w e r bainite m i c r o s t r u c t u r e instead o f            Steel 10 p r e s e n t e d t h e l o w e s t level. C o n -
increased. T h e m i c r o s t r u c t u r e o f Steel 10            u p p e r bainite.                                                   cerning the C - M n steel, t h e same t o u g h -
d i d not consist of u p p e r bainite —Fig. 7.                                                                                           ness level w a s o b s e r v e d in the partially
A n e l e c t r o n microscopic evaluation is                                                                                             t r a n s f o r m e d z o n e as in the base m e t a l .
                                                                     Influence of the Peak Temperature (T p ) for
n e e d e d f o r an identification of the m i c r o -                                                                                         A r o u n d a peak t e m p e r a t u r e of 8 5 0 ° C
                                                                     a Cooling Time of 12 s
structure, but the t r a n s f o r m a t i o n dia-                                                                                       (1562°F), t h e partially t r a n s f o r m e d r e g i o n
grams indicated that l o w e r bainite c o u l d                          By changing the peak t e m p e r a t u r e of                   b e c a m e a fine-grained z o n e , character-
b e f o u n d here.                                                  the w e l d t h e r m a l simulation cycle, the                      ized b y a f i n e ferrite grain structure w i t h a
  C o m p a r i n g the microstructural obser-                       different zones in the H A Z o f a w e l d m e n t                   grain size finer than the n o r m a l i z e d base
vations w i t h t h e C h a r p y V - n o t c h t o u g h -          w e r e analyzed. Besides an investigation                           metal. T h e C h a r p y V - n o t c h toughness w a s
ness, s o m e interesting trends                   were              of the m i c r o s t r u c t u r e and its toughness, it             raised t o a high level f o r all the m i c r o a l -
observed:                                                            was possible t o f i n d , t o s o m e extent, the                   l o y e d steels, but l o w e r than the base metal
     1) A high C h a r p y V - n o t c h toughness                   transition peak t e m p e r a t u r e s f o r the                    ( 2 5 0 - 3 0 0 1 / 1 8 4 - 2 2 1 ft-lb). H o w e v e r , it
level w a s f o u n d f o r a martensite m i c r o -                 zones and the toughness gradient in the                              w a s o b s e r v e d that the toughness of the
structure.                                                           zones. A s u m m a r y of the C h a r p y V - n o t c h              fine-grained z o n e of the C - M n steel w a s
     2) W i t h an increasing a m o u n t of u p p e r               toughness curves f o r the eight investi-                            higher t h a n t h e base m e t a l .
bainite, t h e n o t c h toughness decreased,                        g a t e d steels is p r e s e n t e d in Fig. 8. Starting               Increasing t h e p e a k t e m p e r a t u r e t o
a n d especially f o r the C - M n steel, w h e r e                  at t h e l o w e r peak t e m p e r a t u r e s , all                higher values ( > 1 0 0 0 ° C / 1 8 3 2 ° F ) re-
a rather small a m o u n t w a s e n o u g h t o                     m i c r o a l l o y e d steels s h o w e d a m i n i m u m           sulted in a transition f r o m fine-grained t o
r e d u c e the n o t c h toughness considera-                       toughness in the partially t r a n s f o r m e d                     coarse-grained z o n e . T h e transition range
bly.                                                                 r e g i o n . T h e microstructures revealed the                     for Steels 1 , 4 a n d 10 a n d the C - M n steel
    3) A c o m p l e t e u p p e r bainite m i c r o -               t r a n s f o r m a t i o n of pearlite t o martensite,              w a s 1 0 0 0 ° - 1 1 0 0 ° C . A s o m e w h a t higher
structure has a l o w n o t c h toughness f o r                      w h i l e t r a n s f o r m a t i o n p r o d u c t s w e r e also   transition w a s f o u n d f o r Steel 2, w h i l e t h e
almost all o f the specimens, including the                          o b s e r v e d at the ferrite grain boundaries.                     highest           transition         (1150°-1250°C/
C - M n steel. H o w e v e r , Steel 4 s h o w e d a                 Increasing the peak t e m p e r a t u r e in-                        2 1 0 2 ° - 2 2 8 2 ° F ) w a s o b s e r v e d f o r Steels
rather high n o t c h toughness w i t h a c o m -                    creased t h e t r a n s f o r m a t i o n r e g i o n t o t h e      6, 9 a n d 3.
plete u p p e r bainite m i c r o s t r u c t u r e .                extent that w h o l e ferrite grains w e r e                            For Steels 1 , 6, 9 and 3 a n d the C - M n
    4) Superior         toughness       has     been                 t r a n s f o r m e d in the fine-grained z o n e .                  steel, t h e transition f r o m high toughness
o b s e r v e d f o r Steel 10, w h i c h s h o w s a                Steel 4 s h o w e d the highest values, w h i l e                    in t h e fine-grained z o n e t o l o w toughness

2 7 0 - s | SEPTEMBER 1 9 8 7
The Heat-Affected Zone Toughness of Low-Carbon Microalloyed Steels
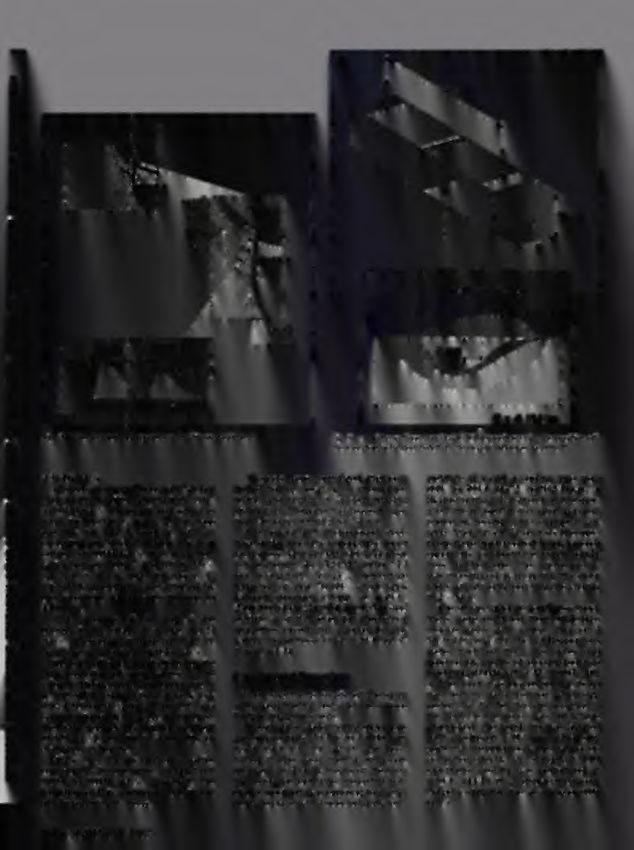
in the coarse-grained zone coincides with
the transition temperature of the micro-                                     Steel 1                    —                         Steel 6
structure. The microstructure is upper
bainite for the microalloyed steels, while                                   Steel 2                                              Steel 8
the C-Mn steel has a considerable                                            Steel 3                                              Steel 9
amount of martensite. Steel 10 exhibited
                                                                             Steel 4                                              Steel 10
a special behavior, with the toughness
increasing in the transition region to a
very high level. Both Steels 2 and 4 show
upper bainite in the coarse-grained zone;
however, in a large part of the coarse-
grained zone (up to 1350°C/2462°F), a
high toughness level was found.

Influence of PWHT on the Weld
Thermal Specimens
    The investigations were limited to
Steels 1, 2, 4 and 8. The peak tempera-                                                                                                                                               Fig. 8 — The influence
ture was varied between 700° and                                                                                                                                                      of the peak
 1350°C, and after the weld thermal sim-                                                                                                                                              temperature (Tp) on
ulation experiments, the specimens were                                                                                                                                               Ihe Charpy V-notch
heat treated for 1 h at 600°C.                                                                                                                                                        toughness at —22°C
                                                                                                                                                                                      of the simulated weld
   The most dramatic influence of the
                                                                                                                                                                   1400               thermal specimens,
heat treatment was observed in the par-                                                                                                                                               comparing the curves
tially transformed region. The Charpy                                                                                                                                                 of the investigated
V-notch toughness level was raised to the                                                                                                                                             steels
same toughness as the fine-grained
zone —Fig. 9. The fine-grained zone in
                                                 largest increase, although the scatter was                                                  Fracture Toughness Test Results
turn is also improved by the heat treat-
                                                 considerable for Steel 4. In the partially
ment. However, the low toughness part
                                                 transformed zone, transformation prod-
of the coarse-grained zone revealed at                                                                                                      Surface Fracture Toughness
                                                 ucts were observed at the prior austenite
least the same low toughness level after
                                                 grain boundaries, but since the toughness                                                    All weldments were made with the
the heat treatment.
                                                 was low initially, the same low level was                                                  same type of electrode, using the same
   Although the Charpy V-notch tough-            observed here.                                                                             welding procedure and a heat input of 4
ness seems not to be altered, the fracture
surfaces of Steels 1, 4 and 8 revealed a
large degree of intercrystalline fracture                                                   Steel 1                                                                                   Steel 2
appearance after the heat treatment,                       300
                                                                                                                                                           300
                                                                                                                                                                                         ' P W H T * 1 hour)800 0 C
compared with a transcrystalline mode of                           "...          :        8 I                                0                              J
                                                                                                     PWHT : 1 h o u r / 6 0 0 C
fracture before heat treatment. Howev-
er, Steel 2 has a transcrystalline fracture                                                 •            \                                                 200
                                                           200
both before and after a heat treatment.                                • (
                                                                                                                                                                                  '        As simulated         J,
                                                                                                                                               CVN
                                                  CVN                                                                                                -22t
                                                        -22°C
                                                                                                                                                                            ' ' / ' - - ' " " - - " •                \
Influence of a Second Weld
Thermal Simulation Cycle                                   100                                                                                             100

    The initial microstructure of the speci-
mens was the coarse-grained zone
                                                                             \              OaV                                                                              At
                                                                                                                                                                                  8/5
                                                                                                                                                                                        = 12 •                           VJ '
                                                                                                                                                                                                                          \;
                                                                                      /                         \                                                                                                         o
(Tp = 1350°C and Atg/s = 12 s). The                                                                                                                         0
                                                                                                                                                                                      900 1000 1100 1200 1300 1409
                                                                 600   700            800       900 1000 1100 1200 1300„140C                                eo 0      700   800
specimens were simulated with a second                                                                                                                                                                                   °c
cycle, with varying peak temperatures.
These experiments were limited to Steels
 1, 4 and 8.
                                                                                            Steel 4                                                                                   Steel 8
    In the coarse-grained zone, transition
from 1000° to 1100°C (1832° to
                                                                                 /          PWHT : 1 hoUr/BOO C
2012°F), the notch toughness was low, as                    J                                                                                          J
                                                                                                                                                                                       "a/« =       12
                                                                                                                                                                                                         *
the microstructure was similar to the
original microstructure of upper bainite —
Fig. 10. In the fine-grained zone, the            CVN
                                                           200
                                                                             i   'i
                                                                                                       / \
                                                                                                ,' As simulated \       v
                                                                                                                            A
                                                                                                                                i                     200    .
                                                                                                                                                                                         PWHT : 1 hour/600 0 C
                                                        -22°C                                                       a
                                                                                                                                              CVN
coarse-grained initial microstructure was                                                                                                           -22t

transformed, resulting in some grain
                                                           100
refinement of the austenite, although the                                                                                                             100

austenite grain size was still t o o large to                                                                                                                   Aa (Imulaiecl -             ~". \        \'
result in a fine ferrite grain structure. Only
at the prior austenite grain boundaries                                                                                                                                                         '^v&tefc.
was the fine ferrite grain structure
                                                                 600    ,
                                                                       700            800       B00 1000 1100 1200 1300 140-0                                   600   700    600       900 1000 1100 1 2 0 0 1 3 0 0 . 1 4 00

                                                                                                        Tp                                                                            —•-      Tp
observed, while upper bainite was found
within the grains. A certain improvement
                                                 Fig. 9- The influence of a postweld heat treatment (PWHT) on the Charpy V-notch toughness at
in the Charpy V-notch toughness was
                                                 —22 "C for simulated weld thermal specimens with varying peak temperatures and a cooling time
observed. Steels 4 and 8 showed the              of At8/5= 12 s

                                                                                                                                    WELDING RESEARCH SUPPLEMENT 1271-s
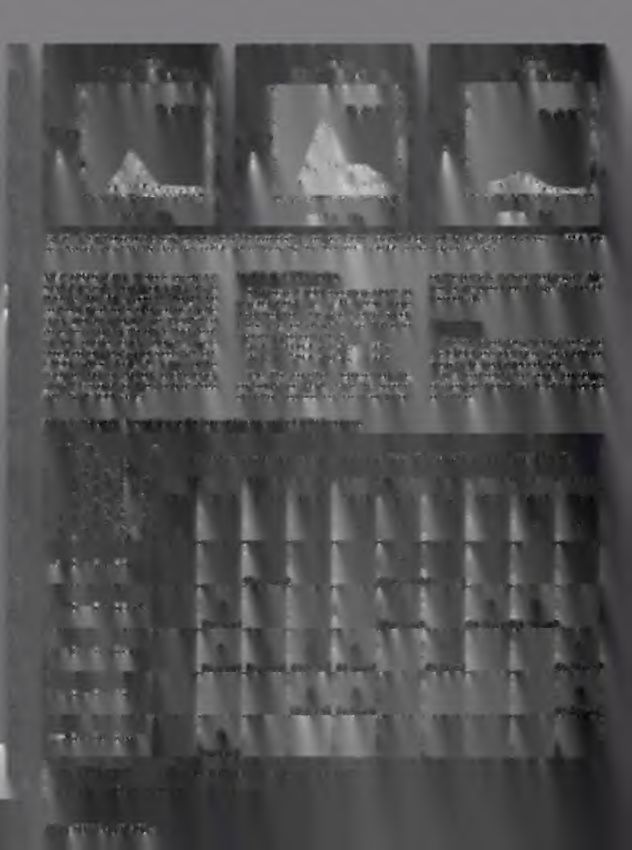
The Heat-Affected Zone Toughness of Low-Carbon Microalloyed Steels
Steel 4                                                                         Steel 8
                                                                                                                                                                  (Tp) = 13SO°C        / (M         ) = 12 a                                      ( T p ) i = 1350°C    / ( A t a / 5 ) 1 = 12 s

                                                                                                                                                        J                                                                              j

                                                                                                                                                                                                            1
                                                                                                                                                                                            "Wl' *'                                                                            "V5V ,2 •
                                                                                                                                                    200
                                                                                                                                                            '                                                                         200

                                                                                                                                          CVN       o                                                                        CVN
                                                                                                                                                                                                                                   -22°C
                                                                                                                                                -2 2 C

                                                                                                                                                                         /      \                                              )
                                                                                                                                                    100                                                                               100

                                                               /.                          -\                                                                       (y
                                                                                                                                                                        IX V" ~'\.     \          . .   • •                                         •y^'^'           s <
                                                                                                                                                                                                                                                                           "^._    w    __
                                                                                                                                                                                           ~"~^-o-' " " °

                            600         700                    800 900 1000 1100 t?00 1300 1400                                                             600   700    BOO   900   IOOO 1100 1200 1300 1400                               800   700   800    900     1000 1100 1200 1300 1400
                                                                                                                                                                                                                                                                                          °C
                                                                                                                         °c                                                                             °C

                                                                                                           (Tp),

Fig. 10— The influence of the peak temperature of the second simulated weld thermal cycle (Tp)j on the Charpy V-notch toughness at —22°C. The
peak temperature of the first cycle was 1350°C while the cooling time from 800' to 500°C for both cycles was 12 s

MJ/m (101.6 kj/in.). All steels, except for                                                                                              Small-Scale CTOD Testing                                                          of the partially transformed region. The
Steel 2, reveal a pop-in or a final brittle                                                                                                                                                                                results are presented in Figs. 12 and 13,
                                                                                                                                             Small-scale CTOD specimens (10 X 10
fracture —Fig. 11. A pop-in through the                                                                                                                                                                                    respectively.
                                                                                                                                         mm/0.4 X 0.4 in., a / W = 0.3) were
coarse-grained zone followed by ductile
                                                                                                                                         machined from the weld thermal speci-
crack growth through the fine-grained
                                                                                                                                         mens. The test program was limited to                                             Discussion
zone, resulting in a final brittle fracture or
                                                                                                                                         t w o simulated conditions:
further ductile crack growth, were                                                                                                                                                                                            The simulated weld thermal tests and
observed for the group of steels with low                                                                                                    1) T p = 1350°C and At 8 / 5 = 12 s
                                                                                                                                                                                                                           the CTOD tests identified t w o embrittled
CTOD values-Table 2. A final brittle                                                                                                         2) T p = 720°C and At 6 / 4 = 14 s
                                                                                                                                                                                                                           areas in the heat-affected zone:
fracture, with or without ductile crack                                                                                                     The first condition represented the                                               1) A coarse-grained zone, consisting
growth, is shown for the group of steels                                                                                                 coarse-grained HAZ, while the second                                              of a coarse microstructure of martensite
with high CTOD values.                                                                                                                   simulation represented the investigation                                          or bainite.

Table 2—Schematic Presentation of the Type of Fracture in the CTOD Specimens
                 r;
     ?

                                                                                                                       Number of specimens for e a c h f r a c t u r e type w i t h l o w e s t CTOD in p a r e n t h e s i s
                                                                                    Zone
                 Coarse grained Zone

                                                                   PartiaHy Transformed
                                           Flne grained Zone

                                                                                           Tempered Zone

                                                                                                              Steel            Steel         Steel                  Steel                  Steel                 Steel      Steel             Steel                  Steel                   Steel
     Weld

                                                                                                                   1               2                3                    4                      5                  6           7                   8                       9                 10
                                                                             \
                                                                       s

                                                                                                                                                    6                                                              8           2

                                                                                                                                          (0.47mm)                                                              (0.26mm] (1.1mm)

            "j                         [^,^^^4*4^^®                                                                                2                                                                               1                              9                        9
                                                                                                                              (0.7mm)                                                                           (0.25mm)                    (0.18mmX0.29mm)

            \                          I                           ! I    •»                                                       1                3                    3                    4                               1                                                                1
            1                          1                             I I * "
                                                                                                                              (3.3mm) (1.8mm) (1.9mm) (1.6mm)                                                              (2.3mm)                                                   (1.76mm)

            in - I                                             1 I                         »                                                                             6                     5                                                                                               8
                                                                                                                                                                  (2.5mm) (1.9mm)                                                                                                      (1.85mm)

                                                                                                                                   6
 *               *                                             *
                                                                                                                          (5.0mm)

     =           EDM notch                                                                          a„~, Ductile fracture                       •           • B l ittle frac ture

     •—>- Final brittle fra cture                                                                                              0       Unk aded

272-s I SEPTEMBER 1987
The Heat-Affected Zone Toughness of Low-Carbon Microalloyed Steels
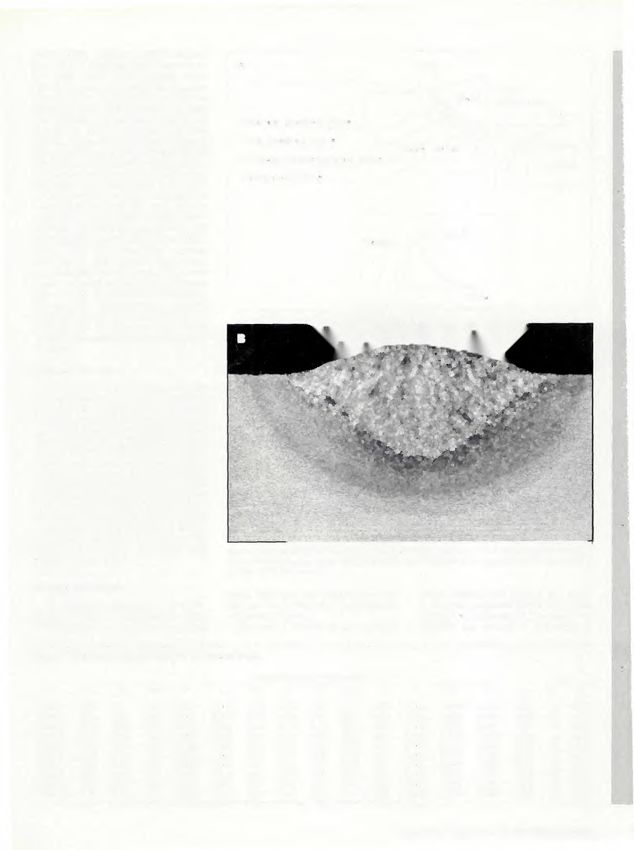
T p = 720°C                              / A t            - 1 2 s
                                                                                                                                                                                       8 / 5

                                                                                                                        1.5

            6.0                                                                                                       mm                                                                                           5
                                                                                                                                                                                                                   Q.

                                                                                                                                                                                                                   o
                                                                                                                                                                                                                   >
            5.0
                                                                                                                        1.0      •       — A                                                                       LU
                                                                                                                                 •                                                             *                   Q
                                                                                                         CTOD   0„                                                                                                 \
                                                                                                             -10 C                                                                                                 I
                                                                                                                                                                                                                   O
                                                                                                                                 •                                                                                 ce
                                                                                                                                 •                       \                                                         <
            4.0
                                                                                                                      0.5                      /                                         /—*                       UJ
                                                                                                                                                                                                                   V)
                                                                                                                                          "A                                                                       UJ
   CTOD   o                                                                                                                                                                   T
                                                                                                                                                                                                                   cc
       -10 C
                                                                                                                                                                                                                   UJ
            3.0
                                                                                                                                                                                                                   0-
                                                                                                                        0
                                                                                                                 Stee            1        2        3     4       5        6        7     8         9       10      o
                                                                                                                                                                                                                   —I
                                                                                                                                                                                                                   ui
            2.0                                                                                       Fig. 13 — The small-scale CTOD results from the simulated weld thermal                                       >
                                                                                                                                                                                                                   UJ
                                                                                                      specimens with Tp = 720°C and Atb/4=14        s. BXB specimens:                                              Q
                                                                                                      a/'W = 0.3                                                                                                   I
                                                                                                                                                                                                                   O
                                                                                                                                                                                                                   CC

            1.0                                                                                                                                                                                                    <
                                                                                                                                                                                                                   UJ
                                                                                                                                                                                                                   tr>
                                                                                                                                                                          ATp

                                                                                                                              CVN   o
                                                                                                                                                                                                                   z
                                                                                                                                 -22 C                                                                             UJ
          Steel      1        2           3       4       5       6       7     8                                                                  \ /            V                '                               Q.
                                                                                                                                                                                                                   o
                                                                                                                                                                                                                   -J
Fig. 11—The surface fracture toughness results for the investigated                                                                                                                                                UJ
                                                                                                                                                                                   1540 C
steels. BXB specimens: a/W = 0.05. Fillet symbols: CTOD at maximum                                                                                                   Tp                                            >
load                                                                                                                              Weld thermal simulation test                                                     UJ
                                                                                                                                                                                                                   Q
                                                                                                                                                                                                                   I
                                                                                                                                                                              1                                    O
                                                                                                                                                                                                                   CC
                                                                                                                  Stee               2     10                4    8           3                        9
                                                                                                                                                                              6                                    <
                  Tp =   1350°C                                                                                                                                                                                    UJ
                                                      / A t   8 / 5   =       12 s                              500                                                                                                ID
                                                                                                                                           C/Mn-steeK                                                              UJ
            1.0
                                                                                                                 °c                                                                                                oc
                                                                                                                         -
            mm                                                                                                  400
                                                                                                                                                                              Or                                   CL
   CTOD
          10°C                                0                                                           ATp   3 0 0
                                                                                                                                                                                                                   O
            0.5
                                                                                                                200                  A
                                          / o                                                •
                                                                                             •
                                                                                                                                                             o        /                                            >
                                                                                                                100                                                                                                UJ
                          a           /                                                                                                                                                                            Q
                                                                                         /        i
                                              o                                          /                                                                                                                         \

                                                      ~/fi
                                                                                                                                                                                                                   I
                     fit °                y.r>    —                                                                0
                                                                                                                        3                 0.004                  0.008                  0.012              0 016
                                                                                                                                                                                                                   O
                                                                                                                                                                                                                   CC
            0
          Stee       1    2       3           4       5       6       7         8    9       10                                                                  -            °oN                                  <
                                                                                                                                                                                                                   UJ

Fig. 12 — The small-scale CTOD results from the simulated weld thermal      Fig. 14 — The peak temperature range (A Tp) of the coarse-grained zone
specimens with Tp= 1350°C and Atg/s = 12 s. BXB specimens:             with low Charpy V-notch toughness plotted as a function of the total
a/W = 0.3                                                              nitrogen content
                                                                                                                                                                                                                   Q.
                                                                                                                                                                                                                   o
                                                                                                                                                                                                                   —I
                                                                                                                                                                                                                   UJ
   2) A partially transformed        zone,                                    thermal simulation cycle had only a limit-                  Coarse-Grained Zone
                                                                                                                                                                                                                   >
where only microstructures with a high-                                       ed improvement in the temperature                                                                                                    UJ
                                                                                                                                             Important variables to be taken into                                  Q
carbon content (pearlite, banding) are                                        range of 800° to 1100°C-Fig. 10. Post-                                                                                               -^
                                                                                                                                          account with steels are processing, chem-                                I
transformed.                                                                  weld heat treatment had no beneficial
   All steels, except for Steel 10, exhibit                                   effect on the low toughness in the
                                                                                                                                          istry and HAZ microstructure.                                            O
                                                                                                                                                                                                                   CC
low Charpy toughness values in a part of                                      coarse-grained zone —Fig. 9.                                                                                                         <
                                                                                                                                          5fee/ Processing
the coarse-grained zone. The part of the                                         All steels had low Charpy toughness in                                                                                            UJ
zone showing low toughness varies with                                        the partially transformed zone (Fig. 8), but                                                                                         v>
                                                                                                                                             All steels are delivered in the normal-                               UJ
the steel quality (Fig. 8) and the cooling                                    very high toughness values were                             ized condition, but there is no informa-                                 cc
rate —Fig. 5. A subsequent second weld                                        obtained after P W H T - F i g . 9.                         tion regarding the detailed processing.

                                                                                                                                WELDING RESEARCH SUPPLEMENT 1273-s
improving the toughness (Ref. 3). Addi-
                                                                                                                                                  tions of trace amounts of Ti, in the range
     (x    Number of specimens in the population for the minimum CTOD value.                                                                      of 0.004-0.01%, are intended to inhibit
                                                                   4                    1                                                         the formation of free N in the heating
                                                                                                                                                  stage of the weld thermal cycle. During
                  Steel                                                                                         9
                                                                                        6
                                                                                                                                                  cooling, it is suggested that Al may play
                                                                                                                            -C
                                                                                                                                                  an important role in fixing free nitrogen to
                                                                                                                            5
               6.0                                                                                                  l       o                     form AIN (Ref. 3).
                                                                    a     Pop-in/Ductila cr g(
                                                                                                                    |       O)                       In addition, niobium carbonitrides may
               mm                                                   •     Pop-in/Due III a Cf.gr ./Buttle lr.               o                     form at lower temperatures; hence, it is
                                                                                                                            co                    difficult first to estimate the amount of
                                                                    o     Brittle it.
                                                                                                                    I       o                    free N, and second, the proportion of the
                               1                                    e     Ductile cr.Qf /Brillle lr.
               5.0                     6
                                                                                                                            CD                   HAZ where nitrides have been dissolved
                               w               '                   -t-    Ductile cr.flr.
                                                                                                                            o
                                                                                                                            3
                                                                                                                                                 during heating, leaving free N after the
                                                                                                                            Q                    subsequent cooling. The total amount of
                                   \               I\                                                                                            N should, however, give an indication of
                                   \ \                                                                                   \                       the potential for free N. In Fig. 14, the
                                                                                                                          \                      temperature range of the coarse-grained
               4.0
                                       VW      # (8>.        \
                                                                                                                        \
                                                                                                                        \\
                                                                                                                                                 zone with low toughness is plotted as a
                                                                                                                                                 function of the total content of N. There
 CTO[                                                                                                                   \\                       is a trend towards decreasing the width
                                                                                                                            \
ATp

                                                                                                                      CVN o                  \                i         i
                                                                                                                         -22X

                                                                                                                                                                       la-iot

                             Weld thermal simulation test                                                                           Weld thermal simulation test

                                                                                                                                             2
                 Steel       2 10
                                                                                                                       Steel            4 10 3                9        6           18

             1.0
                                                                                                                    500                                           C/Mn-steel
                                                                                                                     o„
             mm                   Stoel 10       Lower Bainite        Ductile CTack growth                            C
                                                                                                                    400
  CTOD   o                         |
      -10 C                                          O
                                                                                                                      300
                                             / o \                                                            ATp
             0.5                   +         /                 \                            .
even with the problems of notch posi-
            (x)   Number of specimens in the population for the minimum C T O D value.                                                                   tioning, it is strange that no low CTOD
                                                                                                                                                         values were recorded.
                                           4      2
                              St eel       5 1073                          9             6               18                                              HAZ    Microstructure
a.                                                                                                                                     sz
o                                                                                                                                      *J                   Most of the steels exhibited the same
_i                       6.0                                                                                                           rl                behavior of Charpy notch toughness as
UJ

>                        mm
                                                                      a        Pop-in/DuCitla cr gt.                                   O)                related to the cooling time —Fig. 5. A
UJ                                                                    •        Pop-in/Oucnie ct g, /Brittle It.
                                                                                                                                       CJ
                                                                                                                                                         sharp reduction in toughness was
o                                                                              Brittle It                                              ra
                                                                                                                                       ka
                                                                                                                                                         observed in the cooling time interval
""a.
                                                                      a        Ductile cr gr /Briltie lr.                              o                 from 5 to 12 s, followed by a low notch
                                                      6)
I                        5.0                      ^                                                                                    _0>
                                                                                                                                                         toughness level at 24 s.
o                                                                                                                                      o
CC                                                                                                                                                          Steels 10 and 4 deviate from this trend,
                                                                                                                                       Q
<                                                                                                                                                        with a higher Charpy notch toughness.
UJ
IS)                                       \ \                                                                                      \\                    Examination by optical microscope identi-
                                                                                                                                                         fied a shift in microstructure with a
                         4.0             \ \                                                                                                             change in cooling time —Fig. 6A. The
Q.                                                                                                                                \                      general trend is for a structure to be
O            CTOD                                                                                                                 \\                     dominated by martensite at the shortest
                          0                                                                                                                   CD

                       -10 C                                                                                                                             cooling time, Ats/s = 5 s, and then for a
>
                                         |\^l                                                                                     \
                                                                                                                                  \
                                                                                                                                              13
                                                                                                                                              CO
                                                                                                                                                         gradual increase in the fraction of upper
                                                                                                                                                         bainite with longer cooling times. Steel 10
I
                   ,     3.0             Ks \\ l
                                         1
                                        .                                                                                 \\
                                                                                                                                             7\
                                                                                                                                             /
                                                                                                                                                         toughness because autotempering can
                                                                                                                                                         take place from a high M s temperature.
a.
o
—i
UJ                       1.0
                                r
                                            //A
                                             /
                                               f>
                                                                                                                                             /
                                                                                                                                             / /
                                                                                                                                                    _c
                                                                                                                                                         The hardness gives no indication of the
                                                                                                                                                         toughness, because this kind of marten-
                                                                                                                                                         site has a high toughness and hardness,
>                                              \A               /                                                                              A
                                                                                                                                             /      Q.   while the brittle upper bainite has a lower
UJ
Q
                                                  o'/A                                                                                              o
                                                                                                                                                    DL   toughness —Fig. 5. The upper bainite is
"aa.                                                                                                                                            /
o                                                                                                                                                        dominated by a side plate structure with
cc                                                                                                                                           /
                                                                                                                                                         the plates separated by austenite/mar-
<                                                                                        "tl)"                   X
                                                                                                                     C/Mn-steel              /           tensite/carbides, giving favorable condi-
UJ                       0
tf)                             ()                             0.01                                0.02                                    0.03          tions for initiation and propagation of
UJ
oc                                                                                                                                                       cleavage fracture. Both Steels 2 and 4
                                                                                                                                                         exhibit a high notch toughness in a large
                                                                                 »                %P
                                                                                                                                                         part of the coarse-grained zone with
                                                                                                                                                         upper bainite (Fig. 8), indicating that some
a.     Fig. 18— The minimum CTOD values of the groove-welded specimens plotted as a function of                                                          additional embrittling effect is necessary
O      the phosphorus content and related to the different fracture types                                                                                in order to obtain a brittle low-carbon
_i
UJ                                                                                                                                                       upper bainite structure.
>
UJ
Q                                                                                                                                                        Partially Transformed Zone
\        Fig. 19-The CTOD
I                                                                                                                                                           Recognizing brittleness in the partially
O               results of the                                                Weld thermal simulation test
or            simulated weld                                                                                                                             transformed zone is not a new discovery.
<         thermal specimens                          Stee                  4 10 3                            9        6           18                     In a paper published in 1947, the exis-
UJ         (Tp = 1350°C and                                                  2                                                                           tence of this low-toughness region was
cn       Ata/s = 12 s) plotted                                                                                                                           examined with notched bend specimens
                                                       1.0
UJ       as a function of the                                                                                                                            and heat-treated Charpy bars to simulate
Z        phosphorus content                           mm                  Steel 10 . Lower Bainite - Ductile crack growth                                the thermal effect of welding (Ref. 6).
UJ
2                                                                                                                                                        Two temperatures were found to be
o
                                       CTOD   o
                                           -10 C                                 ]                                                                       highly deleterious —a coarse-grained
                                                                                                                                                         structure formed at 1150°C (2102°F) and
                                                      o.s                                                                                                the lowest values of all, observed at
>
UJ
o
                                                                          O

                                                                          O
                                                                                 i\ /
                                                                                 »

                                                                                     \        /
                                                                                                     /

                                                                                                    Upper Bainite
                                                                                                                     -\
                                                                                                                      »

                                                                                                                          \
                                                                                                                                                         760°C (1400°F). Postheating at 450°C
                                                                                                                                                         (842 °F) and above restored a large
                                                                                                                                                         degree of the toughness drop at 760°C.
X                                                                         Ov     &                       ^                    \       C/Mn- steei .      Microscopic examinations revealed that
o                                                                                                                                           Martensite
oc                                                     0                                                                                                 upon heating to 760°C, pearlite islands
<                                                                                                                                                        transformed to austenite with a nearly
UJ                                                             c)                            0.01                         0.02
V)                                                                                                                                                       eutectoid composition. Upon cooling,
UJ
cr                                                                                                                                                       these high-carbon islands were partially
                                                                                                                                                         transformed to martensite. Postheating

       276-s | SEPTEMBER 1987
served to temper and partially spheroid-
ize the martensite.                                                                                                   ATp
    The observations from 1947 corre-
spond very well to the present results.
                                                                                                                  r            i
                                                                       °c
                                                                                         \r\ i
                                                          C V N
                                                                       -,-a
Low toughness is observed in the partially                         -22
transformed zone after single cycle ther-                                                                                                                                                                                 Q.

mal simulation (Fig. 8), and also in the
                                                                                                                               1540"C
                                                                                                                                                                                                                          o
temperature range which corresponds to                                                                  -        Tp                                                                                                       UJ
the partially transformed zone after dou-                                                                                                                                                                                 >
                                                                                                                                                                                                                          UJ
ble simulation of the coarse-grained                                          Weld t h e r m a l simulation t e s t
                                                                                                                                                                                                                          Q
zone —Fig. 10.                                                                                                                                                                                                            \
                                                                                                                      6                                                                                                   I
   The optical microscopic examination                    St e e l                           4       10          289                  1                   3                                                               O
                                                                                                                                                                                                                          CC
and work in progress on similar low-
carbon microalloyed steels (Ref. 7) have                500
                                                                                         C/Mn-Steel                                               /                                                                       <
identified high-carbon twinned marten-                   °c                                                                                                                                                               UJ
                                                        400
                                                                                                                 *                  /o                                                                                    tf)
site as the main embrittling factor. After                                                                                 /                                                  /                                           UJ
single cycle transformation, the banding                                                                                                                                                                                  cc
                                                  ATp   300                                                                                                       /                                                       UJ
with high-carbon areas (pearlite) is aus-                                                                                                                 a
tenized and subsequently transformed to                                                                                                                                                                                   2
                                                                                                                                                                                                                          CL
twinned martensite upon cooling. The                    200                                                                                                                                     Fig. 20-Thepeak           o
                                                                                                                                                                                                                          —I
martensite will reduce the toughness                                                                                                                                                            temperature range         UJ
partly because of the residual stresses in                                          A o                                    /                                                                    (ATp) of the              >
                                                        100
the surrounding matrix and partly                                                                                                                                                               coarse-grained zone       UJ
                                                                                                                                                                                                with low Charpy           Q
because of the preferred distribution of                           /                                                                                                                                                      N
the martensite islands along the ferrite                  0                                                                                                                                     V-notch toughness         I
grain boundaries within the banding area.
                                                              ()                                 0.02                               0.04                                          0.06          plotted as a function     o
                                                                                                                 —-**          %Nb                                                              of the niobium            cc
The work in progress (Ref. 7) has indi-                                                                                                                                                                                   <
                                                                                                                                                                                                content                   UJ
cated that the brittleness can be avoided
                                                                                                                                                                                                                          If)
if the pearlite is finely dispersed.                                                                                                                                                                                      UJ
                                                                                                                                                                                                                          oc
   After double simulation of the coarse-                                                                                                                                                                                 ~~~
                                                         (x)       N u m b e r of s p e c i m e n s in t h e p o p u l a t i o n f o r t h e minimum C T O D v a l u e .                                                  \-
grained upper bainite, the existence of
separate phases (islands) along the prior                                                                         4                   6                                                 3                                 z
                                                                                                                                                                                                                          UJ
austenite grain boundaries is even visible                                        Steel                           5        10        289                                  1             7
at low magnification in the optical micro-                                                                                                                                                          JZ                    o
scope—Fig. 23. The embrittling effect of                                      6.0
                                                                                                                                                                                                     5
                                                                                                                                                                                                     o
                                                                                                                                                                                                                          >
twinned martensite in a less ductile matrix                                                      Pop-ni/Ouciila cr.gr                                                                                                     UJ
                                                                                         "                                                                                                           DJ
(upper bainite) is obvious.                                                   mm         •       Pop-in,DuCllla cr gr. /Brntla lr.
                                                                                                                                                                                                     O
                                                                                                                                                                                                                          o
                                                                                         °                                          Mil/                                                             CO                   I
   PWHT has a remarkable effect on the
                                                                                                                                                                                                    o
                                                                                                                                                                                                                          o
toughness of the partially transformed                                                   •       Ouciila c       V3'          \
CTOD standard was substituted with an                                                                                                                                                           \
electro-discharge machined notch. Both
the shallow cracks and the EDM notch                                                                                                                                                                     /
                                                                                                                                                                  A                     .(?>                 /            OL.
result in higher fracture toughness than if                                   1.0                                                                             /                                                  /   _c
measured in accordance with the CTOD
                                                                                                                                     o' ' 1
                                                                                                                                                      /                                                   ' /
                                                                                                                                                                                                                     Q.
                                                                                                                                                                                                                     O
                                                                                                                                                                                                                          o
                                                                                                                                                                                                                          _J
standard (Ref. 5).                                                                                                                                                                                                   0.   UJ
                                                                                                                                          //                                        .«)                  /                >
   Most specimens were characterized                                                                                  ' r t . MW» /                                    n (3 » /-                             /            LU
with a pop-in or a final brittle fracture —                                                                 C/Mn-steel^iB." / .                                       &
                                                                                                                                                                                                         ' /              a
                                                                              0                                                     « • * • > "                       .                                                   I
Table 2. Only for Steel 2 was ductile                                               ()                                0.02                                        0.04                                                    o
crack growth, resulting in a maximum                                                                                                                                                                                      oc
                                                                                                                                                                                                                          <
load recording, observed for several                                                                                                •a                    CV U L
                                                                                                                                                                                                                          UJ
                                                                                                                                                                                                                          V)
specimens. For all the other steels, the                                                                                            •^                     rolND
                                                                                                                                                                                                                          UJ
CTOD values (Fig. 11) represent a brittle                                                                                                                                                                                 or
fracture or a pop-in. The large scatter in     Fig. 21- The minimum CTOD values of the groove-welded specimens plotted as a function of the
the test results is partly caused by the       niobium content and related to the different fracture types

                                                                                                                                WELDING RESEARCH SUPPLEMENT 1277-s
• ; , . ! . .
                                                                    Weld thermal simulation t e s t
                                                                                           6
                                                         Steel           4        10    2 8 9            1           3

                                                       1.0

                                                       mm
                                                                             Steel 10   Lower Bainite - Ductile crack growth

                                        CTOD        o
                                                                                                                                                      '&•,
                                                 -10 C                            t                                                                                                          -tlSSE^
                                                                         O
                                                       0.5                              """"^-c-
                                                                        O
                                                                                  \       • X
                                                                        o                 "Upper       X
                                                                                                   Bainite \ v ^
     Fig. 22-The      CTOD                                                                rv                        o                                                                                At^-iy-:         ^
              results of the                                            0                                                                  Wch>ii a'**',X
            simulated weld
       thermal specimens
                                                                             —1
                                                                                                C/Mn-steel .       70% Martensite           £ -;;; ~>.Ap, *                                          •V      •"'.     A
                                                                             0.02                     0.04                      0.06                                          :
        (Tp = 1350°C and                                                                                                                   $•    *   •••                 •'       S   •
     Ats/s = 12 s) plotted
      as a function of the                                                                         °oNb
                                                                                                                                           b%}~-'                     -.-•-••-A*#&.%*
          niobium content

                                                                                                                                            :< /mm
                                                                                                                                           Ay-". - "Ct,: • j
                                                                                                                                                                  '
Tp = 1 3 5 0 C               /At   8 / 5   =       12 s

                                                                                                                         1.0

                                                                                                            CTOD   ou
                                                                                                                -10 C
                                                                                                                 , 0.5

                Steel 4                                             Steel 8

                             Brittle fracture
                                   i
                                                                                                                     Steel           1   2   3    4    5     6      7         8     9    10
       p
                         /                               Pop-in

       J             i
                                                  P     fi'-\                                                          300
                                                                                                                        J                        At 8 / 5   :12 s
                                                                           ^        j Unloaded                     200
                                                                                                             CVN    o„
                                                                                                                -22 C
                     i
                     I                 I                                                                            f 100 .
                                                                                      \   1
     50k fa'                                    50kN[
           1                                               1mm
               1mm
                                       Vg
                                                               !                -    Vg
                                                                                                                          0                                               =7J^t>--:
               Specimen 4B3                                  Specimen 8C3                                            Steel           1   2   3    4    5     6      7         8     9    10

Fig. 25 — Examples of load/clip gauge records from the groove                                 weld      Fig. 26 — The small-scale CTOD results and the Charpy V-notch tough-
CTOD specimens of Steel 4 and Steel 8                                                                   ness at —22 "C for the simulated weld thermal specimens with a peak
                                                                                                        temperature of 1350°C and a cooling time of Ats/s = 12 s

coarse-grained z o n e of a real H A Z c o m -                               1) W e l d t h e r m a l simulation testing                                      References
p a r e d w i t h the single t e m p e r a t u r e simula-              identified t w o l o w toughness zones — t h e                       1. Nippon Steel Corporation Technical
t i o n . For Steel 2, the C h a r p y toughness is                     coarse-grained z o n e a n d the partially                       Symposium. Low Carbon Heavy Section Steel
still high at a peak t e m p e r a t u r e o f 1 2 5 0 ° C              transformed zone.                                                 for Offshore Applications. Stavanger, May 30,
(2282 °F), indicating that t h e high C T O D                                2) Shallow surface n o t c h e d C T O D                     1983.
values f r o m t h e g r o o v e w e l d testing may                    testing revealed high C T O D values, b u t                          2. Loberg, B., Nordgren, A., Strid, I., and
reflect that the size o f the brittle z o n e is                        m o s t specimens w e r e characterized w i t h                  Easterling, K. E. 1984. The role of alloy compo-
o f i m p o r t a n c e ; i.e., the small brittle z o n e               a p o p - i n o r final brittle f r a c t u r e initiating       sition on the stability of nitrides in Ti-microal-
in t h e coarse-grained H A Z at t h e w e l d                                                                                           loyed steels during weld thermal cycles. Metal-
                                                                        f r o m the l o w toughness zones.
                                                                                                                                         lurgical Trans. A 15A(1):33-41.
interface m a y b e of limited c o n s e q u e n c e .                       3) The influence of elements, such as
                                                                                                                                             3. Watanabe, I., Suzuki M., Tsukada, K.,
H o w e v e r , the significance of local brittle                       Ti, N, P, N b a n d Ni is discussed, a n d it is                 Yamazaki, Y., and Tokunaga, T. 1983. Devel-
zones w i t h respect t o the risk of failure of                        suggested that N a n d P m a y b e of m a j o r                  opment of NK-HIWEL Steels Suitable for High
w e l d e d structures should b e f u r t h e r eval-                   importance.                                                      Heat Input Welding. Nippon Kokan Technical
uated.                                                                      4) T h e r e f e r e n c e C - M n steel w a s at            Report, Overseas No. 38.
                                                                        least as brittle as the l o w - c a r b o n steel,                   4. McKeown, D., )udson, P., Apps, R. L.,
                                                                        a n d it is q u e s t i o n e d w h y n o l o w H A Z            Dumphrey, W . I. 1983. The weldability of low
Conclusions                                                             C T O D values w e r e r e c o r d e d in the c o m -            sulphur steels. Metal Construction (11):667-
                                                                                                                                         673.
                                                                        p r e h e n s i v e testing of this steel 10 years
     Nine m o d e r n l o w - c a r b o n m i c r o a l l o y e d                                                                            5. Thaulow, C , Paauw, A. )., Cunleiksrud,
                                                                        ago.
steels, d e l i v e r e d f o r recent applications in                                                                                   A., Naess, O. |. 1985. Heat affected zone
o f f s h o r e structures, and o n e C - M n steel,                                                                                     toughness of a low-carbon microalloyed steel.
used in the 1970's f o r o f f s h o r e p u r p o s e s ,                                                                               Metal Construction (2):94R-99R.
have b e e n e v a l u a t e d w i t h respect t o t h e                                                                                     6. Stout, R. D., McCeady, L. ). 1947.
f r a c t u r e toughness level in the heat-                                                                                             Metallurgical factors in the embrittlement of
                                                                                                                                         welded plate. Welding journal'26(11):683-s to
affected zone of weldments. The tough-
                                                                                          A ckno wledgments                              692-5.
ness w a s investigated by means o f w e l d
                                                                                                                                             7. Work in progress at SINTEF, Trondheim,
t h e r m a l simulation testing and surface                                T h e authors a c k n o w l e d g e the s u p p o r t        Norway.
fracture toughness testing. T h e results are                          f r o m the N o r w e g i a n Petroleum D i r e c t o r -             8. Private communication with The Weld-
as f o l l o w s :                                                     ate and f r o m M r . O . ). Naess.                               ing Institute and Det Norske Veritas.

                                                                                                                                 W E L D I N G RESEARCH S U P P L E M E N T 1279-s
You can also read