Feasibility of Agricultural Biomass Fly Ash Usage for Soil Stabilisation of Road Works - MDPI
←
→
Page content transcription
If your browser does not render page correctly, please read the page content below
materials
Article
Feasibility of Agricultural Biomass Fly Ash Usage for
Soil Stabilisation of Road Works
Ivana Barišić 1, *, Ivanka Netinger Grubeša 1 , Tihomir Dokšanović 1          and Berislav Marković 2
 1   Faculty of Civil Engineering and Architecture Osijek, Josip Juraj Strossmayer University of Osijek,
     Vladimira Preloga 3, 31000 Osijek, Croatia; nivanka@gfos.hr (I.N.G.); tdoksanovic@gfos.hr (T.D.)
 2   Department of Chemistry, University of Osijek, Cara Hadrijana street 8/A, 31000 Osijek, Croatia;
     bmarkovi@kemija.unios.hr
 *   Correspondence: ivana@gfos.hr; Tel.: +00385-31-544-697

 Received: 8 April 2019; Accepted: 26 April 2019; Published: 28 April 2019

 Abstract: Agricultural biomass ash is a waste material produced by incineration of residue from fields
 after harvesting crops. The use of agricultural biomass in industry produces large quantities of ash
 that represent an ecological problem. Another ecological problem is the dependency of road building
 on natural materials, which has been traditionally used for all pavement layers. Today, roads are
 built on less accessible and suitable terrains, increasing the need for improving the mechanical
 characteristics of locally available materials by various means of stabilisation. Within this research,
 three agricultural biomass fly ashes are used as lime substitutes for hydraulically stabilised soil.
 The purpose of this research is evaluation of potential use of agricultural biomass fly ash for the soil
 stabilisation of road works, i.e., for embankment and subgrade purposes. The results indicate that
 there is a potential of using barley, sunflower seed shells and wheat fly ash as lime substitutes in the
 soil stabilisation of road works. The strength characteristics of stabilised soil incorporating biomass
 fly ash are highly dependent on its chemical composition. Using a three-dimensional digital image
 correlation technique, it is concluded that the elastic properties of stabilised soil correlate to a fracture
 mechanism that can be efficiently defined by this modern research tool.

 Keywords: agricultural biomass ashes; stabilized soil; road construction; strength; elastic properties;
 3D digital image correlation technique

1. Introduction
     In Croatia, 52% of the total territory is agricultural land, with ~80% of the arable surface
under maize, wheat, soybean, sunflower, rapeseed, grapevine, olive, apple and plum cultivation [1].
This presents great potential for agricultural biomass usage in energy production but there is also
a need for sustainable waste management, since significant amounts of bio-ash will be generated.
     Agricultural biomass is a residue in the fields after harvesting crops that is then used to produce
energy in biomass power plants. Although a significantly lower quantity of ash is generated during
agricultural biomass combustion compared to coal, this ash is not being suitably managed and new
applications for it need to be found. Currently, waste from biomass incineration is being disposed of at
landfills, on farmland or in forests, most often without any control, which can cause environmental
pollution and potential human health risks [2].
     Road construction is the branch of civil engineering that is most dependent on natural material
availability. Simultaneously, increases in traffic loads and the need for building roads on less accessible
and suitable terrain result in a need to find new ways of locally available material usage, as well as
improving their mechanical characteristics. Consequently, the ash generated from agricultural biomass
incineration is being studied as a material for all pavement layers. Depending on its characteristics,

Materials 2019, 12, 1375; doi:10.3390/ma12091375                                  www.mdpi.com/journal/materials
Materials 2019, 12, 1375                                                                              2 of 12

ash can be utilised as a filler, as a replacement for small aggregate fractions, as a binder itself when it
contains active minerals (e.g., lime, calcium and magnesium silicate or alumina silicates), resulting
in hydraulic binding, or as a binder supplement or addition when it contains pozzolanic minerals
(e.g., glass, Portland, gypsum or clay minerals), which in combination with other materials leads to
a pozzolanic reaction [3]. For wearing course construction, biomass ash has been investigated for
both asphalt [4–6] and concrete [7,8] pavements. However, for both pavement systems, a good quality
subgrade is of high importance. Locally available soil is often not suitable for subgrade or embankment
construction, so different ways of stabilisation are used, most often by lime or cement.
      Due to its potential pozzolanic and hydraulic characteristics, there is a high potential of using
bio-ash in soil stabilisation for the specified purposes. The use of bottom ash from biomass (olive)
combustion reduces the expansion of expansive soils to the same extent as from treatment with lime,
as presented in [9]. Research results indicate that 6–8% cement and 10–15% rice husk ash are optimal
additions for residual soils from the viewpoints of plasticity, compaction, strength characteristics and
cost [10]. The stabilisation of alluvial soil by biomass ashes from rice husk and sugar cane bagasse
results in a plasticity index decrease with an increase in the proportion of ash from 2.5% to 12.5%,
with the optimal ash content for stabilisation reported to be 7.5% [11]. Admixing of rice husk ash,
bagasse ash and rice straw ash with soil results in a higher optimal moisture content as the dosages of
stabilisers increase [12]. The addition of the same ash to clayey soil at a concentration of 20–25% also
increased the California Bearing Ratio (CBR) values.
      Rice husk and sugarcane bagasse-based mixed biomass ash combined with hydrated lime as
an activator in clay resulted in an increase in compressive strength, as described in [13]. Similar results
are presented in [14], where the addition of bagasse ash to expansive soils results in CBR, compressive
strength and maximum dry density increases, as well as a swelling decrease [15]. Sugarcane straw ash
can also be an effective stabiliser for improving the geotechnical properties of lateritic soil samples [16].
The combination of wheat husk and sugarcane straw ash also positively influences the geotechnical
properties of soil [17]. Soil admixtures with coal fly ash and rice husk ash have the potential to improve
soil resistance to permanent deformation [18]. Biomass furnace ash from agricultural olive residues can
also be used as a filler material in road embankments [19]. In contrast, biomass fly ash of olive waste
used in [20] was found to be the least effective additive in the stabilisation of marl soil, which indicates
that its effectiveness could depend on the type of soil to be treated.
      Thus, the aim of this study is to identify possible applications of biomass ashes in order to promote
sustainable energy production from which it originates and to preserve natural resources and energy
needed for lime production. Namely, energy generated from the biomass production is currently the
fourth most common energy source in the European Union [1] and large quantities of waste biomass
ash are generated. Before recycling of biomass ashes as construction materials, detailed investigation
need to be conducted, demonstrating its acceptable level of performance and economical comparability
to traditional materials. Therefore, the purpose of this research is to define basic characteristics of
agricultural biomass ash for its potential earthwork application in road construction. This article reports
an experimental study of the properties of three biomass ashes used as additives to lime stabilised low
bearing soil for embankment and subgrade purposes.

2. Materials and Methods

2.1. Raw Materials
     The size distribution of used soil was determined according to standard EN ISO 17892-4 by
combination of sieving and hydrometer methods. The particle size distribution curve is presented
in Figure 1 and the density of soil used was 2.74 kg/dm3 . Specific surface area (SSA) of used soil
determined by the Brunauer, Emmett and Teller (BET) method according to standard ISO 9277 is
9760 cm2 /g.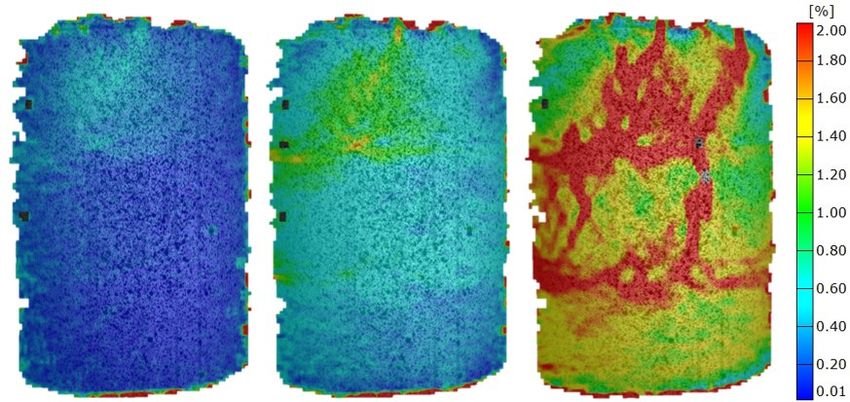
Materials 2019, 12, 1375 3 of 12
Materials 2019, 12, x FOR PEER REVIEW 3 of 12
Figure 1. Soil
Figure 1. Soil particle
particle size
size distribution
distribution curve.
curve.
The
The liquid
liquid and andplastic
plasticlimits
limitsofofthetheused
usedsoil,
soil,determined
determinedaccording
according to to
standard
standard ENEN ISO 17892-12,
ISO 17892-
were 34.5%
12, were and 21.9%,
34.5% respectively,
and 21.9%, with a with
respectively, plasticity index ofindex
a plasticity 12.5%.ofIt12.5%.
was classified as low plasticity
It was classified as low
clay-CL
plasticityaccording to the Unified
clay-CL according SoilUnified
to the Classification System (USCS).
Soil Classification System The(USCS).
optimal Thewater contentwater
optimal and
maximal dry density, determined by standard EN 13286-2, were 13% and 1.80 g/cm 3 , respectively.
content and maximal dry density, determined by standard EN 13286-2, were 13% and 1.80 g/cm3,
For soil stabilisation, CL 80 S hydrated calcium lime was used according to EN 459-1, with a density
respectively.
of 2.65 kg/dm 3 . SSA of used lime determined by the BET method according to standard ISO 9277 is
For soil stabilisation, CL 80 S hydrated calcium lime was used according to EN 459-1, with a
of /g.
16,671 2
densitycm 2.65 kg/dm3. SSA of used lime determined by the BET method according to standard ISO
9277As a binder
is 16671 cm2substitute,
/g. three biomass fly ashes were used. The oil factory Čepin uses sunflower
seed shells as a fuel during sunflower
As a binder substitute, three biomass oil production. Biomass
fly ashes were is burned
used. The oil within
factorythe furnace,
Čepin usesin a hot-air
sunflower
stream, andas
seed shells thea biomass
fuel during ash sunflower
produced for oil the purpose of
production. this research
Biomass is burned waswithin
collected
thefrom a specialized
furnace, in a hot-
landfill
air stream, and the biomass ash produced for the purpose of this research was collectedtried
within factory premises. In order to test some new energy resources, it has been fromasa
aspecialized
replacement landfill within factory premises. In order to test some new energy resources, it has seed
for sunflower seed shells by barley and wheat straws. Fly ash from sunflower been
shells (S), barley (B) and wheat straws (W) from this factory was used in
tried as a replacement for sunflower seed shells by barley and wheat straws. Fly ash from sunflowerthis study, with the chemical
composition
seed shells (S),of the used(B)
barley ashes
anddetermined
wheat straws in accordance
(W) from this with ISO/TSwas
factory 16996:2015
used in presented
this study,inwithTablethe
1.
The densities of the S, B and W ashes were 2.26, 2.23 and 2.36 kg/dm 3 , respectively, tested according to
chemical composition of the used ashes determined in accordance with ISO/TS 16996:2015 presented
standard
in Table 1.EN 1097-7.
The The SSA
densities of theforS,the S, B W
B and andashes
W ashes
werewas 33,740,
2.26, 34,080
2.23 and 2.36and 36,850
kg/dm cm2 /g, respectively,
3, respectively, tested
determined
according toby the BETEN
standard method
1097-7. according
The SSA to forstandard ISOW
the S, B and 9277.
ashes was 33740, 34080 and 36850 cm2/g,
respectively, determined by the BET method according to standard ISO 9277.
Table 1. Chemical composition of sunflower seed shells (S), barley (B) and wheat straw fly ash (W).
Table 1. Chemical composition
Oxidesof sunflower
(mas.%) seedSshells (S),Bbarley (B)
Wand wheat straw fly ash (W).
Oxides (mas.%) P2 O 5 18.71 S 4.40 6.70 B W
P 2O 5 Na2 O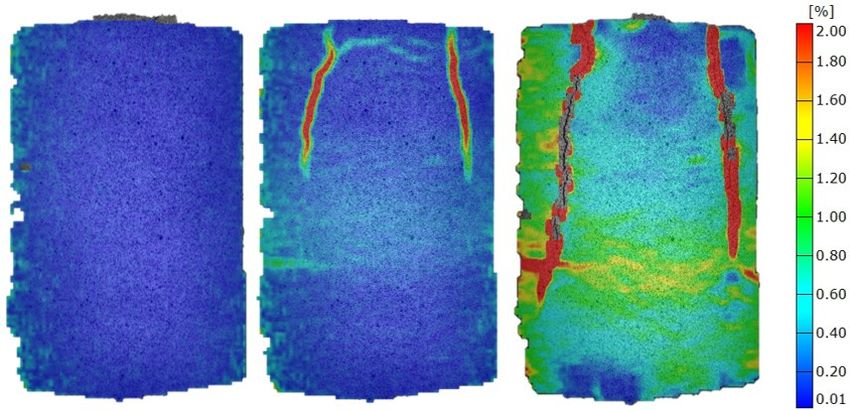
Materials 2019, 12, 1375 4 of 12
2.2. Sample Preparation and Strength Tests
Materials 2019, 12, x FOR PEER REVIEW 4 of 12
The optimal lime and ash portions were determined by standard ASTM D 6276-99a, measuring
the pH values of soil-lime
The optimal lime and and
ashsoil-lime-ash
portions weremixtures
determinedwithbyvarious
standardcontent
ASTMratios. It wasmeasuring
D 6276-99a, determined
the pH values of soil-lime and soil-lime-ash mixtures with various content ratios. It was
that the optimal lime content is 7% of the total dry mass of soil and the optimal lime/ash ratio is determined
that the After
80%/20%. optimal lime content
defining is 7% stabilised
the optimal of the totalsoil
drycomposition,
mass of soil and the optimaldry
the maximum lime/ash ratio
density is
(MDD)
and80%/20%. After defining
optimal water the optimal
content (OWC) werestabilised
determinedsoilaccording
composition, the maximum
to standard dry density
EN 13286-2. (MDD)
The specimens
and
were optimalatwater
prepared content (OWC)
their respective OWC were determined
and maximal according
dry density to standard
(MDD), measured ENafter
13286-2. The
compaction
specimens were prepared at their respective OWC and maximal dry density (MDD), measured
100 mm in diameter and 200 mm in height. Prepared specimens were cured for 28 days in a temperature after
compaction 100 mm in diameter and 200 mm in height. Prepared specimens were cured for 28 days
and moisture controlled chamber (20 ◦ C and 60% relative humidity). The compressive strength test
in a temperature and moisture controlled chamber (20 °C and 60% relative humidity). The
(according to standard EN 13286-41) and the 3D digital image correlation (DIC) were determined for
compressive strength test (according to standard EN 13286-41) and the 3D digital image correlation
these specimens. The CBR and linear swelling were determined according to standard EN 13286-47.
(DIC) were determined for these specimens. The CBR and linear swelling were determined according
2.3.toElastic
standard EN 13286-47.
Properties-3D Digital Image Correlation
DIC
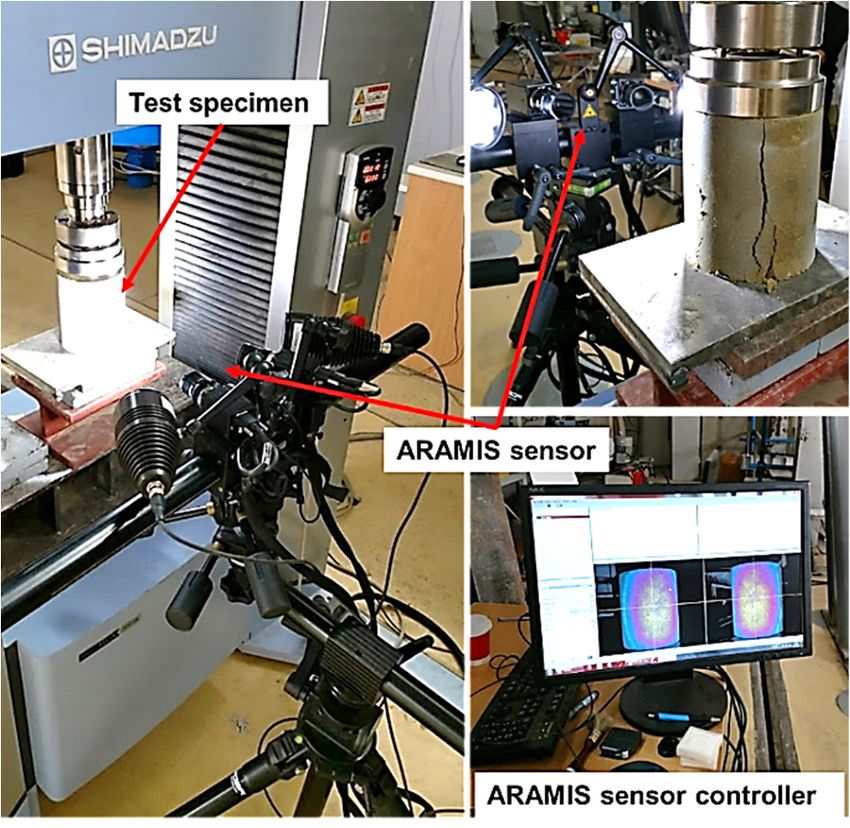
2.3. is a properties-3D
Elastic non-destructive, Digitalnon-contact method used for determination of loaded object surface
Image Correlation
deformation, i.e., it allows us to track displacements in a field of view of applied cameras (Figure 2).
DIC is a non-destructive, non-contact method used for determination of loaded object surface
It can be utilised
deformation, using
i.e., a single
it allows us tocamera (2D) or twoin
track displacements camera
a field (3D) setup,
of view and further
of applied cameras details
(Figureon2).this
method
It can be utilised using a single camera (2D) or two camera (3D) setup, and further details on this of
and its potential application are presented in [21]. Spatial DIC measurements for the purpose
thismethod
study wereand itsimplemented using a GOM
potential application Aramis 3D
are presented optical
in [21]. deformation
Spatial analysis system,
DIC measurements along with
for the purpose
its corresponding
of this study were software package.
implemented Specimens
using were monitored
a GOM Aramis 3D optical during compressive
deformation analysis testing, with the
system, along
force
withdata
its being suppliedsoftware
corresponding to the DIC system
package. via an output
Specimens channel ofduring
were monitored the utilised Shimadzu
compressive AG-X
testing,
universal testing machine, connecting deformation stages to corresponding frames. The system was
with the force data being supplied to the DIC system via an output channel of the utilised Shimadzu
set AG-X universal
to capture imagestesting machine,
with connecting
a frequency of 4deformation stages towhich
Hz, per camera, corresponding frames.
was suitable toThe system
obtain more
thanwas50set to capture
images (dataimages
points)with a frequency
in the of 4 Hz,
elastic range. peranalysis
The camera, of which was suitable
obtained to obtain
recordings morethe
enabled
than 50 images
determination (data points)
of elastic modulus in in
theaccordance
elastic range.with TheENanalysis
13286-43 of and
obtained recordings
insights into theenabled the
development
determination
of fracture mechanisms. of elastic modulus in accordance with EN 13286-43 and insights into the development
ofAlthough
fracture mechanisms.
classical, contact-based, instrumentation can provide data regarding the elastic modulus,
Although classical, contact-based, instrumentation can provide data regarding the elastic
such data is more prone to errors due to problems with adequate contact, concentration of deformation,
modulus, such data is more prone to errors due to problems with adequate contact, concentration of
gauge length influence, and so on. Additionally, such point-based instrumentation cannot provide
deformation, gauge length influence, and so on. Additionally, such point-based instrumentation
adequate information on the fracture mechanism, i.e., deformation concertation and propagation.
cannot provide adequate information on the fracture mechanism, i.e., deformation concertation and
By tracking the entire field of view, i.e., the entire visible surface, deformation results are more reliable
propagation. By tracking the entire field of view, i.e., the entire visible surface, deformation results
andarean more
adequate insight
reliable and into the phenomena
an adequate insight of deformation
into the phenomena distribution and redistribution
of deformation distribution with
andload
increase can be obtained.
redistribution These insights
with load increase can be ofThese
can be obtained. greatinsights
importancecan bewhen assessing
of great ductility
importance whenand
possible mechanisms of fracture for a certain material type.
assessing ductility and possible mechanisms of fracture for a certain material type.
Figure 2. Test setup for 3D digital image correlation (DIC) measurements.
Figure 2. Test setup for 3D digital image correlation (DIC) measurements.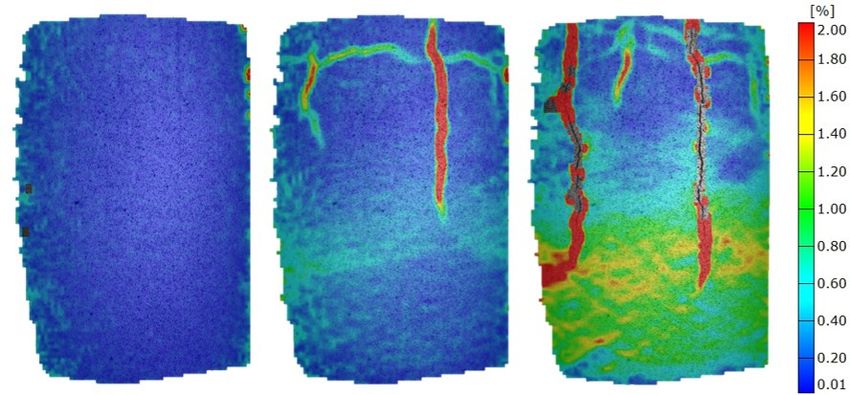
Materials 2019, 12, 1375                                                                            5 of 12
 Materials 2019, 12, x FOR PEER REVIEW                                                               5 of 12

3.3.Results
     Resultsand
             andDiscussion
                 Discussion
3.1. Geotechnical Characteristics
  3.1. Geotechnical Characteristics
      The addition of lime and fly bio-ashes S, B and W resulted in plasticity index decreases of 10.77%,
        The addition of lime and fly bio-ashes S, B and W resulted in plasticity index decreases of 10.77%,
11.09%, 11.20% and 10.60%, respectively, compared to the plasticity index of pure soil (CL) of 12.5%.
  11.09%, 11.20% and 10.60%, respectively, compared to the plasticity index of pure soil (CL) of 12.5%.
Compared to sole lime, the addition of wheat straw fly ash presents an additional reduction in plasticity
  Compared to sole lime, the addition of wheat straw fly ash presents an additional reduction in
index. This reduction in plasticity index is in line with results presented in [11] and results in a soil
  plasticity index. This reduction in plasticity index is in line with results presented in [11] and results
improvement in terms of higher stability and less swelling affinity. This is also confirmed by a linear
  in a soil improvement in terms of higher stability and less swelling affinity. This is also confirmed by
swelling test conducted in parallel to the CBR testing. The reductions in linear swelling with the
  a linear swelling test conducted in parallel to the CBR testing. The reductions in linear swelling with
addition of lime, S, B and W fly ash compared to non-stabilised soil (swelling of 5%) were 71.5%, 57.3%,
  the addition of lime, S, B and W fly ash compared to non-stabilised soil (swelling of 5%) were 71.5%,
44.7% and 24%, respectively.
  57.3%, 44.7% and 24%, respectively.
      The results for the optimal water content and maximal dry density measurements are presented
        The results for the optimal water content and maximal dry density measurements are presented
in Figures 3 and 4. All tested mixtures have similar standard Proctor compaction curves. All mixtures
  in Figures 3 and 4. All tested mixtures have similar standard Proctor compaction curves. All mixtures
show similar sensitive to moisture deviation, with the exception of wheat straw fly ash, which shows
  show similar sensitive to moisture deviation, with the exception of wheat straw fly ash, which shows
the lowest sensitivity due to its plane Proctor compaction curve [9].
  the lowest sensitivity due to its plane Proctor compaction curve [9].
      The addition of bio-ash results in an increase in the OWC and a decrease in the MDD. The addition
        The addition of bio-ash results in an increase in the OWC and a decrease in the MDD. The
of wheat straw fly ash results in the highest OWC (19.18%) and a significantly lower MDD compared
  addition 3of wheat straw fly ash results in the3highest OWC (19.18%) and a significantly lower MDD
(1.66 g/cm ) to pure soil3 (13.30% and 1.80 g/cm , respectively). This   also presents an improvement in
  compared (1.66 g/cm ) to pure soil (13.30% and 1.80 g/cm3, respectively). This also presents an
soil characteristics, since earth works may be done with more moisture in soil during the rainy season.
  improvement in soil characteristics, since earth works may be done with more moisture in soil during
The decrease in MDD may be due to the low specific gravity of bio-ash replacing higher specific gravity
  the rainy season. The decrease in MDD may be due to the low specific gravity of bio-ash replacing
lime [11,17], which is also confirmed by measuring SSA by the BET surface analyses. All used ashes
  higher specific gravity lime [11,17], which is also confirmed by measuring SSA by the BET surface
have significantly higher SSA compared to lime, as presented in Section 2.1. An increase in OWC
  analyses. All used ashes have significantly higher SSA compared to lime, as presented in Section 2.1.
is attributed to the pozzolanic reaction between fly ash and soil constituents, and the extra water
  An increase in OWC is attributed to the pozzolanic reaction between fly ash and soil constituents,
required for higher fineness in fly ash (highest SSA and SiO2 for W ash) and the subsequent enhanced
  and the extra water required for higher fineness in fly ash (highest SSA and SiO2 for W ash) and the
hydration [22]. The decrease in density was directly attributed to the flocculation/aggregation and
  subsequent enhanced hydration [22]. The decrease in density was directly attributed to the
the formation of cementitious products [12]. The reduction in MDD is attributed to the lower specific
  flocculation/aggregation and the formation of cementitious products [12]. The reduction in MDD is
gravity of fly ash and lime compared to compacted soil [15].
  attributed to the lower specific gravity of fly ash and lime compared to compacted soil [15].

                               Figure3.3.Standard
                              Figure      StandardProctor
                                                   Proctorcompaction
                                                           compactiontest
                                                                       testresults.
                                                                             results.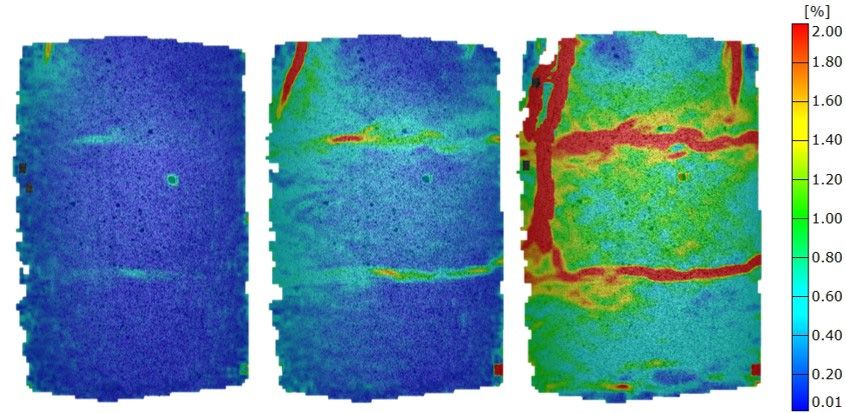
Materials 2019, 12, x FOR PEER REVIEW 6 of 12
Materials2019,
Materials 12, x1375
2019, 12, FOR PEER REVIEW 6 6ofof12
12
Figure 4. Compaction characteristics.
Figure 4. Compaction characteristics.
3.2. Strength Characteristics Figure 4. Compaction characteristics.
3.2. Strength Characteristics
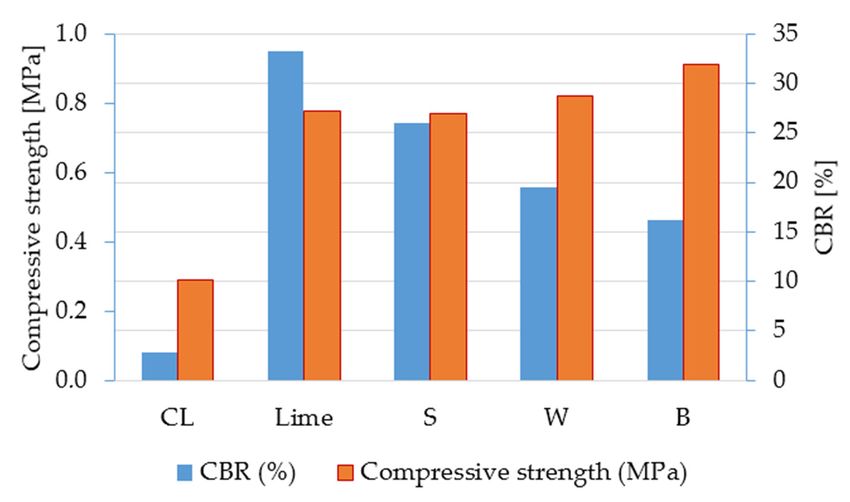
The results
3.2. Strength of uniaxial compressive strength testing are presented in Figure 5. It can be seen that
Characteristics
The of
addition results
bio-ashof uniaxial
results in compressive
an increasestrength testing are
in compressive presented
strength. The in Figurecompressive
highest 5. It can be seen that
strength
is The results
addition
obtained of bio-ashof uniaxial
for barleyresults compressive
in
fly ash,anwith
increase
a 17% strength
in increase testing
compressive are presented
strength.
in comparison The in Figure
highest
to pure lime 5. It can bestrength
compressive
stabilised seenand
soil thatis
a
addition
obtained of
forbio-ash
barley results
fly ash,in an
with increase
a 17% in
increasecompressive
in strength.
comparison to The
pure
213% increase in comparison to non-stabilised soil. As presented in Table 1, barley fly ash has the highest
lime compressive
stabilised soil andstrength
a 213%
is obtained
increase
highest Kin2O for barley with
comparison
content, fly ash, with a 17%
to non-stabilised
a notably soil.increase
high in comparison
As 2presented
SiO content, in 1,tobarley
pure fly
Tablecontributes
which limeashstabilised
to hasdevelopment
the soil and
the highest K2ofa
O
213%
strengthincrease
content, with
through ainnotably
comparison
an alkalihigh to 2non-stabilised
SiO
silicate content,
(K2O) and which soil. As presented
contributes
pozzolanic to the
reaction in
(SiO Table
development1, barley
2, particularly itsflyreactive
of strength ash through
hasform
the
highest
an alkali
[23]). K 2 O content,
silicate (K
Although with a notably
2 O) and pozzolanic
sunflower seed ash has high SiO
reaction 2 content,
the (SiO which
2 , particularly
highest contributes
CaO and its MgO reactiveto the development
formthe
content, [23]). Although
determined of
strength
compressivethrough
sunflower seed an alkali
ash has the
strengths silicate
werehighest (K 2 O)
CaO and
the lowest, and pozzolanic
MgO could
which content, reaction
bethe (SiO
determined
attributed 2 , particularly
compressive
to low its reactive
SiO2 andstrengths
high freeform
were
or
[23]).
the Although
lowest, which sunflower
could
reactive CaO content [23]. be seed
attributed ash tohas
low the
SiO highest
2 and highCaOfree and
or MgO
reactive content,
CaO the
content determined
[23].
compressive strengths were the lowest, which could be attributed to low SiO2 and high free or
reactive CaO content [23].
Figure 5. Results of CBR and compressive strength tests.
The addition of bio-ash unexpectedly resulted in the soaked CBR values decreasing in comparison
to lime stabilised soil. The Figure
lowest5. Results
CBR valueof CBR and compressive
is obtained with the strength
additiontests.
of barley fly ash. The alkali
silicate reaction within mixtures with lime-barley fly ash is not activated because K2 O from fly ash is
The addition Figure 5.unexpectedly
of bio-ash Results of CBR resulted
and compressive
in the strength tests.
dissolved in water under soaked conditions (sample immerged insoaked
water forCBR96 hvalues decreasing
prior to in
CBR testing).
comparison
As reported to in lime
[24], stabilised
the presencesoil.ofThe
K2 Olowest
in flyCBR value is obtained
ash increased with theproperty,
its dissolution additionand
of barley fly
a similar
ash. The alkali
addition of reaction
bio-ash within
unexpectedly resulted in the soaked CBR values decreasing in
The silicate mixtures with lime-barley fly ash is not activated
report is presented in [25]. Additionally, under soaked conditions, the destruction of capillary forces2O because K is
comparison
from fly ash to dissolved
lime stabilised soil.under
The lowest CBR value is(sample
obtained with the in addition of barley fly
attributed toisbeing one ofinthewater
reasons forsoaked
lower CBRconditions
values [26]. Theimmerged
affirmation of water
thesefor 96 h prior
conclusions
ash.
to Thetesting).
CBR alkali silicate reaction within mixtures with of Klime-barley fly ash is not activated because K2O
was verified by As reported
measuring ainbarley
[24], the
flypresence
ash mixture 2O in fly ash increased its dissolution property,
CBR over a three-day soaking period (instead
from
and fly ash
a similar is dissolved
report in water
is samples).
presented A under
inCBR soaked
[25]. of conditions
Additionally, (sample
under soaked immerged in waterdestruction
conditions, for 96 h prior
of four as for all other 19% was obtained, significantly higherthe
compared to the of
to CBR testing). As reported in [24], the presence of K2O in fly ash increased its dissolution property,
and a similar report is presented in [25]. Additionally, under soaked conditions, the destruction of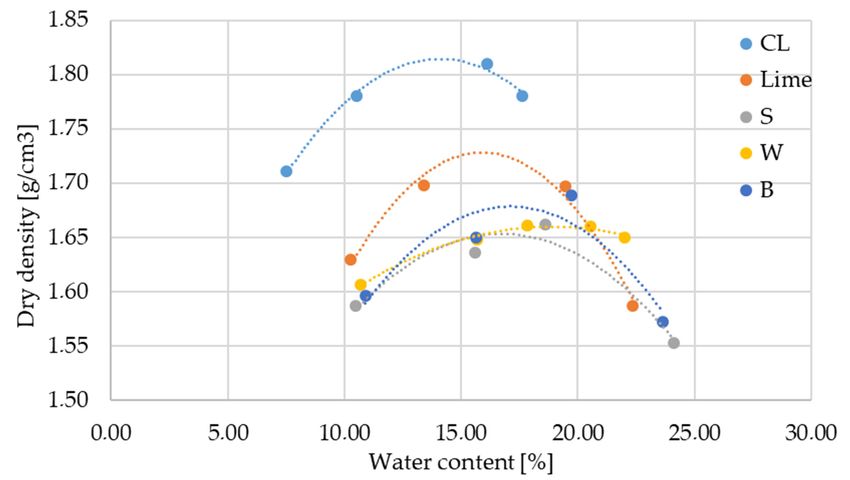
Materials 2019, 12, x FOR PEER REVIEW 7 of 12
capillary forces is attributed to being one of the reasons for lower CBR values [26]. The affirmation of
Materials 2019, 12, 1375 7 of 12
these conclusions was verified by measuring a barley fly ash mixture CBR over a three-day soaking
period (instead of four as for all other samples). A CBR of 19% was obtained, significantly higher
comparedsoaking
four-day to the four-day
period ofsoaking
16%. Theperiod of 16%.
fly ash The was
content fly ash content was
determined determined
as the mass% ofastotal
the mass%
binder
of total binder
content. Due tocontent.
the lowerDue to the lower
density and higherdensity
SSA and
of higher SSA
all used of all
ashes used ashes
compared compared
to lime, to lime,
ash occupies
ash occupies
more more the
space within space withinAthe
sample. sample.
certain A certain
amount of flyamount
ash mayofnot flypartake
ash may innot partake
strength in strength
development
development reactions, reducing bonds in the
reactions, reducing bonds in the soil–ash mixtures [11]. soil–ash mixtures [11].
Within this
Within this research,
research, thethe optimal
optimal flyfly ash
ash content
content was
was determined
determined as as the
the mass
mass percentage
percentage ofof lime
lime
by measuring the pH of soil–lime–fly ash mixtures, according to ASTM D 6276-99a.
by measuring the pH of soil–lime–fly ash mixtures, according to ASTM D 6276-99a. Due to trends Due to trends in
compressive
in compressive strength
strength andandCBR
CBR test
testresults,
results,ititcan
canbebeconcluded
concludedthat that this
this method
method should take into
should take into
account chemical composition, density and specific surface area of all constituents
account chemical composition, density and specific surface area of all constituents in order to properly in order to
properly define the optimal binder content. Additionally, the optimal bio-ash
define the optimal binder content. Additionally, the optimal bio-ash content should be determined by content should be
determined
volume by volume
percentage percentage
rather than massrather than mass percentage.
percentage.
3.3. Elastic Properties and Fracture Mechanism
mechanistic-based pavement design, which relies on the elastic theory, elastic
For an effective mechanistic-based elastic
mechanical properties
mechanical propertiesare arerequired,
required, including
including thethe Young´s
Young’s modulus
modulus of elasticity
of elasticity (E) Poisson’s
(E) and and Poisson’s
ratio
ratioThe
(ν). (ν). The modulus
elastic elastic modulus
as a measureas of a soil
measure
stiffnessofissoil stiffnessasisstress
determined determined as stress to
to the corresponding the
strain
corresponding
ratio in the rangestrain ratio
of elastic inbehaviour.
soil the rangeFor of practical
elastic soil behaviour.
design Forvarious
situations, practical designcorrelations
empirical situations,
various
to empirical
CBR values correlations
are used to CBR
to calculate E, asvalues
can beare usedinto[27–29].
found calculate E, as can
However, due betofound
unusualin [27–29].
aspects
However,
of behaviour dueandto unusual
based onaspects
results of behaviour
obtained and based
on bio-ash on results
stabilised soil,obtained on bio-ash
as elaborated in the stabilised
previous
soil, as elaborated
sections, in the previous
E was measured sections, E was
during compressive measured
strength during
testing. compressive
In order to obtainstrength
the mosttesting.
accurate In
order to
results andobtain the most
to eliminate accurate
problems withresults andconditions
surface to eliminateandproblems with surface conditions
adequate specimen-instrument and
contact
adequate specimen-instrument
throughout loading [21], rigid ring contact throughout
extensometers loading by
are replaced [21], rigid ring
“virtual” extensometers
extensometers, are
i.e., DIC.
replaced
Such by “virtual”highlights
an application extensometers, i.e., DIC.
the primary Such an application
advantages of utilisinghighlights
a 3D DICthe primary
system, theadvantages
possibility
of monitor
to utilising stress
a 3D DICand system,
strain ofthe
anpossibility
entire surface,to monitor
and thestress and strain
possibility to gainof an entireinto
insight surface, and the
deformation
possibility toand
distribution gainredistribution
insight into deformation distribution
with load increase. Thisand
is aredistribution
new application withofload increase.
3D DIC sinceThis
it hasis
a new application of 3D DIC since it has been used
been used within research of active arching effect in soil [30]. within research of active arching effect in soil [30].
Young´s modulus
The results of the Young’s modulus calculation
calculation areare presented
presented in in Figure
Figure 6.
6. Among the stabilised
mixtures, the one with barley fly ash has the highest E, while the lowest E is recorded recorded forfor mixtures
mixtures
with wheat
with wheat fly
fly ash.
ash. The causality of such results is directly associated with the analysis of fracture fracture
mechanisms for each each ofof the
the mixtures.
mixtures.
Figure 6. Results of modulus of elasticity test.
Figure 6. Results of modulus of elasticity test.
Mixtures with barley fly ash exhibit a high degree of homogeneity, which is evident from the
absence of concentrations of deformation at 30% of maximum force (Fmax ), and successful redistribution
of strain to the rest of the sample, even when clear indicators of fracture mechanism formulation at 60%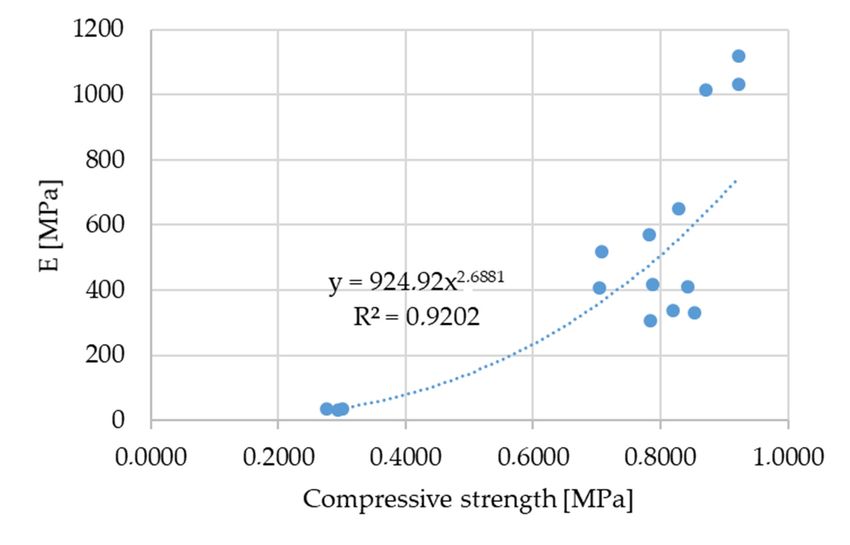
Materials
Materials 2019,
2019, 12,
12, xx FOR
FOR PEER
PEER REVIEW
REVIEW 88 of
of 12
12
Mixtures
Mixtures with with barley
barley flyfly ash
ash exhibit
exhibit aa high
high degree
degree of of homogeneity,
homogeneity, which which is is evident
evident from
from the
the
absence
Materials of
2019, concentrations
12, 1375 of deformation at 30% of maximum
absence of concentrations of deformation at 30% of maximum force (Fmax), and successful force (F max), and successful 8 of 12
redistribution of strain to the rest of the sample, even when clear indicators
redistribution of strain to the rest of the sample, even when clear indicators of fracture mechanism of fracture mechanism
formulation
formulation at at 60%
60% ofof FFmax are revealed. Areas of concentrated deformation in the form of vertical
max are revealed. Areas of concentrated deformation in the form of vertical
of Fmaxopen
cracks are revealed. Areas of increases
concentrated deformation in theFform of vertical
cracks cracks open slowly with
cracks open slowly with load increases and
slowly with load and at at loads
loads closer
closer to
to Fmax these are very clear and have
max these cracks are very clear and have
load increases
aa progressive and at loads closer to F max these cracks are very clear and have a progressive propagation
progressive propagation
propagation untiluntil fracture
fracture (Figure
(Figure 7).7). High
High homogeneity
homogeneity could could be be the
the result
result of
of barley
barley
until
fly ashfracture
adequate (Figure
SSA 7).
and High homogeneity
highest MDD could
comparing betothe result
other of
tested barley
ashes fly
but ash
alsoadequate
the most SSA and
proper
fly ash adequate SSA and highest MDD comparing to other tested ashes but also the most proper
highest
way MDD comparing to other tested ashes but also the most proper way of sample preparation.
way ofof sample
sample preparation.
preparation.
When wheat
When wheat flyash ash isused
used at60% 60% of Fmax , there
are are no clearly defined strain concentrations,
When wheat fly fly ash is
is used at at 60% of of FFmax , there no clearly defined strain concentrations,
max, there are no clearly defined strain concentrations, but
but
but
there there are horizontal areas (layers) with prominent deformations. With a load increase,
there are
are horizontal
horizontal areas
areas (layers)
(layers) withwith prominent
prominent deformations.
deformations. With With aa loadload increase,
increase, these
these
these prominent
prominent deformations transform into horizontal cracks, which are additionally pronounced
prominent deformations transform into horizontal cracks, which are additionally pronounced and
deformations transform into horizontal cracks, which are additionally pronounced and
and intersected with
intersected vertical cracks at F.max . Such a fracture mechanismclearlyclearlypoints
pointsto to horizontal
horizontal
intersected withwith vertical
vertical cracks
cracks at at FFmax Such a fracture mechanism
max. Such a fracture mechanism clearly points to horizontal
inhomogeneity, which is
inhomogeneity, is a result of of sample preparation
preparation (three layers layers during Proctor
Proctor compaction),
inhomogeneity, which which is aa result
result of sample
sample preparation (three (three layers during
during Proctor compaction),
compaction),
and
and which is consequently reflected in the elastic modulus value being the lowest of stabilised
stabilised soils
and which
which is is consequently
consequently reflected
reflected in in the
the elastic
elastic modulus
modulus value
value being
being the
the lowest
lowest of of stabilised soils
soils
(Figure 8).
(Figure 8).
(Figure 8).
(a)
(a) (b)
(b) (c)
(c)
Figure
Figure 7.7. Mises
Mises strain
strain at
at various load
various load stages
load stages of
stages of mixtures
ofmixtures with
mixtureswith barley
withbarley fly
barleyfly ash.
flyash. (a)
ash.(a) 0.3
0.3FFFmax
(a)0.3 max; (b) 0.6 Fmax;
max;; (b)
(b) 0.6
0.6 FFmax
max;;
(c) 1.0 Fmax.
(c) 1.0 F max. .
max
(a)
(a) (b)
(b) (c)
(c)
Figure
Figure 8.
Figure 8. Mises
Mises strain
Mises strain at
strain at various
various load
load stages
stages of mixtures
ofmixtures with
mixtureswith wheat
withwheat fly
wheatfly ash.
flyash. (a)
ash.(a) 0.3
(a)0.3 max; (b) 0.6 F
0.3FFFmax Fmax
max; (b) 0.6 Fmax
;;
max;
(c)
(c) 1.0
1.0 Fmax
(c) 1.0 Fmax .
max.
.
Materials 2019, 12, 1375                                                                                                    9 of 12

Materials 2019, 12, x FOR PEER REVIEW                                                                                     9 of 12
Materials 2019, 12, x FOR PEER REVIEW                                                                                     9 of 12
      Soil stabilised with sunflower shows no significant signs of dominant deformation areas at 30%
     Soil stabilised with sunflower shows no significant signs of dominant deformation areas at 30%
     Soil, stabilised
 of Fmax   and at 60% with
                        of Fsunflower
                              max , thereshows   no significant
                                           are clear indicators signs of dominant
                                                                of horizontal   and deformation    areas
                                                                                     vertical cracks     at 30%
                                                                                                      (Figure  9).
of Fmax, and at 60% of Fmax, there are clear indicators of horizontal and vertical cracks (Figure 9). The
of Fmax
 The    , and atmechanism
     fracture    60% of Fmaxpresents
                              , there are  clear indicators
                                        a combination       of horizontal
                                                       of mechanisms       and vertical
                                                                       obtained         cracks (Figure
                                                                                  on specimens           9). with
                                                                                                 stabilised  The
fracture mechanism presents a combination of mechanisms obtained on specimens stabilised with
fracture
 barley andmechanism    presents
              those stabilised      a combination
                                 with  wheat. This of  mechanisms
                                                     coincides       obtained
                                                               with the  elastic on specimens
                                                                                 modulus        stabilised
                                                                                           results          with
                                                                                                   of sunflower
barley and those stabilised with wheat. This coincides with the elastic modulus results of sunflower
barley
 mixturesandbeing
             thosebetween
                    stabilised
                             thewith
                                  otherwheat.  This coincides with the elastic modulus results of sunflower
                                         two mixtures.
mixtures being between the other two mixtures.
mixtures being between the other two mixtures.

                   (a)                                         (b)                                        (c)
                   (a)                                         (b)                                        (c)
     Figure
      Figure 9. 9. Mises   strain at
                   Mises strain   atvarious
                                     variousload
                                              loadstages
                                                    stages
                                                         of of mixtures
                                                            mixtures    with
                                                                     with    sunflower
                                                                          sunflower      fly ash.
                                                                                    fly ash.      (a)F 0.3 ;F(b)
                                                                                             (a) 0.3          max;0.6
                                                                                                                   (b)F 0.6 ;
     Figure 9. Mises strain at various load stages of mixtures with sunflower fly ash. (a) max         0.3 Fmax; (b) max0.6
     F(c) ; (c)F1.0
       max1.0   maxF. max.
     Fmax; (c) 1.0  Fmax.

      Lime stabilised
      Lime  stabilised mixtures
                       mixtures exhibit
                                 exhibit no
                                          no clear
                                             clear localisation
                                                   localisation of deformations
                                                                     deformations at 30% of Fmax
                                                                                               max, ,with
                                                                                                     withonly
                                                                                                           only
      Lime stabilised mixtures exhibit no clear localisation of deformations at 30% of Fmax, with only
 slight changes
slight  changes at 60% of Fmax  (Figure10).
                           max (Figure  10).AtAtloads
                                                 loadsnear
                                                       nearFFmax, a, acombination
                                                              max      combinationofofhorizontal
                                                                                       horizontaland
                                                                                                  andvertical
                                                                                                        vertical
slight changes at 60% of Fmax (Figure 10). At loads near Fmax, a combination of horizontal and vertical
 concentrations  appears, which   is similar to sunflower  mixtures,
concentrations appears, which is similar to sunflower mixtures,         although less emphasised.
concentrations appears, which is similar to sunflower mixtures, although less emphasised.

                   (a)                                         (b)                                         (c)
                   (a)                                         (b)                                         (c)
     Figure 10. Mises strain at various load stages of mixtures with lime. (a) 0.3 Fmax; (b) 0.6 Fmax; (c) 1.0
     Figure
      Figure 10.
              10.Mises
                   Misesstrain at at
                          strain  various load
                                     various   stages
                                             load     of mixtures
                                                  stages          withwith
                                                         of mixtures   lime. (a) 0.3
                                                                           lime.   (a)Fmax
                                                                                       0.3; (b)
                                                                                            Fmax0.6 Fmax0.6
                                                                                                 ; (b)   ; (c)Fmax
                                                                                                               1.0 ;
     Fmax.
     F(c)
       max1.0
          . Fmax .

     For non-stabilised soil, failure occurs as a complete collapse of the sample with horizontal,
     For non-stabilised soil, failure occurs as a complete collapse of the sample with horizontal,
vertical and inclined cracks along the whole sample height, with no clear fracture planes. Fields of
vertical and inclined cracks along the whole sample height, with no clear fracture planes. Fields of
pronounced strains can be perceived as early as 30% of Fmax and there is a noticeable grouping of
pronounced strains can be perceived as early as 30% of Fmax and there is a noticeable grouping of
deformation in horizontal bands that coincides with the layered sample preparation procedure
deformation in horizontal bands that coincides with the layered sample preparation procedure
(Figure 11).
(Figure 11).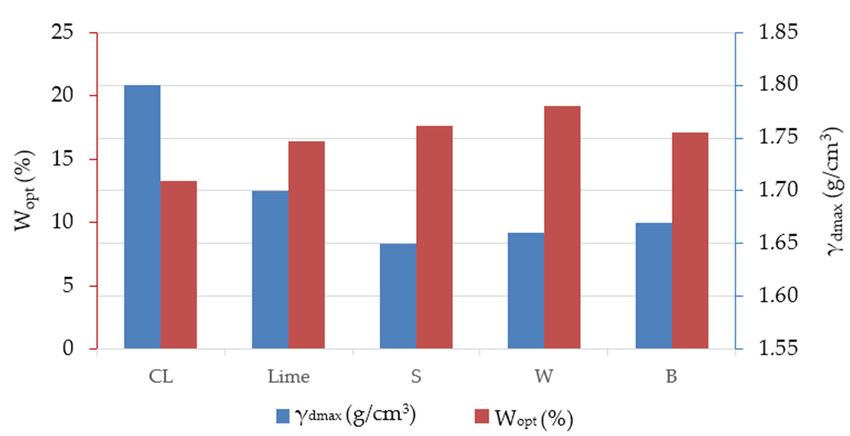
Materials 2019, 12, 1375                                                                                              10 of 12

      For non-stabilised soil, failure occurs as a complete collapse of the sample with horizontal, vertical
and inclined cracks along the whole sample height, with no clear fracture planes. Fields of pronounced
strains can be perceived as early as 30% of Fmax and there is a noticeable grouping of deformation in
horizontal
Materials 2019,bands   that
                12, x FOR   coincides
                          PEER REVIEWwith the layered sample preparation procedure (Figure 11). 10 of 12

                    (a)                                     (b)                                       (c)

      Figure 11.
     Figure        Misesstrain
               11. Mises strain at
                                at various             of mixtures
                                   various load stages of mixtures with
                                                                   withno
                                                                        nostabilisation.
                                                                           stabilisation.(a)
                                                                                          (a)0.3
                                                                                              0.3FFmax
                                                                                                    max; (b) 0.6 Fmax
                                                                                                                  max; ;

     (c) 1.0
     (c) 1.0 FFmax
               max..

       In order
      In  order to topredict
                      predictthe
                               theYoung´s
                                   Young’s elastic
                                              elastic modulus
                                                      modulus of of elasticity
                                                                    elasticity of
                                                                               of stabilised
                                                                                  stabilised soil,
                                                                                              soil, the
                                                                                                     thecorrelation
                                                                                                         correlation with
                                                                                                                     with
the 28-day compressive strength is presented in Figure 12. There is a strong correlation between EE
 the 28-day     compressive     strength   is presented    in Figure   12.  There  is a strong  correlation    between
 and the
and   the 28-day
           28-day compressive
                     compressive strength.
                                    strength. Measurements
                                                Measurementsof    ofthe
                                                                      the28-day
                                                                          28-daycompressive
                                                                                   compressivestrength
                                                                                                  strengthas asrelatively
                                                                                                                relatively
 simple tests
simple    tests could
                 could be
                        be used
                            used for
                                  for EE prediction
                                         prediction asas an
                                                         an alternative
                                                             alternative to
                                                                          to CBR
                                                                             CBR testing.
                                                                                   testing. However,
                                                                                             However, the thecorrelations
                                                                                                              correlations
presented here
presented      here are
                     are results
                          results of
                                   of research
                                      research executed
                                                 executed on on aa limited
                                                                   limited number
                                                                             number of  of biomass
                                                                                           biomass ashash stabilized
                                                                                                           stabilized soil
                                                                                                                       soil
 mixtures. In
mixtures.     Inorder
                  ordertotoset
                            setgeneral
                                generalconclusions,
                                          conclusions,moremoretests
                                                                testsare
                                                                       areto
                                                                           tobe
                                                                              beconducted
                                                                                 conductedon  ondifferent
                                                                                                 different biomass
                                                                                                             biomass ash
                                                                                                                       ash
 and soil
and   soil types,
            types, and lime contents.

                               Figure 12. E to 28-day compressive strength correlation.
                              Figure 12. E to 28-day compressive strength correlation.

4. Conclusions
    The results indicate that there is potential for using barley, sunflower seed shells and wheat fly
ash as lime substitutes in soil stabilisation for road works. Based on the results, the following
conclusions can be drawn:
Materials 2019, 12, 1375 11 of 12
4. Conclusions
The results indicate that there is potential for using barley, sunflower seed shells and wheat fly ash
as lime substitutes in soil stabilisation for road works. Based on the results, the following conclusions
can be drawn:
• A lime/biomass fly ash binder improved the geotechnical characteristics of low plasticity clay by
reducing the plasticity index and linear swelling and increasing the optimal moisture content.
• When evaluating the potential application of biomass fly ash as a binder substitute, its chemical
composition needs to be considered.
• The addition of biomass fly ash results in a soaked CBR value decrease and a compressive
strength increase.
• The strength characteristics of stabilised soil incorporating biomass fly ash are highly dependent
on its chemical composition.
• The elastic properties of stabilised soil correlate to a fracture mechanism.
• Using a 3D digital image correlation technique as a modern research tool can be efficiently used for
fracture mechanism and elastic properties analyses of hydraulically stabilised soil for road works.
• There is a strong correlation between Young’s modulus of elasticity and compressive strength,
which can be used for its prediction for pavement design purposes.
Author Contributions: Conceptualization, I.B. and I.N.G.; methodology, I.B. and T.D.; validation, I.B.; I.N.G. and
B.M.; investigation, I.B. and T.D.; writing—original draft preparation, I.B.; writing—review and editing, I.N.G.;
T.D. and B.M.; funding acquisition, I.N.G.
Funding: This research was funded by Interreg IPA Cross-border Cooperation Programme Croatia-Serbia
2014-2020; Agricultural Waste–Challenges and Business Opportunities, Eco build project.
Conflicts of Interest: The authors declare no conflict of interest. The funders had no role in the design of the
study; in the collection, analyses, or interpretation of data; in the writing of the manuscript, or in the decision to
publish the results.
References
1. Bilandžija, N.; Voća, N.; Jelcic, B.; Jurišić, V.; Matin, A.; Grubor, M.; Krička, T. Evaluation of Croatian
agricultural solid biomass energy potential. Renew. Sustain. Energy Rev. 2018, 93, 225–230. [CrossRef]
2. Carević, I.; Banjad Pečur, I.; Štirmer, N.; Milovanović, B.; Baričević, A. Potencijal biopepela i stanje u Republici
Hrvatskoj. In Proceedings of the Sabor hrvatskih graditelja 2016—EU i hrvatsko graditeljstvo, Cavtat, Croatia,
17–18 November 2016.
3. Vassilev, S.V.; Baxter, D.; Andersen, L.K.; Vassileva, C.G. An overview of the composition and application of
biomass ash. Fuel 2013, 105, 19–39. [CrossRef]
4. Melotti, R.; Santagata, E.; Bassani, M.; Salvo, M.; Rizzo, S. A preliminary investigation into the physical and
chemical properties of biomass ashes used as aggregate fillers for bituminous mixtures. Waste Manag. 2013,
33, 1906–1917. [CrossRef]
5. Arabani, M.; Tahami, S.A. Assessment of mechanical properties of rice husk ash modified asphalt mixture.
Constr. Mater. 2017, 149, 350–358. [CrossRef]
6. Tahami, S.A.; Arabani, M.; Mirhosseini, A.F. Usage of two biomass ashes as filler in hot mix asphalt.
Constr. Mater. 2018, 170, 547–556. [CrossRef]
7. Shrivas, A.; Jain, D.; Joshi, R. Application of Different Waste in Concrete as a Partial Replacement of Cement.
Int. J. Sci. Technol. Eng. 2015, 2, 89–107.
8. Aksogan, O.; Binici, H.; Ortlek, E. Durability of concrete made by partial replacement of fine aggregate by
colemanite and barite and cement by ashes of corn stalk, wheat straw and sunflower stalk ashes. Constr. Mater.
2016, 106, 253–263. [CrossRef]
9. Cabrera, M.; Rosales, J.; Ayuso, J.; Estaire, J.; Agrela, F. Feasibility of using olive biomass bottom ash in the
sub-bases of roads and rural paths. Constr. Mater. 2018, 181, 266–275. [CrossRef]
10. Basha, E.; Hashim, R.; Mahmud, H.; Muntohar, A. Stabilization of residual soil with rice husk ash and cement.
Constr. Mater. 2005, 19, 448–453. [CrossRef]Materials 2019, 12, 1375 12 of 12
11. Yadav, A.K.; Gaurav, K.; Kishor, R.; Suman, S. Stabilization of alluvial soil for subgrade using rice husk ash,
sugarcane bagasse ash and cow dung ash for rural roads. Int. J. Pavement Res. Technol. 2017, 10, 254–261.
[CrossRef]
12. Anupam, A.K.; Kumar, P.; Ransinchung, G.D. Use of Various Agricultural and Industrial Waste Materials in
Road Construction. Procedia -Soc. Behav. Sci. 2013, 104, 264–273. [CrossRef]
13. Chaunsali, P.; Uvegi, H.; Osmundsen, R.; Laracy, M.; Poinot, T.; Ochsendorf, J.; Olivetti, E. Mineralogical and
microstructural characterization of biomass ash binder. Cem. Concr. Compos. 2018, 89, 41–51. [CrossRef]
14. Kharade, A.S.; Suryavanshi, V.V.; Gujar, B.S.; Deshmukh, R.R. Waste product ‘bagasse ash’ from sugar
industry can be used as stabilizing material for expansive soils. Int. J. Res. Eng. Technol. 2014, 3, 506–512.
15. Hasan, H.; Dang, L.; Khabbaz, H.; Fatahi, B.; Terzaghi, S. Remediation of Expansive Soils Using Agricultural
Waste Bagasse Ash. Procedia Eng. 2016, 143, 1368–1375. [CrossRef]
16. Amu, O.; Ogunniyi, S.; Oladeji, O. Geotechnical properties of lateritic soil stabilized with sugarcane straw
ash. Am. J. Sci. Ind. 2011, 2, 323–331. [CrossRef]
17. Singh, M.; Sharma, R. Soill stabilization using industrial waste (wheat husk and sugarcane straw ash). Int. J.
Res. Eng. Technol. 2017, 4, 589–596.
18. Anupam, A.K.; Kumar, P.; Ransinchung, R. Effect of Fly Ash and Rice Husk Ash on Permanent Deformation
Behaviour of Subgrade Soil under Cyclic Triaxial Loading. Transp. Procedia 2016, 17, 596–606. [CrossRef]
19. Cabrera, M.; Galvin, A.P.; Agrela, F.; Carvajal, M.D.; Ayuso, J. Characterisation and technical feasibility of
using biomass bottom ash for civil infrastructures. Constr. Mater. 2014, 58, 234–244. [CrossRef]
20. Sol-Sánchez, M.; Castro, J.; Ureña, C.; Azañón, J.M. Stabilisation of clayey and marly soils using industrial
wastes: pH and laser granulometry indicators. Eng. Geol. 2016, 200, 10–17. [CrossRef]
21. Barišić, I.; Dokšanović, T.; Draganić, H. Characterization of hydraulically bound base materials through
digital image correlation. Constr. Build. Mater. 2015, 83, 299–307. [CrossRef]
22. Hossain, K.; Mol, L. Some engineering properties of stabilized clayey soils incorporating natural pozzolans
and industrial wastes. Constr. Mater. 2011, 25, 3495–3501. [CrossRef]
23. Kramar, S.; Ducman, V. Evaluation of Ash Pozzolanic Activity by Means of the Strength Activity Index Test,
Frattini Test and DTA/TG Analysis. Teh. -Tech. Gaz. 2018, 25, 1746–1752.
24. Jaarsveld, J.G.S.; Deventer, J.S.J.; Lukey, G.C. The characterisation of source materials in fly ash-based
geopolymers. Mater. Lett. 2003, 57, 1272–1280. [CrossRef]
25. Leong, H.Y.; Ong, D.E.L.; Sanjayan, J.G.; Nazari, A. The effect of different Na2 O and K2 O ratios of alkali
activator on compressive strength of fly ash based-geopolymer. Constr. Mater. 2016, 106, 500–511. [CrossRef]
26. Bose, B. Geo-Engineering Properties of Expansive Soil Stabilized with Fly Ash. Electron. J. Geotech. Eng.
2012, 17, 1339–1353.
27. Eme, D.B.; Agunwamba, J.C. Prediction of elastic modulus from compessive modulus of lime stabilized
lateritic soil for mechanistic design using the split cylinder. Int. J. Eng. Comput. Sci. 2014, 3, 5471–5494.
28. Ghosh, S.; Datta, T.; Chattapadhyay, B.C. Prediction of Elastic Modulus of Soil Subgrade from Its
Various Engineering Properties. In Proceedings of the Indian Geotechnical Conference, Guwahati, India,
14–16 December 2017.
29. Kaakkurivaara, T.; Kolisoja, P.; Uusitalo, J.; Vuorimies, N. Fly Ash in Forest Road Rehabilitation. Croat. J.
For. Eng. 2016, 37, 119–130.
30. Khatami, H.; Deng, A.; Jaksa, M. An experimental study of the active arching effect in soil using the digital
image correlation technique. Comput. Geotech. 2019, 108, 183–196. [CrossRef]
© 2019 by the authors. Licensee MDPI, Basel, Switzerland. This article is an open access
article distributed under the terms and conditions of the Creative Commons Attribution
(CC BY) license (http://creativecommons.org/licenses/by/4.0/).You can also read


