Customer-Centric GIS Solutions for Land Records and Assessment
←
→
Page content transcription
If your browser does not render page correctly, please read the page content below
Customer-Centric GIS Solutions for Land Records and Assessment

                                            Manish Bhatt and Rick Singh
The statements made or opinions expressed by authors in Fair & Equitable do not necessarily represent a policy position of the
International Association of Assessing Officers.
  A customer is the most important visitor on our premises. He        1. Inventory of all real and tangible assets, to ensure full
  is not dependent on us. We are dependent on him. He is not             representation on the tax roll and the cadastral map
  an interruption in our work. He is the purpose of it. He is         2. Fair and equitable valuation of assets for ad valorem
  not an outsider in our business. He is part of it. We are not          tax purposes, as approved by the state governing body
  doing him a favor by serving him. He is doing us a favor by
  giving us an opportunity to do so.                                  3. Yearly notification of assessment and tax rates to prop-
                                                                         erty holders, typically followed by valuation defense
                                        —Mahatma Gandhi

I
                                                                      4. Administration of property-related exemptions
     n July 2013 the market valuation in Orange County,
     Florida, reached $115 billion and the taxable valuation          5. Transparency in governance and 24/7 access to
     $89 billion, from 430,000 parcels and 62,000 personal               public information.
property accounts. The newly elected Property Appraiser,            The office’s customers are segmented into three broad
Rick Singh, has accelerated technology adoption in the            categories: internal staff, intragovernmental users, and
office and implemented technology at every customer               public users, each with its own needs for the data and their
touch-point. This article highlights the 15 customer needs        applications. The office currently provides data, tools,
that the office has identified and the corresponding geo-         and support to this amazingly diverse customer base of
graphic information system (GIS) solutions to them.               approximately 4.6 million unique customers each year,
                                                                  which translates to approximately 2–3 searches per sec-
Who Are the Customers?                                            ond during peak usage times (8 a.m. to 5 p.m.). Figure 1
As a public service agency, the Orange County Property Ap-        presents numbers recorded in Google Analytics from July
praiser’s office has customer service as its primary mission.     2012 to July 2013. The graph displays the cyclical pattern
This mission is achieved through five primary services:           of heavy usage Monday through Friday from April 2013 to

Figure 1. Customer usage of Orange County Property Appraiser’s Web site, July 2012 to July 2013

                                                                                                  Fair & Equitable • September 2013   3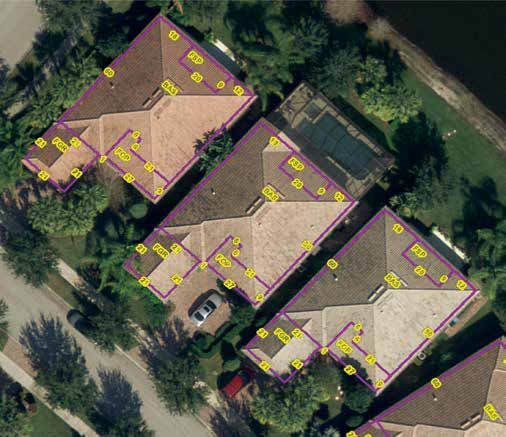
Feature Article
July 2013 (average 25,000 daily users) dominated by the FIRE (finance, IP addresses. Page visits are monitored
and a drop over the weekends; notice insurance, real estate) and govern- via Google Analytics.
the fourth of July. ment sectors. This list excludes users
that connect through Internet service Customer Need 1.
Table 1 shows the top users in 12 Cartographically Appealing
of the office’s primary user segments providers, primarily home users and
small businesses not having dynamic Cadastral and Tax Maps
(as identified by their IP addresses),
The Orange County Property Ap-
Table 1. The 12 primary user segments of the Orange County Property Appraiser’s office praiser’s office has the responsibility
and the top five users in each segment for creating a contiguous parcel (ca-
Local Government Florida State Government Federal Government Education dastral) base map of the county, a total
Orange County Department of Health Internal Revenue Service Orange County Public Schools of 430,000 parcels. COGO (coordinate
City of Orlando Department of Transportation National Aeronautics and Space University of Central Florida
City of Winter Park Department of Revenue Administration Valencia Community College geometry) techniques are used to pro-
Comptroller’s Office Department of Environmental Department of Homeland Rollins College duce spatially accurate tax maps. How-
Supervisor of Elections Protection Security University of Florida ever, these traditional tax maps appear
Department of Motor Vehicles Department of Veterans Affairs rather flat and lack the cartographic
U.S. Postal Service
elements required for an appealing,
Title Insurance Property Insurance Mortgage Banking Home Builders
yet functional map product.
Fidelity National State Farm Suntrust K. Hovnanian Homes
First American Title Harry Levine Bank of America Meritage Homes The office’s approach is to create a
Old Republic National Title Citizens Insurance BB&T Pulte Homes multilevel cached base map by using
Stewart Title Liberty Mutual Wells Fargo U.S. Home Corporation
USAA JPMorgan Chase KB Home
advanced cartographic methods. This
Legal Corporate Survey and Engineering Real Estate Companies
approach has resulted in an impres-
Akerman Senterfitt Orlando Utilities Commission Bowyer-Singleton CB Richard Ellis
sive cartographic base map, which
Broad and Cassel Disney Worldwide Service Lochrane Engineers Cushman & Wakefield now serves as a common platform for
Shutts & Bowen Lockheed Martin AECOM Universal City Development several applications (desktop, Web,
Provest Florida Hospital Kimley-Horn and Associates Partners and mobile). This map has taken the
Law Offices of Gerald Shapiro Orlando Health SAIC ITT Sheraton
art of cartography from the desktop
Fedex Knology
Darden Restaurants and made it available to all users.
Figure 2. Magic Kingdom, Disney World, Orlando, Florida Figure 2 is the base map of the Mag-
ic Kingdom, Disney World. Notice the
granularity of mapping details, scale-
based labeling, and thematic display
of land use. Figure 3 is the base map of
Lake Nona in Orlando, a mixed-used
urban development.
Customer Need 2. Quantitative
Cartography
Much of the quantitative information
about parcels is unavailable on the
tax map. How many acres is the par-
cel? How many rooms in the hotel or
units in the apartment complex? How
much traffic on the street? What’s the
par on hole 1 of this golf course?
The office has successfully inte-
grated quantitative information about
parcels on the cached base map. This
approach requires advanced labeling
and scripting methods, along with a
synthesis of attribute data. Both the
digital and printed map products now
4 Fair & Equitable • September 2013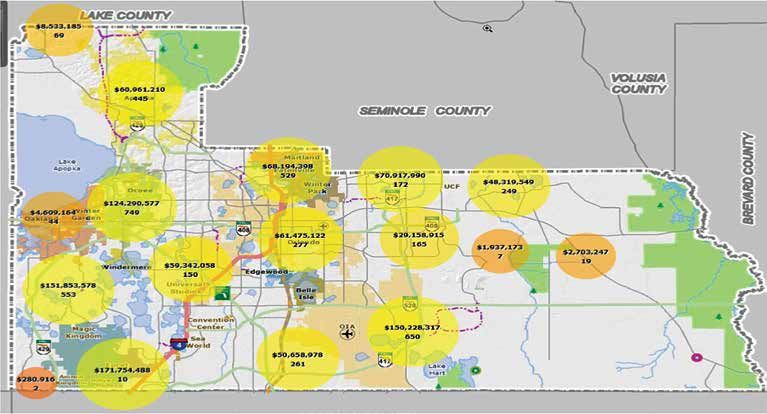
Figure 3. Lake Nona, Orlando                                                                   display the quantitative information
                                                                                               on the base map.
                                                                                                 Figure 4 is the base map of hole 14
                                                                                               of the Arnold Palmer’s Bay Hill golf
                                                                                               course, 215 yards, par 3. The office is
                                                                                               also interested in the price correlation
                                                                                               between golf-course properties and
                                                                                               non-golf-course properties. Figure 5
                                                                                               shows the hotels clustered near the
                                                                                               Orlando International Airport; note
                                                                                               the labeling of room capacity, owner-
                                                                                               ship, and property name.

                                                                                               Customer Need 3. Qualitative
                                                                                               Cartography
                                                                                               Much of the qualitative information
                                                                                               about parcels is unavailable on the
                                                                                               tax map. Who owns the parcel? Which
                                                                                               businesses are located on the parcel?
Figure 4. Hole 14 of Arnold Palmer’s Bay Hill golf course, Orlando                             What is known about the homeowners
                                                                                               association that the parcel belongs to?
                                                                                               How are unit-level apartment address-
                                                                                               es and related information displayed?
                                                                                                 Figure 6 shows the Winter Garden
                                                                                               Village at Fowler’s Grove, a 115-acre
                                                                                               retail development. Note the integra-
                                                                                               tion of tangible personal property
                                                                                               accounts, accurately placed on the

Figure 5. Hotel cluster near the Orlando International Airport
                                                                 Figure 6. Winter Garden Village at Fowler’s Grove, a 115-acre retail
                                                                 development in Orlando

                                                                                                        Fair & Equitable • September 2013   5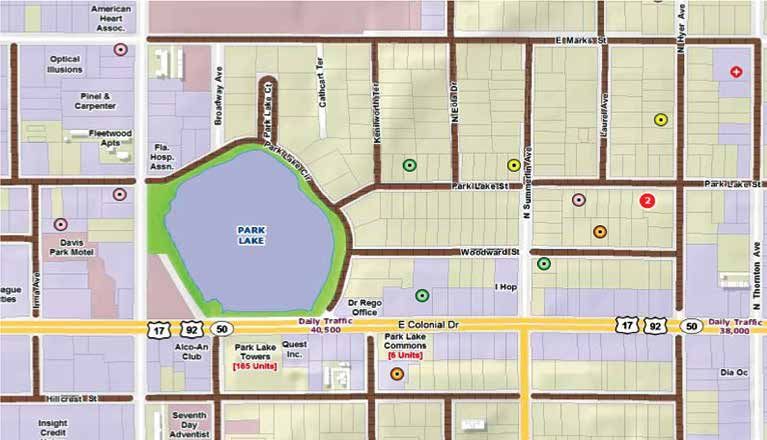
Feature Article
building sketch. Figure 7 shows unit-       Figure 7. Apartment complex with 24 buildings and 560 apartments in Orlando
level apartment addresses placed ac-
curately on the building sketch. Public
safety customers appreciate the ability
to pinpoint the exact location of an
apartment unit within a complex, in
this case, 24 buildings and 560 apart-
ments, in two phases.

Customer Need 4. Advanced
Visualization Techniques
The assessor/appraiser has a great
deal of data that are not easily visual-
ized or useful for meaningful analy-
sis. Where are the foreclosures? Who
owns them? Where are the clusters/
hotspots? Where is the new construc-
tion? How much new construction is
added on the tax roll? What areas are
experiencing a large dollar value of
new construction?
By using the advanced visualization
techniques provided by ArcGIS Serv-
er, the office can now visualize and
make meaningful inferences from
the data. This kind of visualization has
not only benefitted the office but also
generated public and media interest.
Figure 8. Example of advanced visualization technique that clusters two variables

6 Fair & Equitable • September 2013

Figure 8 is an example of an advanced visualization tech-        Figure 10. Example of basic GIS visualization of percentage
nique that dynamically clusters two variables: value of net      change in value from prior year to current year
new construction and number of new construction proper-
ties. This is delivered through a Web application in which
the clusters dynamically change to reflect the same variable
as the user zooms in. The same techniques can be used to
visualize foreclosures, permits, exemptions, and the like.

Customer Need 5. Quality Control Tools
As an agency with the responsibility for the yearly mass
appraisal of 430,000 properties (both commercial and
residential), the Orange County Property Appraiser’s of-
fice must deploy methods that maintain the quality of its
appraisals.
  The two key performance indicators are the sales ratio
(assessed value to the sale price), to understand the level
of assessment, and the percentage change in value, to cre-
ate a fair and equitable tax roll.
  GIS tools and applications such as those shown in fig-
ures 9, 10, and 11 are currently used by appraisers in
their work. These tools not only maintain quality control        Figure 11. Example of visualization of grade variable
measures but also allow the office to serve taxpayers in a
transparent manner. Figure 9 shows the display and label-
ing of sales ratios in the Web-based application. Figure 10
shows the basic GIS visualization of percentage change
in value from prior year to current year; this tool leads to
exploring the why in data analysis. Figure 11 is an example
of the visualization of the grade variable; this tool helps
identify variability in a fairly homogenous neighborhood.

Figure 9. Sales ratios thematically displayed and labeled in a
Web-based map application

                                                                 Customer Need 6. Business Intelligence Tools
                                                                 One challenge faced by the appraiser’s office is the in-
                                                                 tegration of third-party data with land records and the
                                                                 publication of meaningful business intelligence reports on
                                                                 the Web. In addition, the intent is to maintain an intuitive
                                                                 user experience and a simple user interface.
                                                                   Not only has the office been able to successfully integrate
                                                                 several external data sets into the land records (see figure
                                                                 12), but also it has published effective business intelligence
                                                                 reports. Figure 13 shows how the Census geography and
                                                                 demographic data from a third party (ESRI) have been
                                                                 spatially joined with the office’s property-related data, at
                                                                 the Census block group level, to create new value-added
                                                                 business intelligence reports. This effort requires a clear
                                                                 understanding of how much data to offer and how to keep
                                                                 up with the data refreshes.

                                                                                                Fair & Equitable • September 2013   7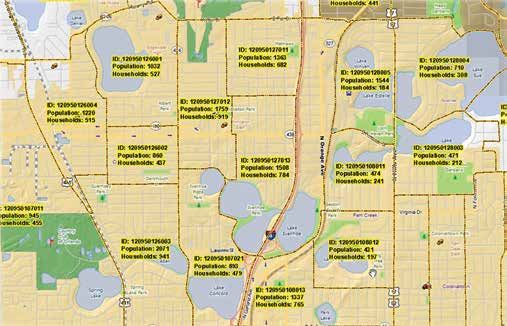
Feature Article
Figure 12. Integration of Census block group boundaries with parcel base              Customer Need 8. Comparable
                                                                                      Sales Analysis Tool
                                                                                      The office’s appraisal values must
                                                                                      be explainable to taxpayers and de-
                                                                                      fensible if petitioned. GIS is used
                                                                                      extensively for valuation defense. A
                                                                                      picture is worth a thousand words,
                                                                                      especially when comparable sales are
                                                                                      being displayed. The use of geospatial
                                                                                      techniques to generate comparable
                                                                                      sales makes it very easy for appraisers
                                                                                      to work with taxpayers and their rep-
                                                                                      resentatives. With the AGS Silverlight
                                                                                      API and the .net platform, the office
                                                                                      creates professional-quality reports for
                                                                                      use in valuation defense.
                                                                                        Figure 15 shows GIS-based compa-
                                                                                      rable sales data; users can choose the
                                                                                      selection criterion: radial, subdivision,
Figure 13. Business intelligence reports                                              neighborhood, user-defined area, or
                                                                                      manual. Figure 16 shows how users
                                                                                      can customize their adjustments, sales
                                                                                      year, and so on. Figure 17 shows a Web-
                                                                                      based comparable sales report avail-
                                                                                      able to users. Figure 18 shows views of
                                                                                      the subject property and comparables,
                                                                                      which are also available to users.

                                                                                      Customer Need 9. Location-
                                                                                      Based Information
                                                                                      Much of the property attribute data
                                                                                      published on the Web is nonspatial.
                                                                                      However, the office has moved beyond
                                                                                      the traditional data components and
                                                                                      integrated the location aspect of the
                                                                                      property with the other nonspatial
                                                                                      data. The key challenge is to present
Customer Need 7. Optimized                  countability and productivity in the
                                                                                      geospatial data in a well-designed
Field Operations                            field, a new field application has been
                                                                                      Web page. Because location data are
Field staff needs to visualize their        introduced. This browser-based Web
                                                                                      so crucial in real estate, an integrated
work assignments so they can logisti-       application is specifically designed
                                                                                      approach—the ability to obtain all the
cally plan their routes and workloads.      to work on mobile devices (smart-
                                                                                      parcel-related data in one place—is
This is primarily achieved through as-      phones, tablets). Appraisers log in
                                                                                      much appreciated by users.
signing the building permits, priority      to visualize their assignments and
                                            zoom to a parcel (assigned or not) to       Figure 19 shows the location infor-
rechecks, certificate of occupancy,
                                            capture photos and collect and verify     mation tab on the Orange County
parcel-to-parcel inspection, and other
                                            attribute data.                           Property Appraiser’s Web site. Based
field-related activities to appraisers in
                                                                                      on design considerations and user
their respective work zones.                  Figure 14 is a screenshot of an ap-
                                                                                      feedback, this tab synthesizes several
  In order to implement a paperless         praiser’s work assignment; dynamic
                                                                                      key location-related elements that
initiative as well as increase both ac-     cluster changes with zoom levels.
                                                                                      customers find useful.

8 Fair & Equitable • September 2013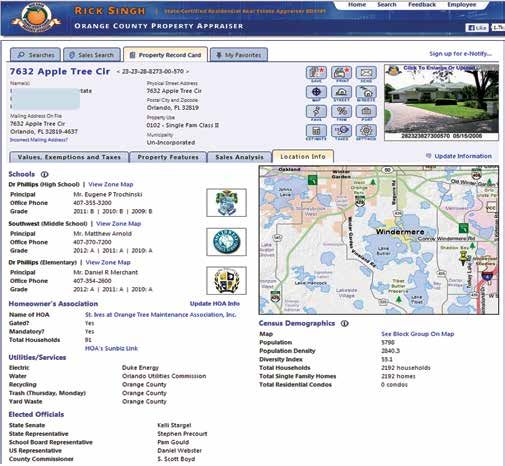
Figure 14. Web application map of an appraiser’s work assignment   Figure 17. Comparable sales report

Figure 15. GIS-based comparable sales

                                                                   Figure 18. Visual presentation of subject property and
                                                                   comparable sales

Figure 16. Customization settings for comparable sales

                                                                   Customer Need 10. GIS-Based Sketching and
                                                                   Sketch Visualization
                                                                   Traditionally, buildings are sketched in a computer-assisted
                                                                   mass appraisal (CAMA) software package. These building
                                                                   sketches are not georeferenced, are often in proprietary
                                                                   formats, and are not interoperable. The challenge was to
                                                                   convert these sketches to the ESRI format and georefer-
                                                                   ence them. The office is currently working to draw these
                                                                   sketches directly on the ESRI platform.

                                                                                                  Fair & Equitable • September 2013   9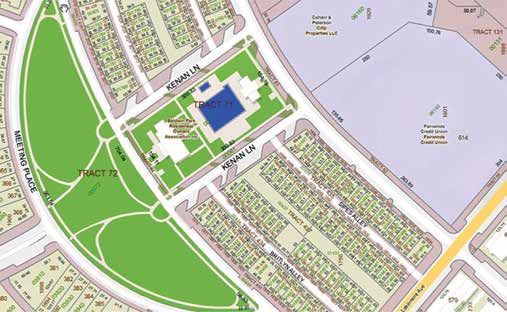
Feature Article
Figure 19. Location information tab on Property Appraiser’s Web site     Georeferenced building sketches
                                                                       have several benefits: accurate scale
                                                                       and rotation, the ability to verify
                                                                       missing building elements, minimal
                                                                       sketching errors and incorrect at-
                                                                       tribution, and, most importantly, in-
                                                                       teroperability. Users also find these
                                                                       georeferenced building sketches very
                                                                       valuable for their business needs. See
                                                                       figure 20 for an example of a georef-
                                                                       erenced building sketch.

                                                                       Customer Need 11. Historic
                                                                       Parcel Information
                                                                       One data element frequently request-
                                                                       ed is historic parcel configuration
                                                                       and ownership. The capability for
                                                                       visualizing land use and ownership
                                                                       changes over time is often missing.
                                                                       The solution to this problem is based
                                                                       on the preserving the original parcel
                                                                       polygon (prior to the split or combi-
                                                                       nation), along with the action num-
                                                                       ber and attribute data—all stored as
                                                                       a spatial object in the parcel history
                                                                       layer. Figure 21 is an example of a
                                                                       progressive visualization of both land
Figure 20. Georeferenced building sketch                               use and ownership changes: in Janu-
                                                                       ary 2012 raw undeveloped land was
                                                                       sold as three out-parcels of developed
                                                                       land; the brown parcels compose the
                                                                       parcel fabric in January 2013; and the
                                                                       purple line denotes the prior parcel
                                                                       fabric. This visualization illustrates
                                                                       the land use change, the current and
                                                                       prior ownership, and changes to the
                                                                       parcel fabric.

                                                                       Customer Need 12.
                                                                       Understanding and Improving
                                                                       Public Service Efficiency
                                                                       Currently about 70 percent of applica-
                                                                       tions for homestead exemptions are
                                                                       filed online. This is a win-win situation
                                                                       for both the office and its customers.
                                                                       Therefore, the goal is to increase that
                                                                       number. GIS helps identify neighbor-
                                                                       hoods with a low online filing partici-
                                                                       pation so the office can reach out and
                                                                       serve those neighborhoods. Figure
                                                                       22 shows the spatial distribution of
                                                                       homestead exemption filings; a clear

10 Fair & Equitable • September 2013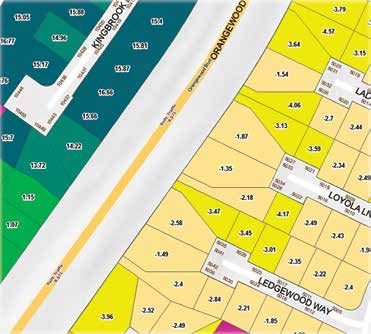
Figure 21. Progressive visualization of land use and ownership changes                  Figure 23. Pie chart of type of filings for
                                                                                        homestead exemption

Figure 22. Spatial distribution of homestead exemption filings                          Figure 24. Example of a 25.1-acre parcel
                                                                                        with multiple land uses

pattern of online filing in high-value      gon within a single tax parcel. This        lines—lines 1, 2, and 4 are agricultural
neighborhoods, as might be expected,        approach is a win-win situation for         use, land 3 is residential use, and line
has not occurred. Figure 23 is a pie        both the Property Appraiser’s office        5 is submerged land.
chart showing the type of filing for        and the property owner.
homestead exemptions, as created in                                                     Customer Need 14. Damage
                                            Figure 24 is an example of a 25.1-          Assessment
the GIS application.                        acre parcel with multiple land uses;        Another responsibility of the Property
Customer Need 13. Valuation of              each use is demarcated accurately to        Appraiser’s office involves locating
Multi-use Land Parcels                      allocate correct acreage. Land lines        property damage from natural disas-
A primary challenge in valuation is         are mapped by using surveys when            ters. Appraisers identify the level of
multiple land uses on a single tax          available or high-resolution aerial im-     damage (minor, moderate, severe,
parcel. Often, the property owner is        agery that is then verified in the field.   destroyed), and the software estimates
unsure how the land value is derived.       Figure 25 is an example of a report         the value of damage based on preset
The appraiser’s office has innovatively     on a parcel with multiple land uses;        percentages of replacement cost.
mapped every unique land use poly-          the user can identify associated land       These numbers are then aggregated

                                                                                                 Fair & Equitable • September 2013    11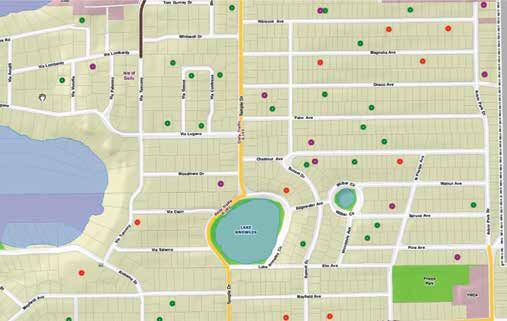
Feature Article
Figure 25. Report on a parcel with multiple land uses          Customer Need 15. Social Media and Outreach
                                                               Appraisers are constantly producing effective visualizations
                                                               to model real world data, and thus need to promote the
                                                               assessment profession and its message with high-quality
                                                               storytelling. The Orange County Property Appraiser’s of-
                                                               fice has successfully executed a social media strategy that
                                                               has resulted in almost 1,800 likes in a short period of 6
                                                               months. Check out the Facebook page (figure 29), www.
                                                               facebook.com/ocpafl, and please give it a like.

                                                               Figure 28. Real-time dashboard of data entry and associated
                                                               damage estimate

and reported to local, state, and federal agencies. In-house
applications for field data collection and dissemination
have been created; the office also relies on cloud-sourced
data and photos. Figure 26 shows the path of Hurricane
Charley in August 2004 and a 10-mile radius; this map al-
lows the appraiser’s office to optimize damage assessment
efforts. Figure 27 (page 13) is a point representation of
damage, coded by severity (data are simulation-based).
Figure 28 is a real-time dashboard of data entry and as-
sociated damage (data are simulation-based).

                                                               Figure 29. Facebook page for Orange County Property
Figure 26. Path of Hurricane Charley in August 2004            Appraiser’s office

12 Fair & Equitable • September 2013
Figure 27. Point representation of hurricane damage, coded by severity
Manish Bhatt is Chief Information Of- Rick Singh was sworn in as the Orange
ficer with the Orange County Property County Property Appraiser on January
Appraiser’s office in Orlando, Florida. 13, 2013, and has earned a Certified
He has been with Orange County since Florida Appraiser (CFA) designation
March 1999. He has implemented tech- from the State of Florida Department of
nology solutions in several industries. Revenue. He is a real estate broker and a
Manish earned an MBA from Goizueta state-certified residential appraiser. Previ-
Business School at Emory University. Prior to that he ously, he owned his own appraisal firm and started a real
earned a master's degree in GIS and geophysics from the estate company. During this time, he hired, trained, man-
University of Texas, Dallas. A native of India, he gradu- aged, and reviewed numerous appraisers, brokers, and
ated from the Indian Institute of Technology, Bombay, sales agents. A proud veteran, he enlisted in the U.S. Army
earning an MS in applied geology before moving to the and was assigned to the 1st Infantry Division Mechanized,
United States. Manish can be contacted at mbhatt@ working on Helicopter Armament Subsystems. Rick was
ocpafl.org honorably discharged in 1986 with the rank of Special-
ist 4. Rick can be contacted at ricksingh@ocpafl.org.
IAAO, your road to success . . .
PAVE the way to your future.
For more information on the IAAO Professional Designation Program
contact Wanda Witthar at witthar@iaao.org
Fair & Equitable • September 2013 13You can also read