Testing and Optimizing a Stove-Powered Thermoelectric Generator with Fan Cooling
←
→
Page content transcription
If your browser does not render page correctly, please read the page content below
materials
Article
Testing and Optimizing a Stove-Powered
Thermoelectric Generator with Fan Cooling
Youqu Zheng 1 , Jiangen Hu 2 , Guoneng Li 1, *, Lingyun Zhu 1 and Wenwen Guo 1
 1   Department of Energy and Environment System Engineering, Zhejiang University of Science and
     Technology, Hangzhou 310023, China; zyq888@zust.edu.cn (Y.Z.); 211601802004@zust.edu.cn (L.Z.);
     guowenwen@zust.edu.cn (W.G.)
 2   Hangzhou YiNeng Power Technology Corporation Limited, Hangzhou 310014, China; hjg2623@sina.com
 *   Correspondence: 109026@zust.edu.cn

 Received: 18 May 2018; Accepted: 4 June 2018; Published: 7 June 2018

 Abstract: In order to provide heat and electricity under emergency conditions in off-grid areas,
 a stove-powered thermoelectric generator (STEG) was designed and optimized. No battery was
 incorporated, ensuring it would work anytime, anywhere, as long as combustible materials were
 provided. The startup performance, power load feature and thermoelectric (TE) efficiency were
 investigated in detail. Furthermore, the heat-conducting plate thickness, cooling fan selection,
 heat sink dimension and TE module configuration were optimized. The heat flow method was
 employed to determine the TE efficiency, which was compared to the predicted data. Results showed
 that the STEG can supply clean-and-warm air (625 W) and electricity (8.25 W at 5 V) continuously at
 a temperature difference of 148 ◦ C, and the corresponding TE efficiency was measured to be 2.31%.
 Optimization showed that the choice of heat-conducting plate thickness, heat sink dimensions and
 cooling fan were inter-dependent, and the TE module configuration affected both the startup process
 and the power output.

 Keywords: thermoelectric generator; power load feature; thermoelectric efficiency; optimization

1. Introduction
      One-point-three billion people still live in off-grid areas [1], and natural disasters often cut off
the electricity supply in developed countries and regions. Providing a minimum amount of electricity
in an off-grid area and under emergency conditions is vital for communications, medical electronic
devices, lighting and other basic needs. A primary battery is the best choice, yet it has a limited life and
the risk of unavailable resupply. Solar power generators and wind power generators are major solutions
for the off-grid regions, yet they are weather dependent. Hand generators could be the ultimate
solution, but depend on manpower. Therefore, other technologies should be developed to provide
a minimum amount of electricity. Generating electricity from biomass stoves has attracted much
attention in recent years [2]. This has been achieved by adopting TE modules so that combustion inside
the stove can power the thermoelectric generator, while cooking and heating still work simultaneously.
Over two billion people burn biomass for cooking and heating [3], which means that the stove-powered
thermoelectric generator (STEG) has good prospects. Further, a well-designed STEG can power
a blower to improve the combustion inside the stove, reducing CO and particle pollution [4], which are
known to be harmful. Figure 1 shows a basic STEG in diagram form.

Materials 2018, 11, 966; doi:10.3390/ma11060966                              www.mdpi.com/journal/materials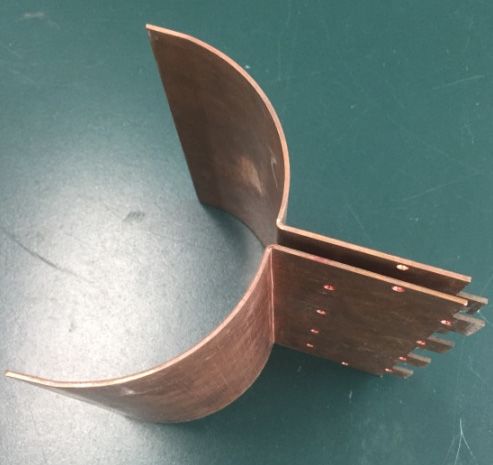
Materials 2018, 11, 966 2 of 17
Materials 2018, 11, x FOR PEER REVIEW 2 of 17
Figure
Figure 1. Diagram
1. Diagram ofofa abasic
basicstove-powered
stove-powered thermoelectric
thermoelectricgenerator (STEG).
generator (STEG).
The STEG utilizes the Seebeck effect, i.e., the temperature difference forces electrons to move in
The STEG utilizes
one direction between thetwoSeebeck effect,
different metals i.e.,
orthe temperature[5].
semiconductors difference
The major forces electrons
advantages of a to move in
STEG
one direction between twoand
are little maintenance different
weathermetals or semiconductors
independence, whereas its [5].drawback
The major advantages
is low efficiencyof[6,7],
a STEG a are
little problem
maintenance andbeweather
that may solved by independence,
new technologies whereas
based on itsfuture
drawback
researchis low efficiency
[7]. Many [6,7],studies
previous a problem
have be
that may focused
solved onby STEG,
newbut only a few based
technologies selectedon experimental studies
future research [7].areMany
reviewed in thestudies
previous present have
work. Experimental work on STEG falls into three groups: water-cooled
focused on STEG, but only a few selected experimental studies are reviewed in the present STEG, natural draft air-work.
cooled (NDAC) STEG and forced draft air-cooled (FDAC) STEG.
Experimental work on STEG falls into three groups: water-cooled STEG, natural draft air-cooled
For the water-cooled STEG, Rinalde et al. [8] obtained a total of 10 W of electricity. No DC-DC
(NDAC) STEG and forced draft air-cooled (FDAC) STEG.
converter was used, and the power consumed by the water pump was not considered. Champier et
For the water-cooled STEG, Rinalde et al. [8] obtained a total of 10 W of electricity.
al. [9,10] designed a STEG to produce electricity and to improve the combustion efficiency. The cold
No DC-DC
end wasconverter
cooled by awas waterused,
tank,and
andthe powerofconsumed
an output electricity ofby6 the
W was water pump[9].
recorded was notwork,
In this considered.
a
Champier
DC-DC et converter
al. [9,10] designed
was used,aand STEG thetoTEproduce electricity
efficiency was foundandtotobe improve
about 2% the for
combustion
a temperature efficiency.
The cold end was
difference cooled
of 200 by the
°C. For a water tank, STEG,
optimized and anthe output
same of electricity
cooling method of 6wasW used,
was recorded [9]. In this
but the output
work,power
a DC-DC increased to 7.6 W
converter was[10]. Montecucco
used, and the et TEal.efficiency
[11,12] designed another
was found to type of water-cooled
be about STEG,
2% for a temperature
producing
difference of 200 ◦ C.
a net output
For theof electricity
optimized of STEG,
19 W with the asame
TE efficiency
cooling of about 4–5%
method was for a temperature
used, but the output
power difference
increased of 150 °C–200
to 7.6 W [10].°C. A DC-DC converter
Montecucco was employed
et al. [11,12] designed here.
another type of water-cooled STEG,
For NDAC STEG, Nuwayhid et al. demonstrated that the combination of a TE module and a
producing a net output of electricity of 19 W with a TE efficiency of about 4–5% for a temperature
stove can produce electricity [2,13,14]. The STEG was optimized several times to increase the output
difference of 150 ◦ C–200 ◦ C. A DC-DC converter was employed here.
power from 1 W [2] to 3.4 W [13], and then to 4.2 W [14]. The cooling method was natural air
For NDAC STEG, Nuwayhid et al. demonstrated that the combination of a TE module and
convection, using ordinary finned heat sinks or heat pipes, and no DC-DC converter was employed.
a stove can produce electricity
Lertsatitthanakorn [15] developed [2,13,14].
a STEGThe with STEG was optimized
a maximum of 2.4 W several
recorded.times to increase
The power load the
output feature and the TE efficiency for various temperature differences were studied, indicating that the air
power from 1 W [2] to 3.4 W [13], and then to 4.2 W [14]. The cooling method was natural
convection, using ordinary
load resistance should be finned
optimizedheatto sinks
maximize or heat pipes,
output andwhile
power, no DC-DC converterranged
the TE efficiency was employed.
from
1%–3.2% when the
Lertsatitthanakorn temperature
[15] developed difference
a STEGvaried with from 44 °C–150of
a maximum °C.2.4
Najjar
W and Kseibi tested
recorded. a novel load
The power
featureSTEGand to the
produce hot water and
TE efficiency electricitytemperature
for various [16,17]. A maximum power
differences output
were of 7.8 Windicating
studied, was recorded that the
with no DC-DC converter. Detail temperature distributions were measured
load resistance should be optimized to maximize output power, while the TE efficiency ranged from in different positions,
and the influence of different fuel types was explored◦ in these
1%–3.2% when the temperature difference varied from 44 C–150 ◦ C.works. Najjar Moreover,
and Kseibiatesteddetailed
a novel
comparison of previous STEGs was presented in their work [17].
STEG to produce hot water and electricity [16,17]. A maximum power output of 7.8 W was recorded
For FDAC STEG, Mal et al. [4] tested a STEG, improving the exhaust gas quality (CO and
with particles)
no DC-DC converter. Detail temperature distributions were measured in different positions,
by adding a blowing fan. It was found that the CO and particle concentration decreased
and the influence
significantly when of different
using a fuel types
blowing was
fan; explored
while the STEGin these works.
produced Moreover,
electricity a detailed
between 2 W andcomparison
4 W.
of previous STEGs was presented in their work [17].
For FDAC STEG, Mal et al. [4] tested a STEG, improving the exhaust gas quality (CO and
particles) by adding a blowing fan. It was found that the CO and particle concentration decreased
significantly when using a blowing fan; while the STEG produced electricity between 2 W and 4 W.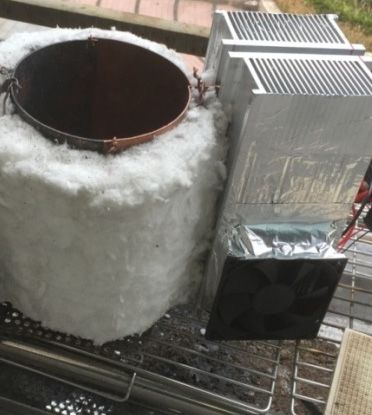
Materials 2018, 11, 966                                                                            3 of 17

O’Shaughnessy et al. [18] distributed several STEGs in off-grid regions and ran a field test for 80 days.
It was found that 3 Wh of electricity power met the basic need. Recently, the BioLite CampStove
and BaseCamp, designed for outdoor activities and emergency conditions, can provide 2–5 W of
electricity [19]. Batteries are incorporated and should be charged before first use.
     All the above works conclude that the STEG offers a suitable and economical alternative way to
produce electricity in off-grid areas and under emergency conditions. However, different opinions
should not be ignored, e.g., Sornek et al. [20] concluded that it is not an economical method of
producing electricity using TE modules, and the payback period is too long.
     Surveying the above literature, while many aspects of various types of STEG were studied,
indicating that the STEG is a potential method of obtaining electricity in off-grid areas and under
emergency conditions, as of yet, it is far from fully understood. Several conclusions can be drawn
based on the above literature.

(1)   Water-cooled STEGs have larger output power than air-cooled ones. However, water is not
      always available everywhere at all times.
(2)   NDAC STEGs were mostly used in previous studies, resulting in relatively large volumes
      and weights.
(3)   FDAC STEGs have attracted attention recently, yet studies are limited.
(4)   For FDAC STEGs, only a limited number of TE modules can be installed, which restricts
      their application.

     In the present work, an FDAC STEG was designed with a novel type of heat collector allowing the
installation of as many as eight TE modules. For safety and ease of use, no battery was incorporated.
The maximum electricity power output is 60% larger than that of the available commercial product
under comparable weight [19]. First, the structure of the STEG and the experimental system are
discussed. Second, the results of the startup performance, power load feature and TE efficiency are
presented and discussed in detail. Third, the heat-conducting plate thickness, cooling fan selection,
heat sink dimensions and TE module configuration are optimized. Finally, several conclusions are
drawn. The present study offers new experimental data on FDAC STEGs and presents a new type
of STEG.

2. Experimental System
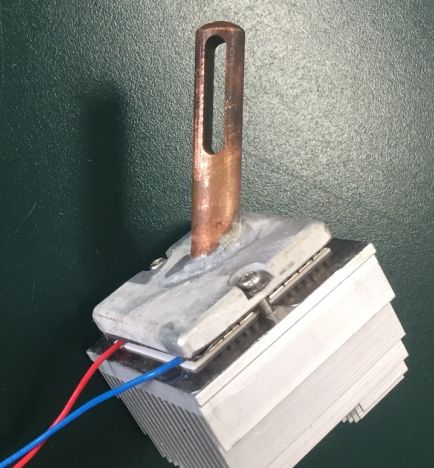
     The experimental setup and the electricity circuit are shown in Figure 2. The STEG consists
of a semi-circular steel plate with a porous fuel holder, two quarter circle copper heat-conducting
plates, eight TE modules, two aluminum alloy heat sinks, two cooling fans and two DC-DC converters.
The semi-circular steel plate and the two quarter circle heat-conducting plates are installed together to
form a circular combustion chamber, while a 30 mm-thick layer of fiber glass insulation is wrapped
round the outside of the combustion chamber. The diameter and the height of the combustion
chamber are 140 mm and 220 mm, respectively, and a porous fuel holder is installed 30 mm above
the bottom surface of the combustion chamber. The copper heat-conducting plate has a “Z” shape,
and two plates are installed together in opposing direction to form a semi-circle to provide part of
the combustion chamber and to form a flat plate for the installation of the TE modules. Eight TE
modules, type “TEP1-126T200” with dimensions of 40 mm (length) × 40 mm (width) × 3.8 mm
(thickness), are installed on the opposing surfaces of the right-hand side of the heat-conducting
plate, equally spaced. The TE material is Bi2 Te3 , and the dimensions of the thermo-element
(leg) are 1.3 mm × 1.3 mm × 1.55 mm (length). Typically, the TE module produces 2.8 watts under
a temperature difference of 150 ◦ C, and the working temperature of the TE module does not exceed
250 ◦ C. Two aluminum alloy heat sinks are bolted above the TE modules. Two DC air fans are installed
on the top surface of the heat sinks, blowing outside air into them, while aluminum foil was used
to seal the top surface of the other heat sinks. In order to determine the TE efficiency, an extensible
aluminum tube with a diameter of 120 mm was installed to connect the outlet of the heat sinks, so as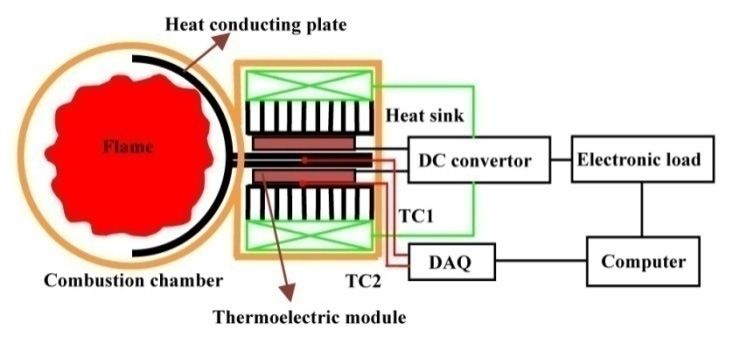
Materials 2018, 11, 966                                                                                                   4 of 17

to form an air duct. This extensible aluminum tube can be used to supply clean and warm air to tents,
and heat    insulations
      Materials               should
                2018, 11, x FOR       be employed when the distance between the tent and the STEG
                                PEER REVIEW                                                                4 of 17is far
away. Two DC-DC converters (type MP1583) were adopted to stabilize the output voltage at 5.0 V.
      DC-DC converters
One DC-DC        converter (type     MP1583)
                               was used       were adopted
                                          to supply         to stabilize
                                                    electricity          the output
                                                                to the cooling      voltage
                                                                                fans,       at 5.0
                                                                                      and the      V. One
                                                                                               other  one DC-DC
                                                                                                          was used to
      converter was used to supply electricity to the cooling fans, and the other one was used to provide
provide electricity for the external load.
      electricity for the external load.

                                                              (a)

                                                              (b)

                                                              (c)

                                                              (d)
            Figure 2. The STEG photographs, the experimental setup and the electric circuit (a) photographs; left:
      Figure 2. The STEG photographs, the experimental setup and the electric circuit (a) photographs;
            STEG core, right: a pilot product; (b) a sketch of the experimental setup (top view); (c) a sketch of the
      left: STEG    core, right:
            experimental   setup a pilot
                                 (side    product;
                                       view);        (b) a sketch
                                              (d) schematic       of the
                                                             drawing      experimental
                                                                     of the electric circuitsetup  (top view);
                                                                                             with multiple     (c) a sketch
                                                                                                           TE modules
      of thefitted.
              experimental setup (side view); (d) schematic drawing of the electric circuit with multiple TE
      modules fitted.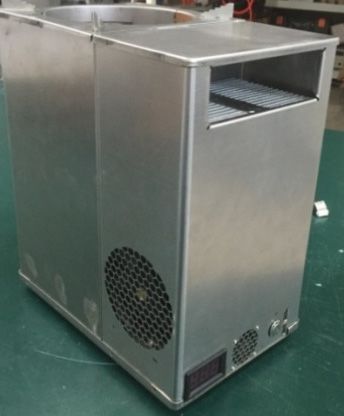
Materials 2018, 11, 966 5 of 17
A sketch map of the experimental system is shown in Figure 2b,c. Four thermocouples with
a diameter of 1 mm are installed. The first thermocouple is installed at the center point of the top
end of the heat-conducting plate, measuring the hot end temperature. The second one is installed
at the center point of the top end of the heat sink, measuring the cold end temperature. The third
thermocouple is installed at the outlet of the heat sink, while the fourth one is installed at the exhaust
exit of the extensible aluminum tube. The distance from the outlet of the heat sink to the exhaust
Materials 2018, 11, x FOR PEER REVIEW 5 of 17
exit is 800 mm, and screens are installed to ensure uniform air flow. The measuring range and the
accuracy of the A sketch
thermocouples are −200–400
map of the experimental system ◦ Cis and
shown ±in Figure
0.5%, 2b,c. Four thermocouples
respectively. The temperature with a signals
diameter of 1 mm are installed. The first thermocouple is installed at the center point of the top end
were recorded by an Agilent-34,970 A data acquisition instrument combined with a Benchlink Data
of the heat-conducting plate, measuring the hot end temperature. The second one is installed at the
Logger program.
center point Theof average
the top end airofvelocity
the heat was sink, measured
measuring the withcolda end
Peakmeter
temperature. MS6252B
The thirdturbo type
anemometer. The measuring
thermocouple is installed range andofthe
at the outlet the accuracy
heat sink, whileof the thermo-anemometer
the fourth one is installed at theare 0.8–30.0 m/s
exhaust
and ±2.0%, exitrespectively.
of the extensibleThe aluminum
average tube.airThevelocity
distance from
andthe theoutlet of the air
exhaust heattemperature
sink to the exhaust (T4exit
) are used to
is 800 mm, and screens are installed to ensure uniform air flow. The measuring range and the
calculate the mass flow rate of the cooling air. The power load feature was measured using Prodigit
accuracy of the thermocouples are −200–400 °C and ±0.5%, respectively. The temperature signals were
3311F electronic
recordedload. Its measuring
by an Agilent-34,970 range
A data and accuracy
acquisition instrument are 0–60 Vwith
combined (300 W) and Data
a Benchlink ±0.5%, Loggerrespectively.
Charcoal is used as
program. The the fuel air
average in velocity
the present experiment.
was measured The net calorific
with a Peakmeter MS6252B turbopower typeand the density of the
anemometer.
charcoal isThe
31.2measuring
MJ/kg and range1322
and kg/m 3 , respectively,
the accuracy of the thermo-anemometer
and the ash mass are 0.8–30.0
fractionm/s and ±2.0%,
is 4.87%. The errors of
respectively. The average air velocity and the exhaust air temperature (T4) are used to calculate the
the parameters are shown in Table 1, where the efficiency of the DC-DC converter was found to be
mass flow rate of the cooling air. The power load feature was measured using Prodigit 3311F
77.3% using two electric
electronic load. Itsenergy
measuringtesters
range installed
and accuracybefore areand0–60after theW)
V (300 DC-DC
and ±0.5%,converter. The operation
respectively.
procedureCharcoal
of a running
is used asofthe the
fuelpresent STEG
in the present test includes
experiment. The netseveral steps.and
calorific power e.g., Step 1:ofPut
the density the a certain
amount ofcharcoal is 31.2 MJ/kg
dry branches intoandthe1322 kg/m3, respectively,
combustion chamber, and the ash
then putmass fractionamount
a certain is 4.87%. of Thecharcoal
errors of above the
the parameters are shown in Table 1, where the efficiency of the DC-DC converter was found to be
dry branches. Turn on the data acquisition instruments, and initialize the data recording programs.
77.3% using two electric energy testers installed before and after the DC-DC converter. The operation
Step 2: Ignite
proceduredry
the of a branches.
running of the Step 3: Carry
present STEG out the power
test includes load
several tests
steps. e.g.,when
Step 1:the PutSTEG
a certain reaches the
steady state. Stepof4:dry
amount Hard charcoal
branches is added
into the combustion intochamber,
the combustion
then put a chamber
certain amount if necessary.
of charcoalStepabove5: Measure
the dryofbranches.
the parameters the exhaustTurn on fluethegas.
dataOn acquisition
the other instruments,
hand, theand initialize
typical the data
running ofrecording
the pilot product
programs. Step 2: Ignite the dry branches. Step 3: Carry out the power load tests when the STEG
based on the present STEG shown in Figure 2a is much more user-friendly. First, ignite the branches or
reaches the steady state. Step 4: Hard charcoal is added into the combustion chamber if necessary.
any other Step
combustible
5: Measure the solid fuels. Second,
parameters the clean-and-warm
of the exhaust flue gas. On the otherair and
hand, theelectricity
typical runningcanofbetheused when
the indicator
pilotisproduct
abovebased 15 within minutes
on the present STEG (anshown
indicator
in Figurewas designed
2a is much more inuser-friendly.
the pilot product).
First, ignite
the3branches
Figure showsorthe anyheat
othercollector.
combustibleCoppersolid fuels.rodsSecond,
arethe clean-and-warm
installed in earlier air and electricity
FDAC STEGscan [4,18,19],
be used when the indicator is above 15 within minutes (an indicator was designed in the pilot
inserted into the fame zone. This design may be inconvenient when adding fuels, and gaps between
product).
the copper rods and3 shows
Figure the plate where
the heat TE modules
collector. Copper rods arearefitted may
installed causeFDAC
in earlier the failure of the STEG [18].
STEGs [4,18,19],
In the present
insertedunit,
intocopper
the fameplates are design
zone. This used as may thebe heat conductor.
inconvenient when This
adding avoids
fuels, andpossible gaps. This type
gaps between
of heat collector has several advantages: (1) It is easier to install several TE modules. In
the copper rods and the plate where TE modules are fitted may cause the failure of the STEG [18]. (2) There is
the present unit, copper plates are used as the heat conductor. This avoids possible gaps. This type
no intrusion into the combustion chamber. (3) It works with various types of fuel, i.e., flaming fuels
of heat collector has several advantages: (1) It is easier to install several TE modules. (2) There is no
such as dried twigs,
intrusion intoand flamelesschamber.
the combustion fuels, such(3) It as
workscharcoal.
with various Thetypes
disadvantage is the fuels
of fuel, i.e., flaming weight suchof the heat
collector. A
as pilot product
dried twigs, andwith dimensions
flameless fuels, suchof as 265 mm The
charcoal. × 173 × 320 mm,
disadvantage is thebased
weight onofthethe present
heat STEG,
is shown oncollector.
the rightA pilot
side product with dimensions
of Figure 2a, and itofhas 265all
mmfunctions
× 173 × 320indicated
mm, based on in the
Figurepresent
1. STEG,
The mass is weight
shown on the right side of Figure 2a, and it has all functions indicated in Figure 1. The mass weight
of the pilot product is 8.42 kg, which is 0.26 kg heavier than the BioLite BaseCamp [19].
of the pilot product is 8.42 kg, which is 0.26 kg heavier than the BioLite BaseCamp [19].
Figure 3. The heat collector. Left: copper rods inserted into the flame zone (a photograph of part of
Figure 3. The heat collector.
the CampStove Left:copper
[19]); right: copper rods
plates inserted
forming into
part of the flame zone
the combustion (a in
chamber photograph of part of the
the present unit.
CampStove [19]); right: copper plates forming part of the combustion chamber in the present unit.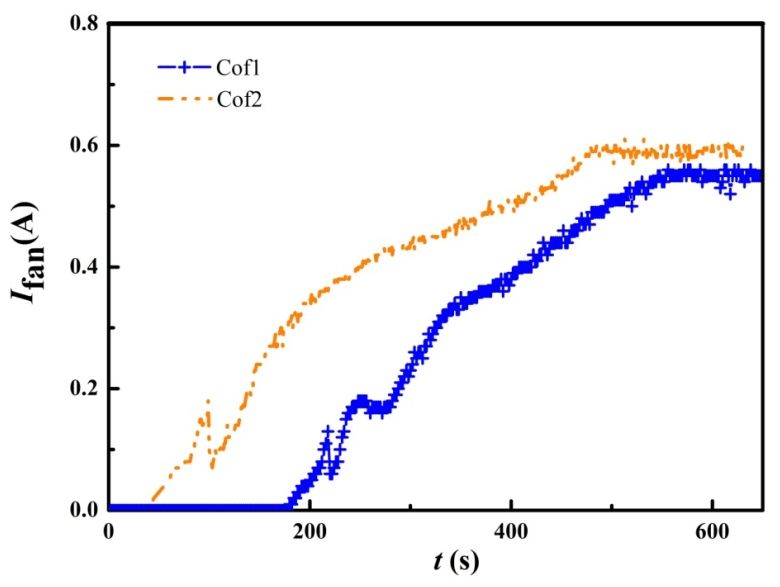
Materials 2018, 11, 966 6 of 17
Table 1. The errors of the measured parameters.
Materials 2018, 11, x FOR PEER REVIEW 6 of 17
Parameter Error (%) Parameter Error (%)
Table 1. The errors of the measured parameters
U ±0.5 I ±0.5
Parameter
P Error
±0.5(%) Parameter
T Error±(%)
0.5
U
ξ DC ±0.5
± 1.0 I
V ex,ave ±0.5
±2.0
Qconv
P ± 3.0
±0.5 Tξ ±5.0
±0.5
ξDC ±1.0 Vex,ave ±2.0
3. Results and Discussions Qconv ±3.0 ξ ±5.0
3. Results
3.1. Startup and Discussions
Performance
A typical
3.1. Startup startup process is shown in Figure 4 with the atmospheric temperature lying between
Performance
21 ◦C and ◦ C during the experiments. After ignition, heat will be conducted to the hot end of the
A 22
typical startup process is shown in Figure 4 with the atmospheric temperature lying between
TE modules,
21 °C andincreasing
22 °C duringthethehot end temperature.
experiments. Meanwhile,
After ignition, heat
heat will be conducted
conducted tothrough
the hot endthe TE module
of the
reaches the finned heat sinks. The heat capacity of the heat sinks results in
TE modules, increasing the hot end temperature. Meanwhile, heat conducted through the TE modulea certain temperature
difference,
reaches which produces
the finned voltage
heat sinks. The by the
heat TE modules.
capacity After
of the heat a certain
sinks results time (218 s),temperature
in a certain the cooling fan
difference,
begins to work.which produces
This is similar voltage by theofTE
to the result modules. test
a previous After[4],
a certain
which time (218 s),
indicated theitcooling
that fan
takes 120–300 s
begins
for the to work.
cooling fan This is similar to the
to self-startup. Theresult of a previous
self-startup timetest [4], which
depends on indicated
the flamethat it takes inside
intensity 120– the
300 s for chamber
combustion the coolingand
fan the
to self-startup.
heat capacity The of
self-startup time depends
the heat sink. The hoton endthetemperature,
flame intensityTinside
h , cold end
the combustion chamber and the heat capacity of the heat sink. The hot end temperature, Th, cold end
temperature, Tc , temperature difference, ∆T, closed circuit input voltage, Uin , and fan current, Ifan ,
temperature, Tc, temperature difference, ΔT, closed circuit input voltage, Uin, and fan current, Ifan, are
are shown in Figure 4. After 850 s, the cooling fans maintain at the normal operating speed, then the
shown in Figure 4. After 850 s, the cooling fans maintain at the normal operating speed, then the
inputinput
voltage undergoes
voltage undergoes a rapid
a rapidincrease,
increase, indicating extraelectricity
indicating extra electricity is produced
is produced andand available.
available.
(a) (b)
Figure 4. The self-startup process of the STEG. (a) The hot end temperature, Th, cold end temperature,
Figure 4. The self-startup process of the STEG. (a) The hot end temperature, Th , cold end temperature,
Tc, and temperature difference, ΔT; (b) the closed circuit input voltage, Uin, and the fan current, Ifan
Tc , and temperature difference, ∆T; (b) the closed circuit input voltage, Uin , and the fan current,
(Cod1 heat conducting plate, HS1 heat sink, YNJAD the cooling fan and Cof1 the TE module
Ifan (Cod1 heat conducting plate, HS1 heat sink, YNJAD the cooling fan and Cof1 the TE module
configuration).
configuration).
The electricity consumed by each cooling fan is 1.59 W, which is comparable to that of [4], and
itThe
is larger than that
electricity of the CampStove
consumed [19]. Note
by each cooling fanthat the W,
is 1.59 CampStove
which isand BaseCampto[19]
comparable areoffitted
that [4], and it
with a Li-ion battery, which provides electricity to the cooling fan during startup. These have to be
is larger than that of the CampStove [19]. Note that the CampStove and BaseCamp [19] are fitted
charged before initial use. One advantage of the FDAC STEG is its compact volume and portable
with a Li-ion battery, which provides electricity to the cooling fan during startup. These have to be
weight. However, its output power is low. The electricity consumed by the cooling fans in the present
charged
unit, before initial use.
Pfan, is calculated by: One advantage of the FDAC STEG is its compact volume and portable
weight. However, its output power is low. The electricity consumed by the cooling fans in the present
unit, Pfan , is calculated by: U I
Pfan = out fan (1)
Uξout
DC I
fan
Pfan = (1)
ξ DC
where Uout is the output voltage (5.2 V) of the DC-DC converter, and the total Pfan equals 4.1 W. As a
where Uoutit needs
result, is theabout
output
850voltage (5.2and
s to startup, V) all
of the
theelectricity
DC-DC generated
converter,
byand total Pis
themodules
the TE equals 4.1 W.
fanconsumed
As a result, it needs about 850 s to startup, and all the electricity generated by the TE modules is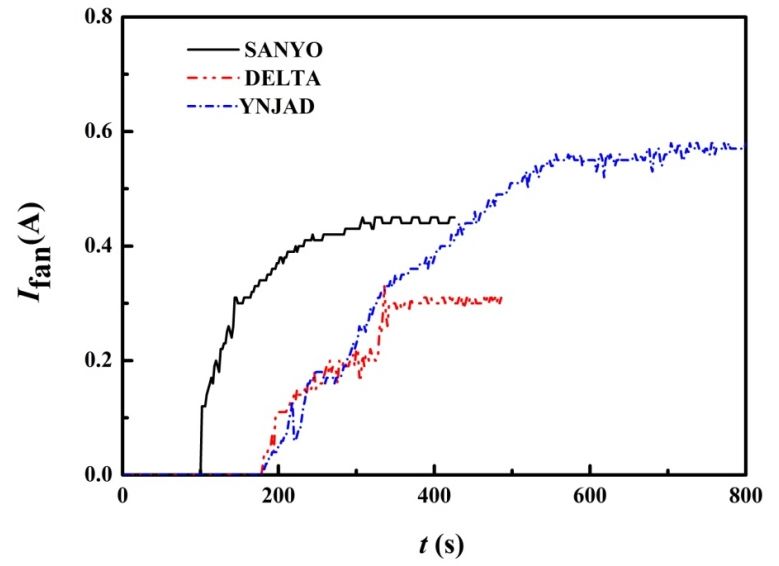
Materials 2018, 11, 966                                                                                 7 of 17

consumed by the cooling fans during startup. Therefore, a battery is needed by both CampStove
and BaseCamp [19] to start the cooling fan, or the heat sink should be designed to have enough heat
capacity [18], which means more weight and volume. An alternative way is to include more TE
modules, as in the present unit. Therefore, a novel heat collector (shown in Figure 3) is designed to
include as many as eight TE modules. The disadvantage of the present STEG is higher cost, but it
has larger output power, and it is not fitted with a battery, ensuring a long life. As shown in Figure 4,
the corresponding temperature difference is 60 ◦ C at 850 s, which means that a larger temperature
difference is needed in order to extract electricity.

3.2. Power Load Feature
     It is widely held that a power load test should be performed to find the maximum output power,
and several previous studies have carried out such tests [2,9,15]. However, to the best of the authors’
knowledge, no previous studies have tested the power load feature when adopting a DC-DC converter.
A DC-DC converter is important since the external load, such as batteries, lamps and electronic devices,
have to work within a certain voltage range. The present work tries to probe for some understanding of
this matter. The DC-DC converter used in the present unit maintains an output voltage of 5.0 V, yet the
output voltage will fall if the input voltage is too low, i.e., the input voltage has to be 0.5 V higher
than the output voltage. Therefore, a workable output voltage range is defined as 4.9 V < Uout < 5.0 V,
and the electric power output should last at least 15 min after adding the load. Results are shown in
Figure 5, presenting the hot end temperature, Th , cold end temperature, Tc , temperature difference, ∆T,
output voltage, Uout , load current, I, and the electricity power, P, under different load resistances, Rload .
     Surveying previous studies, it is obvious to conclude that there is a critical load resistance to
extract maximum electric power [2,9,15], i.e., when the load resistance equals the internal resistance
of the TE modules. For example, the maximum P equals about 0.8 W when Rload = 3 Ω (∆T = 68 ◦ C)
in [2], while the maximum P equals 1.0 W when Rload = 1.7 Ω (∆T = 99 ◦ C) in [9], and the maximum
P = 2.4 W when Rload = 7 Ω (∆T = 150 ◦ C) in [15]. For load resistances smaller than the critical one,
the output electricity remains, even though it is smaller than the maximum electric power [2,9,15].
     When using a DC-DC converter, as shown in Figure 5b, lower load resistance results in larger
electric power outputs, or the DC-DC converter fails to maintain a constant voltage when the load
resistance is too low, which means the whole STEG will crash. The crash is caused by the low output
voltage since it is directly affecting the working speed of the cooling fans. As shown in Figure 5, all the
experiments were conducted at a comparable temperature difference, i.e., 145 ◦ C ≤ ∆T ≤ 148 ◦ C,
and atmospheric temperature between 21 ◦ C and 22 ◦ C. The STEG requires a minimum load of 3 Ω
to function fully. The corresponding electric power output is 8.25 W, which is greater than that of
BaseCamp [19]. The shell of a pilot product based on the present STEG unit has a minor effect on
the electric power output. Tests showed that the pilot product of the STEG is still able to supply
over 8.0 W of electric power. Another phenomenon is that the electric power output decreases
rapidly with the load resistance, e.g., P = 8.25 W when Rload = 3 Ω and P = 2.5 W when Rload = 10 Ω.
Therefore, a suitable load is critical to extract maximum electric power. With regard to a single TE
module’s output, the present STEG is able to generate electric power:

                                              Pmax    Pf an
                                      PTE =         +       = 1.85 W                                       (2)
                                              Nξ DC    N

where N is the number of TE module installed in the STEG. This is comparable to the CampStove
and BaseCamp [19] and is 0.55 W less than that of [15] (water-cooled STEG) at the same
temperature difference.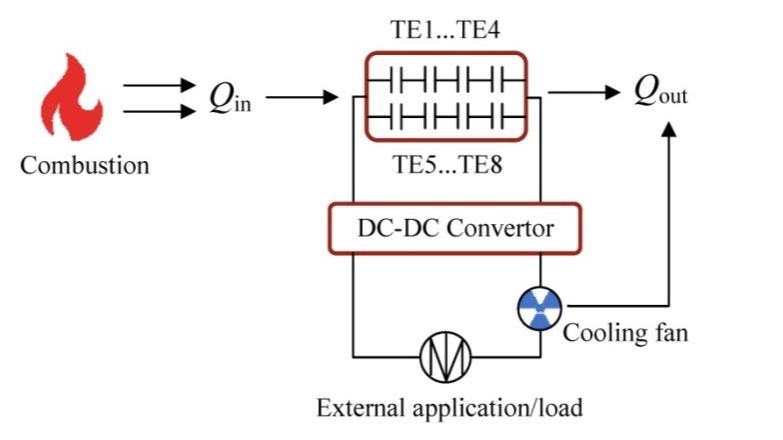
Materials 2018, 11, 966 8 of 17
Materials 2018, 11, x FOR PEER REVIEW 8 of 17
(a) (b)
Figure 5. The power load feature of the STEG with a DC-DC converter. (a) The hot end temperature,
Figure 5. The power load feature of the STEG with a DC-DC converter. (a) The hot end temperature,
Th, temperature difference, ΔT, and the closed circuit input voltage, Uin; (b) the output voltage, Uout,
Th , temperature difference, ∆T, and the closed circuit input voltage, Uin ; (b) the output voltage, Uout ,
the load current, I, and the electric power output, P. (Cod1 heat conducting plate, HS1 heat sink,
the load current, I, and the electric power output, P. (Cod1 heat conducting plate, HS1 heat sink,
YNJAD cooling fan and Cof1 TE module configuration).
YNJAD cooling fan and Cof1 TE module configuration).
The maximum power point tracking (MPPT) DC-DC converter is widely used in solar power
The maximum
generation power
[21,22]. This point tracking
technology (MPPT) DC-DC
was employed converter is[23–25]
in TE generators widelyand usedwasin solar power
adopted in
generation [21,22]. This technology was employed in TE generators [23–25]
Champier’s work [10] and Montecucco’s works [11,12] in STEG studies. In the present work, a regular and was adopted in
Champier’s work [10] and Montecucco’s works [11,12] in STEG studies.
DC-DC converter was chosen instead of an MPPT DC-DC converter. The present STEG offers electric In the present work, a regular
DC-DCoutput
power converter wasas
as high chosen
1.6 A instead
at 5.0 V,ofwhich
an MPPT DC-DC
is enough forconverter. The present
most available STEG offers
USB devices. electric
USB devices
power output as high as 1.6 A at 5.0 V, which is enough for most available USB
have their own power manager, and their charging current is controlled (mostly limited to 1.0 A). For devices. USB devices
have their
some USB own power
devices manager,
charging withand2 A, their charging
their power current
managers is controlled
were designed (mostly to limited to 1.0 A).
be self-adapting
For some1 USB
between A and devices charging
2 A. There with 2that
is no doubt A, their
the MPPTpower managers
DC-DC were helps
converter designed to be the
to extract self-adapting
electricity
between 1 A and 2 A. There is no doubt that the MPPT DC-DC converter
as much as possible. However, it has to work with a battery, and the battery should accept helps to extract the electricity
all the
as much as possible. However, it has to work with a battery, and the battery
provided electric energy. In case the electric power output is large enough for USB devices, the MPPT should accept all the
provided electric energy. In case the electric power output is large enough
DC-DC converter is no longer needed. This may lead to a certain waste of electric power, yet for USB devices, the MPPTthe
DC-DC converter is no longer needed. This may lead to a certain waste
STEG becomes easier to use. Users do not have to charge the battery for maintenance and before use. of electric power, yet the
STEG becomes
Meanwhile, easier
users do to
notuse.
haveUsers do not
to wait have the
before to charge
STEG the battery
is ready forforelectricity
maintenance and For
output. before use.
future
Meanwhile, users do not have to wait before the STEG is ready for electricity
STEGs that have to incorporate a battery, an MPPT DC-DC converter should be used. The present output. For future STEGs
that have
STEG to incorporate
is ready a battery,
to adopt a mating an MPPT DC-DC
combination of an MPPTconverter
DC-DC should be used.
converter andThe present
a battery. A STEG
tunable is
ready to
MPPT adoptconverter
DC-DC a mating can combination
be obtained of an MPPT
widely onDC-DC
the open converter
market. and a battery. A tunable MPPT
DC-DC converter can be obtained widely on the open market.
3.3. TE Efficiency
3.3. TE Efficiency
In order to determine the TE efficiency, the amount of heat dissipation by the heat sinks is
In order to determine the TE efficiency, the amount of heat dissipation by the heat sinks is
calculated approximately, according to the following equations [26],
calculated approximately, according to the following equations [26],
Q = c m (T −T )
∞ )
out = c pm ex( T out,ave − T (3)(3)
Qout p ex out,ave ∞
mex = 0.25πd2 Vex,ave ρex,ave ( Tex,ave ) (4)
mex = 0.25πd 2Vex,aveρex,ave(Tex,ave) (4)
Therefore, the TE efficiency can be derived from the following equations [26],
Therefore, the TE efficiency can be derived fromPtotthe following equations [26],
ξ= (5)
Ptot + Qout
P
ξ P=tot = NP
tot
TE (5)(6)
Ptot + Qout
Therefore, the total electric power is about 14.79 W. The average exhaust air velocity from the
heat sink is 1.40 m/s, and the average exhaust air temperature is approximately 50.5 ◦ C, while the
exhaust pipe diameter is 120 mm. Therefore, the
= NP
Ptot air (6)
TE flow rate from the heat sinks can be derived
mass
(17.3Therefore,
g/s). The average ◦ C, and the atmospheric air
the totaloutlet airpower
electric temperature of14.79
is about the heat sinksaverage
W. The was 58.0
exhaust air velocity from the
heat sink is 1.40 m/s, and the average exhaust air temperature is approximately 50.5 °C, while the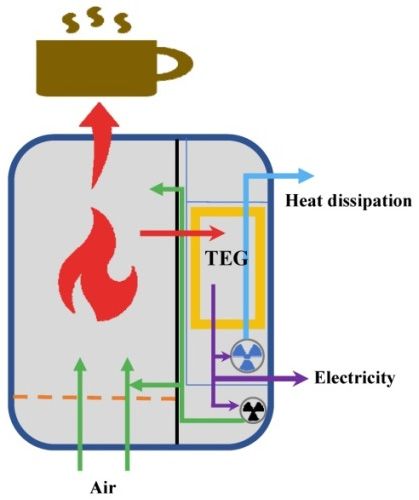
Materials 2018, 11, 966                                                                                     9 of 17

temperature was 22.0 ◦ C during the experiments. As a result, the amount of heat dissipation by the
heat sinks is approximate 625.9 W. Finally, the TE efficiency is calculated to be 2.31% at a temperature
difference of 148 ◦ C. The measured data of the flue gas are summarized in Table 2.
     One advantage of the present STEG is the possible combined heat and power (CHP) application,
which is proposed by water-cooled STEG studies [8–12]. Few previous FDAC STEG studies proposed
a CHP design, while all the previous FDAC STEGs used the heated air as the combustion air. As shown
in Table 2, the TE efficiency is around 3% for available STEGs. Therefore, enough TE modules have
to be employed in order to design a CHP application, while the heat collector is the essential issue
in order to install several TE modules. The present work proposed a novel heat collector to install as
many as eight TE modules. Therefore, the heat dissipation power is 625 W, which is transferred to the
clean air. As a result, a CHP application is obvious. Tests showed that the present STEG can warm
a double resident tent from 5 ◦ C–22 ◦ C after 20 min of heating when the ambient temperature is 5 ◦ C.
The present STEG is able to provide warm air as long as 3.0 h when burning an amount of 0.85 kg
of charcoal. As shown in Figure 1, the combustion air was supplied by another blower. The heating
problem for tents is difficult to solve by solar power generation and a high-power electrical heater,
since a large amount of electricity is not available for many tents.

                                            Table 2. The measured data of the flue gas.

                            Parameter                 Value            Parameter               Value
                             Uout (V) *               4.98              d (mm)                  120
                                I (A)                 1.66            Tex,ave (◦ C)             50.5
                              Ifan (A)                0.61            Tout,ave (◦ C)            58.0
                              ξ DC (%)                77.3              T ∞ (◦ C)               22.0
                           V ex,ave (m/s)             1.40               ξ (%)                  2.31
                               * The output voltage of the DC-DC converter for cooling fans is 5.2 V.

      The TE efficiency can be approximately derived theoretically by [26]:
                                                                                     −1
                            Th − Tc                       Th − Tc

                                               2                       4     1 + n/L
                ξ theo    =           (1 + 2rw) 2 − 0.5            +                                           (7)
                              Th                            Th        ZTh    1 + 2rw

where r is the ratio of thermal contact, w is the ratio of ceramic thickness to that of the thermo-element
and n the ratio of electrical resistivity. For Bi2 Te3 -based TE modules and the TE module dimensions
of the present unit, w = 0.516. Both r and n are estimated to be 0.1, where n is in millimeters. L is
the length of the thermo-element (leg), and Z is the TE figure-of-merit, which is estimated to be
1.0 × 10⁻³ K−1 [26]. For the parameters shown in Table 2, Th = 473 K, Tc = 325 K. As a result, the TE
efficiency is estimated to be 2.57%. The Z value of Bi2 Te3 is well recognized, yet it is possible that r and
n may vary from one manufacturer to another. Statistical studies show that the theoretical TE efficiency
varies between 2.20% and 2.79% when 0.05 ≤ r ≤ 0.2 and 0.05 ≤ n ≤ 0.2, which is believed to be the
case for most available Bi2 Te3 -based TE modules [26]. Therefore, the experimental TE efficiency agrees
well with the theoretically predicted value.
      The TE efficiency of various STEG is shown in Table 3, which shows that the low efficiency of
STEG is the major problem for large-scale applications.

                                    Table 3. Thermoelectric efficiencies of various STEGs.

                          ∆T (K)        TE Material             ξ      Cooling Method          References
                            200              Bi2Te3             2%        water cooled              [9]
                          150–200            Bi2Te3           4–5%        water cooled           [11,12]
                            150              Bi2Te3            3.2%         NDAC                   [15]
                            148              Bi2Te3           2.31%         FDAC                 present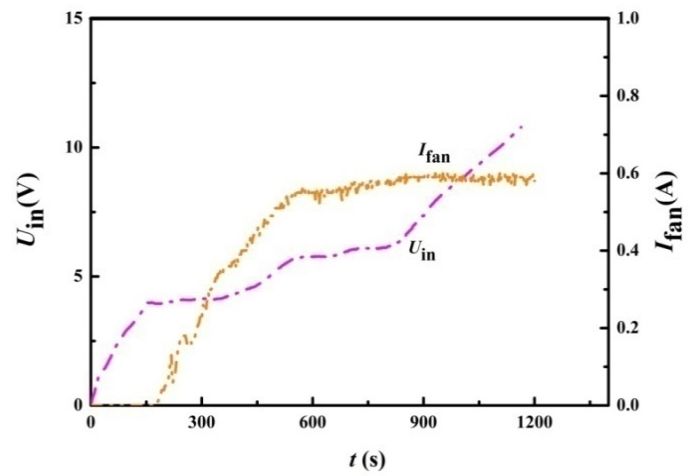
200         Bi2Te3       2%        water cooled           [9]
                                150–200       Bi2Te3      4–5%       water cooled        [11,12]
                                  150         Bi2Te3      3.2%         NDAC                [15]
                                  148         Bi2Te3      2.31%        FDAC              present

    Materials 2018, 11, 966                                                                                        10 of 17
3.4. Influence of the Heat-Conducting Plate’s Thickness on the Output Power
     The
    3.4.   advantage
         Influence of theof the present heat
                         Heat-Conducting     collector
                                         Plate’s        is that
                                                 Thickness on theitOutput
                                                                   provides  enough space to install as many as
                                                                          Power
eight TE modules, and its temperature controlling method is to incorporate a copper plate with an
          The advantage of the present heat collector is that it provides enough space to install as many as
appropriate thickness. This temperature controlling method, i.e., controlled heat flux, was widely
    eight TE modules, and its temperature controlling method is to incorporate a copper plate with an
usedappropriate
      in earlier STEGs      [4,18,19].
                   thickness.           Copper plates
                               This temperature           withmethod,
                                                  controlling    different   thicknesses,
                                                                          i.e.,              shown
                                                                                controlled heat   flux,in
                                                                                                        wasTable
                                                                                                             widely4, were
                                                                                                                       used tried
to explore
    in earlierthe
               STEGsinfluence    of Copper
                         [4,18,19]. the thickness     on the
                                             plates with        output
                                                           different     power and
                                                                      thicknesses,   shownthe in
                                                                                               temperature
                                                                                                  Table 4, werelevel.
                                                                                                                   tried Results
                                                                                                                          to
indicated    thatinfluence
    explore the       the 1.8-mm       copperonplate
                             of the thickness            caused
                                                  the output   powerexcessive      temperature
                                                                       and the temperature      level.for  dried
                                                                                                        Results      twigs, i.e.,
                                                                                                                 indicated
temperatures      may copper
    that the 1.8-mm      exceedplate
                                  250 °C,   which
                                        caused      is not temperature
                                                excessive    allowed for for thedried
                                                                                  present   TEi.e.,
                                                                                        twigs,   modules.     For the
                                                                                                      temperatures       present
                                                                                                                       may
STEG,
    exceed   250to◦ C,
        it has       bewhich
                        able to   work
                               is not    steadily
                                      allowed  for using    various
                                                   the present        solid fuels,
                                                                  TE modules.     Forsuch    as dried
                                                                                       the present       twigs,
                                                                                                       STEG,      dried
                                                                                                              it has  to beleaves,
    able  to work    steadily using   various solid  fuels, such  as dried   twigs,  dried  leaves,
charcoals or cattle manure (nomadic people). For the above solid fuels, tests found that the burning  charcoals   or  cattle
    manure
of dried      (nomadic
            twigs    in thepeople).
                              presentForSTEG
                                          the above   solid fuels,
                                                resulted     in thetests foundtemperature
                                                                      highest     that the burning      of dried
                                                                                                    level.        twigscharcoal
                                                                                                            Burning       in
    the present    STEG    resulted  in the highest   temperature    level.   Burning    charcoal
provided a smooth, steady temperature level, so it was used as the fuel in the present work.         provided   a smooth,
    steady temperature level, so it was used as the fuel in the present work.
                              Table 4. Thickness of the conducting heat plate for optimization.
                                Table 4. Thickness of the conducting heat plate for optimization.
                                         No.      Thickness (mm) Temperature Level
                                       No.
                                        Cod1           Thickness
                                                        1.5       (mm)
Materials 2018, 11, 966 11 of 17
3.5. Influence of Heat Sink Dimension on the Output Power
Materials 2018, 11, x FOR PEER REVIEW 11 of 17
Finned heat sinks are ordinary heat dissipating devices and are the key component in creating
3.5. Influence
a temperature of Heat Sink
difference inDimension
a STEG. on the Output
Several finnedPowerheat sinks with a similar total fin cross-section
area (59.2Finned 2
cm –68.6 2
heatcm
sinks), are
shown in Table
ordinary 5, were tried
heat dissipating to investigate
devices their
and are the key influenceinon
component the electric
creating a
power output. The
temperature width in
difference of athe TE Several
STEG. modulefinned is 40 heat
mm,sinks
and with
the diameter of the
a similar total bolts shouldarea
fin cross-section be over
4 mm, (59.2 cm2–enough
while 68.6 cm2),space
shown in Table
should be5,left
weretotried
drilltoholes
investigate
in thetheir
heatinfluence
sinks inonorder
the electric power the
to assemble
output. The width of the TE module is 40 mm, and the diameter
STEG. Therefore, the minimum width of the heat sink is 60 mm. The optimizing results are of the bolts should be over 4 mm, shown
while enough space should be left to drill holes in the heat sinks in
in Figure 7. As shown, for HS2 and HS3 with similar fin height and similar fin area, the maximumorder to assemble the STEG.
Therefore, the minimum width of the heat sink is 60 mm. The optimizing results are shown in Figure
electric power output with HS2 is 19.3% (0.65 W) higher than that with HS3, indicating that the fin
7. As shown, for HS2 and HS3 with similar fin height and similar fin area, the maximum electric
gap may be important since it is related to the wind resistance. For HS1, which has increased fin area
power output with HS2 is 19.3% (0.65 W) higher than that with HS3, indicating that the fin gap may
and fin
be gap, the electric
important since itpower
is relatedoutput
to theiswind
augmented
resistance.significantly.
For HS1, whichThehas
electric power
increased finoutput
area and is fin
double
that of HS2.
gap, When power
the electric optimizing
outputthe heat sink,significantly.
is augmented weight has The to be considered,
electric not just
power output heat dissipating
is double that of
capability. For the
HS2. When pilot product
optimizing the heat whose STEG has
sink, weight coretoisbethe present unit,
considered, shown
not just in Figure capability.
heat dissipating 2a, the electric
power output
For is 60%
the pilot larger
product whosethanSTEG
that core
of BaseCamp
is the present [19]unit,
for ashown
comparable
in Figureweight
2a, the(3.2% heavier
electric power than
output is
BaseCamp); 60% larger
therefore, than that
no further of BaseCamp
optimization of [19] for asink
the heat comparable weight
was carried out.(3.2% heavier than
BaseCamp); therefore, no further optimization of the heat sink was carried out.
Table 5. Characteristics of different heat sinks for optimization.
Table 5. Characteristics of different heat sinks for optimization.
No. No.L ×LW×W×H ×H(mm)
(mm) FinArea
Fin Area(m(m2)2 ) FinFin Number Fin Gap
Number Fin Gap
(mm)(mm) Fin Cross-Section
Fin Cross-Section AreaArea
2
(cm2)(cm )
× 88
HS1 HS1 215 215 × 56
× 88 × 56 0.42
0.42 19 19 2.982.98 61.3 61.3
× 98
HS2 HS2 215 215 × 31
× 98 × 31 0.34
0.34 29 29 2.202.20 68.6 68.6
× 70
HS3 HS3 215 215 × 32
× 70 × 32 0.35
0.35 25 25 1.641.64 59.2 59.2
Figure 7. The power load feature of the STEG as different heat sinks were used.
Figure 7. The power load feature of the STEG as different heat sinks were used.
Limited conclusions can be drawn from the optimization of heat sinks. The heat dissipation rate
Limited conclusions
of the heat canless
sink should be bethan
drawn from2, the
745 W/m optimization
while of heat sinks.
the fin gap is important The heatthe
for decreasing dissipation
wind
rate of the heat sink should be less than 745 W/m2 , while the fin gap is important for decreasing the
resistance.
wind resistance.
3.6. Influence of Cooling Fan Selection on Startup Performance and Power Output
3.6. Influence
For of Cooling
FDAC Fanthe
STEGs, Selection onof
selection Startup Performance
the cooling fan mayand Power
affect Outputprocess and the electric
the startup
power
For FDACoutput. Threethe
STEGs, different typesofofthe
selection cooling fans,
cooling fanwith dimensions
may affect theofstartup
9 cm × 9process
cm × 2.5and
cm, shown
the electric
power output. Three different types of cooling fans, with dimensions of 9 cm × 9 cm × the
in Table 6, were tested to optimize the cooling effect. It should be noted that the air flow rates and 2.5 cm,
power consumed in Table 6 were measured with a Peakmeter MS6252B turbo type anemometer and
shown in Table 6, were tested to optimize the cooling effect. It should be noted that the air flow rates
an ammeter after fitting the cooling fans with HS1 heat sinks and under operating conditions. All
and the power consumed in Table 6 were measured with a Peakmeter MS6252B turbo type anemometer
three cooling fans have double ball bearings, yet minor differences may still exist.
and an ammeter
The DELTA afterand
fitting the cooling
YNJAD coolingfansfanshave
withsimilar
HS1 heat sinks
startup and underi.e.,
performance, operating
about 200conditions.
s are
All three cooling fans have double ball bearings, yet minor differences may still exist.
needed for self-startup, as shown in Figure 8. However, the self-startup of SANYO cooling fans is
The
much DELTA
faster, and YNJAD
needing onlycooling fans
about 110 s. have similar
On the other startup performance,
hand, DELTA and SANYOi.e., about 200fans
cooling s are needed
need
for self-startup, as shown in Figure 8. However, the self-startup of SANYO cooling fans is much faster,Materials 2018, 11, 966 12 of 17
needing only about 110 s. On the other hand, DELTA and SANYO cooling fans need about 350 s to
reach normal operating speed, but YNJAD cooling fans need about 700 s. Therefore, the SANYO
cooling fanMaterials
is a promising candidate when startup speed takes priority.
2018, 11, x FOR PEER REVIEW 12 of 17
about 350 s to reach normal
Table operating speed,
6. Different butcooling
types of YNJADfan
cooling fans need about 700 s. Therefore,
for optimization.
the SANYO cooling fan is a promising candidate when startup speed takes priority.
TypeREVIEW
Materials 2018, 11, x FOR PEER No. Flow Rate (m3 /h) Power (W) 12 of 17
Table 6. Different types of cooling fan for optimization.
SANYO Type No. Flow 20.5 (m3/h) Power (W) 1.15
about 350 s to reach normal operating speed, Rate
but YNJAD cooling fans need about 700 s. Therefore,
DELTA SANYO 20.120.5 1.15 0.94
the SANYO cooling fan is a promising candidate when startup speed takes priority.
YNJAD DELTA 26.520.1 0.94 1.59
YNJAD 26.5 1.59
Table 6. Different types of cooling fan for optimization.
Type No. Flow Rate (m3/h) Power (W)
SANYO 20.5 1.15
DELTA 20.1 0.94
YNJAD 26.5 1.59
Figure 8. Influence of cooling fan selection on the STEG startup performance (HS1 heat sink, Cod1
Figure 8. Influence of cooling fan selection on the STEG startup performance (HS1 heat sink, Cod1 heat
heat conducting plate and Cof1 configuration).
conducting plate and Cof1 configuration).
For the present STEG, electric power out is the most important consideration, i.e., it should be
designed to extract as much electricity as possible. The power load feature for these three different
For the present
Figure 8.STEG,
Influence electric
of cooling power out on
fan selection is the
theSTEG
most important
startup consideration,
performance i.e., it should be
(HS1 heat sink, Cod1
cooling fans is shown in Figure 9. It is obvious that the maximum electric power output is closely
heat conducting plate and Cof1 configuration).
designed to extract
related to theasairmuch electricity
flow rate. Choosing asYNJAD
possible. The power
produced load feature
higher maximum electricfor these
power three
(8.25 W) different
compared
cooling fans isFor
shownto thatin (about
Figure 7.0 9.
W)Itofistheobvious
other twothat
typesthe
of cooling
maximum fan. Statistical
electric analysis
power shows
outputthat is closely
the present STEG, electric power out is the most important consideration, i.e., it should be
related to the
the coolingtoair
air flow
designed flow rate should
rate.as Choosing
extract much be greater
YNJAD
electricity than 3.31The
produced
as possible. m3/hpower
per TE
higher module.
load featureNotice
maximum thatthree
the choice
electric
for these power of
different (8.25 W)
heat-conducting
cooling fans is plate
shown thickness,
in Figure 9.heat
It is sink dimensions
obvious that the and
maximumcooling fans
electric are
power inter-dependent.
output is closely
comparedDifferent
to that (about 7.0 W)fans of and
the heatother two types of cooling and fan. Statistical analysis shows
related totypes
the airof flow
cooling
rate. Choosing sinks
YNJAD may be employed,
produced higher3maximum the electric
present optimizations
power (8.25 W)
that the cooling air flow rate
provide experimental datashould
to select be greatercombinations
appropriate than 3.31 of mcooling
/h per fansTE andmodule.
heat sinks. Notice that the
compared to that (about 7.0 W) of the other two types of cooling fan. Statistical analysis shows that
choice of heat-conducting
the cooling air flowplate thickness,
rate should heatthan
be greater sink3.31
dimensions
m3/h per TEand cooling
module. Noticefans
that are inter-dependent.
the choice of
Different types of cooling plate
heat-conducting fans and heat sinks
thickness, maydimensions
heat sink be employed, and thefans
and cooling present optimizations provide
are inter-dependent.
experimentalDifferent
data totypes of cooling
select fans andcombinations
appropriate heat sinks may of be cooling
employed, andand
fans the heat
present optimizations
sinks.
provide experimental data to select appropriate combinations of cooling fans and heat sinks.
Figure 9. Influence of cooling fan selection on STEG output power performance (HS1 heat sink, Cod1
heat conducting plate and Cof1 configuration).
Figure 9. Influence of cooling fan selection on STEG output power performance (HS1 heat sink, Cod1
Figure 9. Influence of cooling fan selection on STEG output power performance (HS1 heat sink,
heat conducting plate and Cof1 configuration).
Cod1 heat conducting plate and Cof1 configuration).Materials 2018, 11, 966 13 of 17
3.7. Influence of the TE Module Configuration on the Startup Performance and Output Power
In line with the above discussions, the Cod1 heat-conducting plate, HS1 heat sink and YNJAD
cooling fan were chosen to build the present STEG, yet the configuration of TE modules still remained
to be optimized, i.e., different wiring configurations among the eight TE modules were to be optimized.
Previous studies have found that minor differences in temperature level may cause a significant
decrease in electric power output when placing the TE module in parallel upstream of the DC-DC
converter [24]. On the other hand, wiring the TE modules in series results in large input voltage,
which adversely affects the electric power output, which is caused by the transform efficiency of the
DC-DC converter. The transform efficiency of the DC-DC converter is mainly affected by the ratio
of the input voltage to the DC-DC converter and the output voltage (5.0 V). For the present STEG,
the open-circuit voltage when wiring TE modules in series is much higher than that when wiring TE
modules in parallel. This leads to a lower transform efficiency of the DC-DC converter, which results
in less electric power output. Furthermore, the configuration of TE modules affects the startup
performance, i.e., the input voltage has to be high enough to start the cooling fans during startup
as soon as possible. Two configurations are shown in Table 7. Other configurations were tried and
proved to be poor. The feasibility of Cof1 can be expected since two identical copper plates are installed
opposite one another, suggesting each side has almost the same temperature. Therefore, four TE
modules on each side can be wired in series, and the two groups then wired in parallel.
Table 7. Different types of TE module configurations for optimization.
Cof. No. Description
Cof1 4 modules in series, then the two groups in parallel
Cof2 8 modules in series
The startup performances using these two different configurations are shown in Figure 10.
The cooling fans started to work within 100 s for Cof2, while Cof1 needed about 216 s. This indicates
that Cof2 should be considered when startup speed takes priority. Concerning the electric power
output, shown in Figure 11, Cof1 has higher outputs than that of Cof2 under the same external
resistance. i.e., the maximum electric power output of Cof1 is 1.05 W (14.5%) greater than that of
Cof2 when Rload = 3 Ω, and the electric power output of Cof1 is 9.0% higher on average than that of
Cof2 when 3 Ω ≤ Rload ≤ 10 Ω. On the other hand, the temperature difference of Cof1 was between
145 ◦ C and 148 ◦ C during the experimental tests, while it was between 151 ◦ C and 153 ◦ C for Cof2.
The reason why the temperature difference is greater for Cof2 is related to the Peltier effect since less
current was generated under this configuration. Therefore, it is obvious that Cof1 is better than Cof2
when electric power output is more important. For the pilot product using the present STEG, the Cod1
heat-conducting plate, HS1 heat sink, YNJAD cooling fan and Cof1 TE module configuration were
finally chosen. Another advantage of the present STEG is the ease of augmenting the electric power
output with little modification. Initial experiments showed that the present STEG can be modified to
yield over 100 W of electricity power when water cooled while keeping the total weight under 20 kg.Materials 2018, 11, 966 14 of 17
Materials
Materials2018,
2018,11,
11,xxFOR
FORPEER
PEERREVIEW
REVIEW 14
14 of
of 17
17
Figure 10.
Figure10.
Figure Influence
10.Influence of
Influenceof TE
ofTE module
TEmodule configuration
moduleconfiguration on
configurationon STEG
onSTEG startup
STEGstartup performance
startupperformance (HS1
performance(HS1 heat
(HS1heat sink,
heatsink, Cod1
sink,Cod1
Cod1
heat conducting
heatconducting
heat plate
conductingplate and
plateand YNJAD
andYNJAD cooling
YNJADcooling fan).
coolingfan).
fan).
Figure 11.
Figure11.
Figure Influence
11.Influence of
Influenceof TE
ofTE module
TEmodule configuration
moduleconfiguration on
configurationon STEG
onSTEG output
STEGoutput power
outputpower (HS1
power(HS1 heat
(HS1heat sink,
heatsink, Cod1
sink,Cod1 heat
Cod1heat
heat
conducting plate
conductingplate
conducting and
plateand YNJAD
andYNJAD cooling
YNJADcooling fan).
coolingfan).
fan).
4.4.Conclusions
4. Conclusions
Conclusions
In the
In the
In present
the present work,
work, aaa stove-powered
present work, stove-powered thermoelectric
stove-powered thermoelectric generator
thermoelectric generator (STEG)
generator (STEG)
(STEG) waswas designed
was designed and
designed andand
optimized.
optimized. The
The startup
startup performance,
performance, power
power load
load feature
feature and
and thermoelectric
thermoelectric
optimized. The startup performance, power load feature and thermoelectric (TE) efficiency were (TE)
(TE) efficiency
efficiency were
were
studied
studiedinin
studied in detail.
detail.
detail. Optimization
Optimization
Optimization waswas
was performed,
performed,
performed, including
including
including the
theofeffect
the effect effect of
of heat-conducting
heat-conducting
heat-conducting plate
plate
plate thickness,
thickness,
thickness,
heat heat
heat sink
sink dimensions, dimensions,
sink cooling
dimensions, cooling fan
coolingand
fan selection fanTEselection
selection and
and TE TE module
module configuration. module configuration.
conclusionsSeveral
configuration.
Several Several
can be
conclusions
conclusions can
can bebedrawn
drawn based
based
drawn based on the result analysis. on
onthe
the result
resultanalysis.
analysis.
(1)
(1) For
(1) For the
For the present
the present STEG,
present STEG, the
STEG, the measured
the measured maximum
measured maximum electric
maximum electric power
electric power is
power is 14.79
is 14.79 W,
14.79 and
W, and
W, andit ititdecreases
decreases
decreasesto to
to
11.43
11.43 WW when
when the
the output
output voltage
voltage is
is maintained
maintained atat 55 V,
V, of
of which
which
11.43 W when the output voltage is maintained at 5 V, of which 3.18 W is consumed by the cooling 3.18
3.18 W
W is
is consumed
consumed by
by the
the
cooling
cooling
fans, fans,
fans,
while while
thewhile the
theremainder
remainder (8.25 W (8.25
remainder (8.25
at W
Wisat
5 V) 55V)
atready V)isto
isready
ready to
be used.tobebeused.
used.
(2) For the present STEG, the TE efficiency is about 2.31% at a temperature difference
(2)
(2) For
For the
the present
present STEG,
STEG, the
the TE
TE efficiency
efficiency is
is about
about 2.31%
2.31% at
at aa temperature
temperature difference of
difference 148
148 ◦°C,
of 148
of °C,
C,
based
based on
based on the
on the heat
the heat flow
heatflow method,
flowmethod, which
method,which which agrees
agrees
agrees well
well with
with
well the theoretically
the the
with theoretically predicted
predicted
theoretically value.
predictedvalue. This
This
value.
reveals
reveals
This that
thatthe
reveals thelow
that theefficiency
low efficiency
low of
ofthe
efficiency theofSTEG
STEG isisthe
the STEG theismajor
major
the majorproblem
problem for
problemforlarge-scale
large-scale applications.
for large-scaleapplications.
applications.
(3)
(3) Optimizations
Optimizations indicate
indicate that
that the
the heat-conducting
heat-conducting plate
plate thickness,
thickness, heat
heat sink
sink dimensions
dimensions and
and
(3) Optimizations indicate that the heat-conducting plate thickness, heat sink dimensions and cooling
cooling
cooling fan selection
fan selection should
should be coordinated
be coordinated to increase
to the
increase the temperature
the temperature difference and to control
fan selection should be coordinated to increase temperature differencedifference
and to controland to control
both the
both
boththe
thehothot end
endtemperature
temperature(below (below250 250 °C)
°C)and andthe thecold
coldendendtemperature
temperature(below (below70 70°C).
°C).For
For
the
thepresent
presenttypetypeof ofSTEG
STEGand andTE TEmodule
moduleused, used,the theheat
heatflux,
flux,based
basedon onthe
thecross-sectional
cross-sectionalarea areaYou can also read


