Compressive Strength of Solid Clay Brick Masonry under Eccentric Loading
←
→
Page content transcription
If your browser does not render page correctly, please read the page content below
Compressive Strength of Solid Clay Brick Masonry
                          under Eccentric Loading

                                                                    by

                      A. BRENCICH1, C. CORRADI1, L. GAMBAROTTA 1, G. MANTEGAZZA 2, E. STERPI1
                     1
                      Department of Structural and Geotechnical Engineering – University of Genoa – Italy
                                                2
                                                  RUREDIL s.p.a. - Milan - Italy

ABSTRACT                                                                 continuum. The compatibility conditions at the mortar/brick
Arches, vaults and pillars generally experience eccentric                interface lead to a tri-axial compressive stress state in the
normal force. As a consequence, the classical theories of                mortar and a tri-axial tensile-tensile-compressive one in the
masonry collapse, developed for concentrically                           brick, Figure 1, so that the brickwork collapse mechanism is
compressed brickwork, are not directly applicable. In this               that of vertical cracking of bricks. Being this masonry model
paper experimental data on solid clay brick and lime -                   an unlimited layered continuum, the stresses are assumed
mortar masonry prisms, eccentrically loaded, are                         uniform through both the brick and the mortar thickness.
presented. Comparing the results to the response of a FEM                Collapse takes place when the tensile stress in the brick,
model, some hints on the collapse mechanism of masonry                   calculated assuming linear [3] and non-linear [4, 5] elastic
show that the edge effects greatly affect the load carrying              relationships, attains its compressive-tensile-tensile
capacity of the brickwork. Besides, the plane section                    strength. Other theories rely on a limit analysis approach [6]
assumption is found to be acceptable up to the ultimate                  or on a limit strain condition [7] allowing more sophisticated
compressive strength, allowing relatively simple models to               failure criteria that turn out to be in reasonable agreement
be used for arch-type structures.                                        with the measured uniform compressive strength [5, 8].

                     1. INTRODUCTION

In many technical applications, mainly load bearing walls,
masonry experiences a substantially concentric loading; the
stress state, which is inhomogeneous because of the
intrinsic structure of brickwork, may be described by the
mean value of the local stress field. In these cases, masonry
can be modelled as an homogeneous brittle material and the
classical structural mechanics for continuum materials is
applicable. In order to evaluate the load carrying capacity
of the structure, failure criteria are derived from quasi-brittle
materials modified either on experimental grounds or on
theoretical work. This approach is suitable when the
intrinsic anisotropy and periodicity of masonry can be
averaged to macroscopic equivalent mechanical parameters
and failure criteria, i.e. for veneer walls, masonry panels and          Figure 1 – Triaxial stress state in the brick and in the mortar
their assemblages, and full buildings. When addressing
masonry pillars, arches or vaults, which experience eccentric              The simplest mechanical model that can be formulated for
normal forces, the evaluation of the compressive strength                masonry retains the assumption of an homogenous
from the properties of the different materials does not seem             equivalent material and needs, at least, the compressive
to have been investigated, while the experimental and                    strength and an equivalent elastic modulus to be given.
theoretical research on uniformly compressed masonry                     Only few experimental data on eccentric loading are
cannot be directly extended to this stress state.                        available [9, 10], mainly focused in defining the load
 Over the last decades research has concentrated on                      carrying capacity of the structural brickwork; poor detailing
deformation and failure theories for compressed masonry                  is given on the effective collapse mechanism. The only
and on the experimental testing of brickwork, both with the              detailed tests [11] refer to stone unit dry assemblages; the
aim of setting up some empirical failure criterion and of                absence of the mortar joints makes these data not very
defining the parameters of a mechanical model [1, 2].                    useful for solid clay brickwork. For this reason, a careful
 A common hypothesis based on some experimental                          investigation on masonry strength and collapse
evidence is that the mortar/brick interface does not                     mechanisms under non-uniform stresses is needed. The
experience sliding under concentric compressive stress                   present work is a step for setting up an adequate testing
states. Starting from this observation, many failure theories            procedure of solid clay brick masonry prisms and a first
in compression have been proposed most of which assume                   glance in the collapse mechanism of brickwork under
that masonry can be modelled as a layered unlimited                      eccentric loading.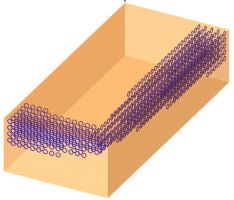
In order to evaluate the effect of the load eccentricity on     precision) and the overall dimensions.
the masonry resistance and collapse mechanisms, and with
the aim of extending the classical approach to masonry col-
lapse, a series of experimental tests have been performed on                                                 Load cell
short prisms of 5.5x11x24 cm solid clay bricks and 1:1:5
cement-lime mortar, intended to represent a typical
brickwork. The eccentric loading reproduces the stress
distribution typical of an arch, while symmetry conditions
allow the prism to represent a generic section of an arch, a
vault or a pillar. The prisms are 24 cm large, 11 cm thick and
27 cm high, reproducing mainly thin structures; the load
eccentricity ranges from 0 to 5/12 of the section height so                     4
that moderately to highly non uniform compressive stresses                 3
have been investigated.                                                             1          5              9
                                                                                                   6     2
  The results of the experimental tests are compared to FEM
analyses along with the theoretical and experimental
collapse mechanisms of the brickwork. Some comparisons
with other mechanical models, assuming masonry as an
unlimited layered continuum, are carried out.

                 2. TESTING PROCEDURE

The masonry prism consist of a stack of four 5.5x11x24 cm                               Figure 2 – Testing setup
bricks and five 10 mm thick mortar joints of 60 days of age;
the global height of the stack is therefore 270 mm. The
                                                                                                         Epoxy resin
upper and lower mortar joints are in direct contact with the
steel plates of the testing machine.
  The testing setup is represented in Figure 2; minor details
are omitted for the sake of simplicity. The load measuring
device is a C5 class HBM-RTN load cell with a 0.01%
precision and is located in-between the upper plate and the                    Brick                           Screw bolt
testing machine. The upper and lower plates are connected
through cylindrical hinges that allow the load line to be
                                                                  Figure 3 – Connection of the measuring devices to the brick
precisely identified. The relative displacements are
measured by means of mechanical devices with a 0.01mm
                                                                                            Table 1
precision (0.001 mm precision for testing the materials).
                                                                           Mechanical parameters for brick and mortar
   The displacement of the upper part of the machine is
                                                                              (experimental data and assumptions)
controlled and locked by means of a mechanical device; the
displacements between the specimen ends are measured in
three different points directly on the plates (bases 1, 2 and      BRICK
3) in order to quantify the absolute relative displacement of      Property             Value                     Notes
the steel plates and their relative rotation. Six sections are
                                                                                                           Direct compression
used to control the position of the central joint, two at the      Eb [N/mm2]       2400±200
                                                                                                         average on 3 specimens
extremities (4 and 9) and two on each side of the specimen at
                                                                                                           Direct compression
1/4th and 3/4th of the brick length (5 and 6 on one side, 7 and       νb            0.05±0.007
                                                                                                         average on 3 specimens
8 on the other one). The devices had been connected to the
                                                                  ft [N/mm2]           3.4±0.25        TPB - average on 3 specimens
specimen by means of screw bolts glued with epoxy resins
in the external part of the brick, Figure 3.                                                               Direct compression
                                                                  fc [N/mm2]           18.7±2.1
 The moving end of the machine is displacement controlled,                                               average on 6 specimens
while the load is measured thorough the load cell. In this          MORTAR
way, the load process is substantially a displacement-            Em [N/mm2]             335                      see text
controlled procedure. The load cell can be considered as a             νm                0.2                    Rots [15]
spring with high stiffness; up to the limit load this does not    ft [N/mm2]             1.4           Brencich et al. [16] – see text
affect the results at all; it significantly alters the
                                                                                                           Direct compression
measurements only far after the material collapse, at a point     fc [N/mm2]           14.7±0.6
                                                                                                         average on 6 specimens
when the softening curve has already lost any mechanical
meaning.
 Some of the material mechanical properties have been              The elastic modulus of the brick was found to be quite low,
measured in direct compression tests, according to EN196          but the measured figure fits well other experimental data on
standard, under displacement controlled loading and by            these materials [12] showing that clay brick units can exhibit
means of a testing setup similar to that of Figure 2 but for      unexpectedly low elastic moduli.
the load cell (50 kN C5 class AEP-TCE cell with a 0.01%            Even though the 1:1:5 cement-lime mortar was intended to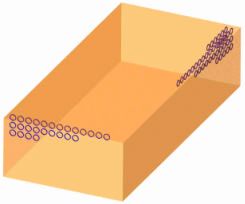
represent a typical European mortar with low compressive properties which are quite difficult to evaluate on the small
strength, the experimental outcome showed a very high specimen used to test the compressive strength of mortars.
strength in compression. The elastic modulus of the For these reasons, some of the mechanical values could not
masonry assemblage under concentric loading (12300 be measured and had to be assumed from literature.
N/mm2) fits reasonably well with some laboratory [13] and The Poisson’s ratio has been deduced from literature [15],
other in-situ tests on Italian historical railway bridges [14]. while the tensile strength was defined according to well
The tensile strength for brick of table 1 is the average over established data [16]. The elastic modulus of mortar was
three TPB tests. assumed in such a way to reproduce the global elastic
modulus of masonry. In the elastic part of the response,
250
under plane strain conditions, the equivalent modulus for
masonry EM can be calculated as a function of the
Load [kN]
35 45 50
mechanical parameters of the different materials [3]:
200
e/h=0 1 η η
28 32 = b + m +
e/h=0.18 EM Eb Em
150
22 e/h=0.27
First
νb Em − ν m Eb νm νb
a) acoustic
18
e/h=0.36 +2η mηb 2 − 2 , (1)
η m (1 − ν b ) E m + ηb (1 − ν m ) Eb Em Eb
emissions
100
14
where ηm = tm /( tm + tb ) ,ηb = tb /( tm + tb ) are the volume
50
fractions of mortar and brick and tm and tb are the respective
Displacement [mm]
thickness. Eq. (1) is essentially a combination rule of the two
distinct phases; a third term couples mortar and brick
0
0,0 0,5 1,0 1,5 2,0 2,5 3,0 properties but contributes for less than 1% to the global
elastic modulus. In this way eq. (1) turns out to be quite
250
insensitive to the values of the Poisson’s ratio.
e/h=0 Once the mechanical parameters for brick and Poisson’s
200
e/h=0.18 ratio of the mortar are given, the elastic modulus for mortar
e/h=0.27 has been assumed so as to reproduce the global modulus
150
e/h=0.36 for masonry deduced from the experimental tests. The
Load [kN]
b) mechanical parameters are given in table 1.
100
3. TEST RESULTS
50
Five different eccentricities have been tested: e/h = 0, 0.18,
Rotation [rad] 0.27, 0.36, 0.45. The latter one gave uncertain results since
the limit load was close to the load cell minimum allowable
0
0,0E+00 5,0E-03 1,0E-02 1,5E-02 2,0E-02 2,5E-02 measurement and the displacement was so small to be close
6
to the testing apparatus precision; in this case only the
ultimate load and displacement were recorded. For each of
5
the other eccentricities load-displacement, load-rotation and
3 [kN*m]
moment-rotation curves have been recorded, Figure 4. For
4
e/h=0.18 e/h=0 (concentric loading) no significant rotation was
Moment
c) e/h=0.27 found, as it should, up to the limit load point. The softening
e/h=0.36
phase is quite long; the last point simply marks the end of
2
the meaningful part of the test and does not stand for the
sudden collapse of the specimen. The circle marks the point
1
Rotation [rad] at which acoustic emission was detected, showing the
0
beginning of internal crack propagation. Both the tests with
0,0E+00 5,0E-03 1,0E-02 1,5E-02 2,0E-02 2,5E-02 the whole section compressed (e/h = 0 and e/h = 0.18) show
a significantly linear initial response; on the other hand,
Figure 4 – a) Load-Displacement, b) Load-Rotation and c) under highly eccentric loading conditions the non-linear
Moment-Rotation curves response is evident.
The relative displacements of the bases 4 to 9 have been
Mortar specimen are manufactured and cured in different recorded throughout the test and are represented in Figure 5
conditions from those affecting the mortar joints. Adequate for the eccentric loading. The 100% curves stand for the
vibration makes the mortar prisms to incorporate much less position of the central joint at the displacement cor-
air than the joints; besides, being manufactured in steel responding to the limit load; figures lower than 100%
boxes, they do not suffer from variations in water content indicate the position of the joint at that percentage of the
as, on the contrary, happens for the mortar at direct contact displacement at collapse, whilst over 100% indicate the joint
with the brick. position in the softening phase. It can be seen that there
The elastic modulus and the Poisson’s ratio are global are hints for corroborating the hypothesis that the cross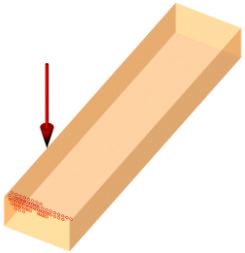
section remains plane up to the peak load. Once the limit side D m side
ason C
point is reached, the compressed part of the section ry p
rism
crashes, but the other part of the section remains plane, at
least on the average. side
A
side B
1,4
Relative displacement [mm]
1,0
0,6
side A side B
0,2 28
last
a) -0,2 last last
last
-0,6
last
last
-1,0
-1,4 28
Base distance from the central axis [cm] 22 last 18
-1,8
-24 -18 -12 -6 0 6 12 18 24
0,6 side C side D
0,4
Relative displacement [mm]
47 last
0,2
50
34 21 34 45
0,0
35
-0,2 34
last 32 last
-0,4 last 40
28
b) 28 35 45
-0,6
-0,8 Figure 6 – Crack pattern evolution for concentric loading – the
numbers indicate the load step at which the crack was detected
-1,0
Base distance from the central axis [cm]
-1,2
-24 -18 -12 -6 0 6 12 18 24
25% 50% 75%
100% 125% 150%
Figure 5 – Position of the central joint for a) e/h=0.18 and b)
e/h=0.36
Whilst in Figure 6 a typical crack pattern is shown
(numbers refer to the load step at which the crack appeared),
Figures 7 and 8 show photos of the specimen at the end of
the test before and after removal of the outside parts. The
H-shaped crack pattern of Figure 7 enlightens the lateral
instability of a thin sheet of brick; in Figure 8 this thin sheet
has been removed (right bottom hand side) showing that a Edge cracks
crack almost parallel to the surface had developed. Many and spalling
other cracks indicate that such a phenomenon takes place
also in the central bricks. The inner core seems to be less
damaged than the external parts of the brick. Cracks extend
to the mortar joint only when some parts of the brick tend to
detach.
Figure 7 – Concentric loading – side C bottom: spalling of
It has to be noted that the measuring devices and their
the outside part of the brick. White arrows indicate the
connections to the prisms were never found to activate
typical H-shape pattern
cracking. In fact, also till the final stage of collapse, neither a
screw bolt originated any crack.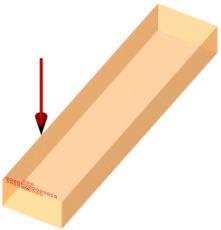
loading).
                                                                      In the following, a non linear analysis up to collapse is
                                                                   performed assuming for the materials the values of Table 1.
                                                                   It has to be said that this choice may introduce some source
                                                                   of approximation since the material model in the FEM model
                                                                   is an isotropic one, while the experimental values are
                                                                   obtained from small specimens that may be significantly
                                                                   altered by local inhomogeneities. Nevertheless, test data
                                                                   were quite homogeneous, showing that inhomogeneities
                                                                   had no significant effect on the average. This latter
                                                                   consideration gives grounds to the assumption of an
                                                                   homogeneous material for mortar and fired clay.
   Edge
                                                                     The failure rule for the material, both mortar and brick, is
   cracks
                                                                   the Willam-Warnke three-parameters model [17]. Figure 10
                                      Edge                         shows the failure surface in the deviatoric plane and on the
                                      cracks                       tensile and compressive meridians. In order to represent the
                                                                   strong stress gradients, the mesh is quite dense (approx.
                                                                   34.000 dof.s for 1/8th of the brick/mortar assemblage, average
                                                                   F.E. dimension equal to 3 mm). The procedure has been
                                                                   implemented in the ANSYS 5.7 code.

Figure 8 – Concentric loading – side D/C: internal cracking
after removal of the detached parts. The double arrows
                                                                                   a)         τm /f' c                              b)     -σ2/f' c
                                                                     ϕc
indicate an internal core less damaged than the external
                                                                                                                                                         f'c
part. Some evidences of external peeling                                                      f'c
                                                                                                                              σ 1/f' c
                                                                  σm =-0,5f' c                                                                  r
                                                                                                                                               ϑ
                                                                                                                   σm /f' c
                                                                                                     f' t                                      f' t
                                                                     ϕt                             ρ                                                 f'bc
                                                                              f'bc
                                                                                                                          -σ 3/f' c                            -σ 1/f' c

                                                                   Figure 10 – Failure surface for the three-parameter Willam-
                                                                   Warnke model [17] a) on the tensile and compressive
                                                                   octaedric plane and b) on the deviatoric one; f’t= f’c /10 and
                                                                   f’bc = 1.3*f’c (f’bc : biaxial compressive strength)

                                                                                                                  f t=3.4N/mm2
                                                                              Load [kN]

                                                                   200                              f t=2.3N/mm2
                                                                                               f t=1.9N/mm2
                                                                   150

                                                                                    First
                                                                   100            acoustic
                                                                                 emissions

                                                                     50
                                                                                               Displacement [cm]

                                                                      0
                                                                          0                0,05             0,1         0,15             0,2           0,25         0,3
Figure 9 – a) Symmetry conditions and b) reduced model with                               (1)ft=1.87 N/mm2                                     (2) ft=2.3 N/mm2
symmetry restraints of an infinite stack of mortar joints and
                                                                                          (3) ft=3.4 N/mm2                                     experimental
brick units
                                                                   Figure 11 – Load/displacement curves for the theoretical
                                                                   model with different eccentricities of the load (displacement
            4. FEM MODELLING OF MASONRY
                                                                   for a 270 mm long stack)
A FEM analysis of the mortar-brick stack should reproduce
the stress distribution inside the brick. The symmetry               Since there is experimental evidence that no sliding takes
conditions of an assemblage of mortar joints and bricks,           place at the mortar/brick interface, probably due to the high
Figure 9, allow to limit the analysis to be reduced to 1/4th of    compressive vertical stresses, the brick/mortar interface is
the joint/brick fundamental unit only (1/8th for concentric        allowed only to open when subjected to tensile stresses.
4.1 Concentric loading The perfect agreement in the elastic phase should not be
Figure 11 shows the load/displacement response of the considered of great significance because the mortar elastic
FEM model for an assemblage of mortar joints and bricks for moduli, deduced via equation (1), is exactly the value which
different values of the brick tensile strength, along with the fits the global average elastic moduli of the prism. Much
measured experimental data. The ratio between the more interesting is the fact that the agreement with the
tensile/compressive strength of the brick is rather high, elastic theory is still good up to more than 90% of the
1/5.5≅0.18, so that lower values of the brick tensile strength collapse load. The arrows indicate the point of the load
were used in order to verify the applicability of the TPB test- history of each model at which cracking was activated in the
deduced tensile strength to this kind of FEM models. FEM model. If we assume the acoustic emission as a proof
of the activation of cracking, a significant difference from
Resultant the experimental evidence has to be recognized. Since the
Load
acoustic emission is followed by a still linear response, it is
not clear whether the early cracking is due to some specific
experimental settlement or is a typical feature of masonry
Symmetry collapse.
planes cracks
Resultant
Load
Symmetry
planes
cracks
cracks
cracks
a)
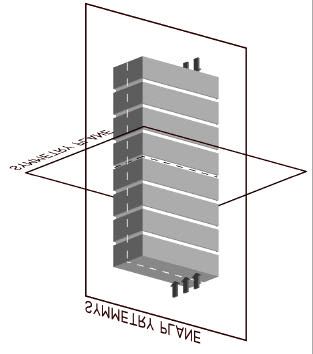
Figure 12 – Crack distribution in upper part of the brick in
the neighbourhoods of the free edges at the very beginning of
crack propagation
Resultant Resultant
Load Load
Symmetry Symmetry
planes planes
a)
b) cracks cracks
Resultant
Load
Symmetry Figure 14 – Evolution of cracking at the very last stage of the
planes loading process: a) 96%; b) 98% of the limit load. Upper part
of the brick
b) The limit load reached by the FEM model with a 3.4 N/mm2
tensile strength, the value measured in the TPB test, is very
close to experimental value. The major difference is in the
post-peak phase: FEM models foresee a catastrophic
collapse, while the experimental evidence shows a limited
but clear softening phase. As it has been observed,
cracking activates close to the external surfaces and
concentrates in a rather limited volume; in this way, the
Figure 13 –Distribution of the a) vertical and b) principal FEM models loose convergence as a consequence of locally
tensile stresses at the initiation of the first cracks [N/mm2 concentrated cracks and are not able of representing the
*10]. Upper part of the brick structural response when cracking spread throughout alarge part of the brick.
At the very beginning of crack propagation, the first crack
Resultant
appears at the brick/mortar interface, on the brick side only,
Load
in the neighbourhood (5-10mm) of the external free edges
and parallel to the brick sides starting from the interface and
directed towards the centre of the brick, Figure 12 - light
grey lines. In spite of a quite uniform distribution in the a)
brick of the vertical compressive stresses, Figure 13.a,
accounting for a 8-8.5 N/mm2 in the central area, in the area
where the cracks activate, i.e. close to the free edges, a high Symmetry
tensile stress in attained, Figure 13.b, and reduced plane
compressive stresses of 7-8 N/mm2 are found, Figure 13.a.
Such a limited crack damage is not enough to show a
macroscopic non linear behaviour.
Collapse is attained when cracking passes through the
brick thickness and spreads throughout the interface, with a
sudden drop in the load carrying capacity of the Resultant
brick/mortar assemblage. Substantially, collapse is a local Load
phenomenon close to the free surfaces, as already
conjectured by Rots [15].
Figure 14 shows the quick evolution of cracking in the b)
brick, the mortar joint remaining undamaged till the limit
point: cracks propagate both in length and in depth. The
coalescence of the cracks makes a continuum damaged path
Symmetry
to form on a surface approximately parallel to the free edge. plane
This prevision is rather similar to the experimental evidence,
Figures 7 and 8.
Worthwhile noting is the tensile stress distribution inside
the brick, that turns out to be uniform only in the internal
Figure 16 – a) Vertical and b) maximum tensile stress
core of the brick, with stress concentration localised close
distribution at 95% of the collapse load [N/mm2 *10]. Upper
to the free edges. If we assume the central part of the brick
part of the brick
(with uniform tensile stress distribution) as the load carrying
structure, we can reproduce the inner core of the prism,
Figure 8. But this fact rises some doubts concerning the Also in this case the mortar joint remained undamaged till
uniform tensile stress distribution in the brick assumed by the limit point. Figure 12 plots the vertical and maximum
many mechanical models, the limit-analysis based models [3- tensile stresses just before the opening of the first cracks.
7]. Two observations arise: 1) the lines with equal vertical
stress, Figure 12.a, are not straight with irregularity close to
4.2 Eccentric loading the free side, indicating that the neutral axis, straight on the
The eccentric loading has been modelled for an eccentricity average, suffers from local stress concentrations close to
of 6 cm only, e/h = 0.27, allowing the brick/mortar interface the edges; 2) close to the free side of the compressed part of
to open but not to slide. The macroscopic response of the the section high tensile stresses are developed. Exactly in
model is similar to that represented in Figure 11, with a long that part the first cracks are developed starting from the
linear response up to 95% of the limit load and a sudden symmetry axis, Figure 17.
collapse at a total load of 82.4 kN, very close to the On the brick/mortar interface the shear stresses that are
experimental value of 78.8 kN. The major difference arise in developed are quite low, never more than 0.4 N/mm2, Figure
the structural response: the real specimen showed a clear 18, with an average compressive stress of 6 N/mm2;
non linear response from the early stages of the loading Whatever the friction coefficient at the interface, such low
history, while the FEM model remains linear elastic till values of the tangential stresses justify the experimental
almost the limit load. evidence that no sliding occurs between the brick and the
Symmetry mortar joint.
plane These circumstances are only a first glance in the collapse
Resultant mechanism of masonry prisms under non-uniform compres-
Load sive stresses. More research is still needed, along with
other experimental results.
opening 5. COMPARISONS AND CONCLUSIONS
The experimental response of the specimen under uniform
compression revealed to be rather linear up to some 90% of
Figure 15 – Deformed shape of the masonry unit at 95% of the limit load. Non-uniform compressive stresses with brick
the collapse load for a 6 cm eccentric loading /mortar interface opening, instead, exhibit clear non linearresponse starting from the very beginning of the loading tensile strength seems to be attained closed to the free
process. Low load levels are needed to activate acoustic edges of the brick while the internal core exp eriences still
emission from the specimen; at the present stage of the low tensile stresses. This fact has been found on thin
research it is not clear whether this is due to bad specimen, so that this conclusion cannot be extended to
workmanship of the specimen or it is some intrinsic feature very thick eccentrically loaded masonry.
of the collapse mechanism.
FEM models give e deeper insight in the cracking
phenomenon. Cracks originate at the brick /mortar interface
as a consequence of the elastic mismatch between brick and Resultant
mortar, starting on the brick side of the interface and Load
propagating towards the brick centre. This evolution of the
crack pattern is in agreement with Rots [15] who conjectured
that the collapse mechanism is activated by some local edge a)
effect rather than a global failure condition in the brick core.
Symmetry Symmetry
plane plane
Resultant
Load
Resultant
Load
a)
cracks b)
Symmetry
plane
Symmetry
plane
Resultant
Load
Figure 18 – Shear a) xz and b) yz (x is the direction of the
longest side) at 98% of the collapse load [N/mm2 *10]. Upper
part of the brick
b)
1,0 Solid clay bricks
[9]
Solid concrete bricks
cracks [18]
0,8 Experimental data
Elastic - perfectly
Plastic
0,6 N/
N0
Compressed
section
Figure 17 – Crack distribution at a) 95%; b) 98% of the limit 0,4
load. Upper part of the brick
0,2
Besides, the crack pattern, the crack position and the e/h
corresponding load level reproduced by the FEM model 0,0
seem to be in reasonable agreement with experimental 0 0,1 0,2 0,3 0,4 0,5
evidence. If the mechanical properties of the materials are NTR with compressive limit
evaluated by means of standard testing procedures the limit Elasto-Plastic
load foreseen by the FEM model is reasonably good.
Nevertheless, the non linear response of the prisms has still Figure 19 – Limit domain for eccentric loading assuming an
to be investigated. NTR model with compressive stress limit and an Elasto-
The stress distribution, specifically the presence of some Plastic model with strain limit. Comparison with
areas where stress concentration is found, rises some experimental data
objection to the classical limit-analysis theory. The brick
Figure 19 plots the limit load measured in the tests againstthe eccentricity, along with other experimental data [9, 18]. probably due to the fact that the materials used for the
Three limit lines represent the limit load calculated according specimens were modern materials, the ones the empirical
to different mechanical models. From the uniform loading formulas had been developed for.
test the actual compressive strength of the brickwork can be More research needs to be carried out in order to widen the
deduced along with the ultimate strain, Figure 4. Three experimental data and to get deeper insight in the
different simple models lead to different failure loads: a) a mechanisms that activate after the maximum load is reached
pure No-Tensile-Resistant model in which a limit is set to and lead to a significant softening phase of the non
the compressive stresses –bold solid line; b) an elastic- uniformly compressed specimen. This phenomenon gets
perfectly plastic model [19] to which the failure condition is poor detailing at the present level of the research.
reached when the maximum compressive strain attains the
ultimate value measured in a concentric loading test – AKNOWLEDGEMENTS
dashed bold line; c) an elastic-perfectly plastic model with The authors acknowledge the contribution by Giancarlo
unlimited ductility –thin solid line. More sophisticated Sighieri to the experimental work, mainly in solving the
models can be formulated but they would not add any technical problems and in preparing the testing setup.
further information at the present stage of the research. This research was carried out with the financial support of
The experimental data, except those for solid concrete the (MURST) Department for University and Scientific and
brickwork, lie somewhere in-between the NTR and Elasto- Technological Research in the frame of the PRIN 2002/ 2003
Plastic with strain limit curves. This suggests that the Project “Safety and Control of Masonry Bridges”.
effective response of masonry is something more than No-
Tensile-Resistant. Even though the limited number of REFERENCES
specimen does not allow a general conclusion, the 1. HENDRY, A.W., Structural Brickwork , John Wiley,
experimental results showed that the assessment of an arch- New York, 1981
type structure relying on a purely NTR model turns out to 2. DRYSDALE, R.G., HAMID, A.A., BAKER, L.R.,
be significantly conservative. A more detailed approach Masonry Structures, Behavior and Design, Prentice Hall,
could consider the development of limited inelastic strains Englewood Cliffs, 1993.
inside masonry.
3. FRANCIS, A.J., HORMAN, C.B., JERREMS, L.E., The
Many failure theories were used to foresee the
effect of joint thickness and other factors on the
compressive strength of masonry. Table 2 summarizes the
compressive strength of brickwork, Proc. 2nd I. B. MA. C.,
estimates of the compressive strength according to some of
Stoke on Kent, 1971.
these theories and to some codes employing the mechanical
parameters of Table 1. For the code-type approach, it has to 4. ATKINSON, R.H., NOLAND, J.L., A proposed failure
be said that codes give characteristic values of the strength, theory for brick masonry in compression, Proc. of the 3rd
while the comparison should here be drawn relying on the Can. Mas. Symp., Edmonton, 1983.
average values, which are usually 20-30% higher. If the code 5. SHRIVE, N.G., A fundamental approach to the fracture of
values are multiplied by a factor 1.2-1.3, the experimental masonry”, Proc. 3 rd Can. Mas. Symp., Edmonton, 1983.
value is obtained. 6. HILSDORF, H.K., Investigation into the failure
mechanism of brick masonry under axial compression, in
Table 2 Designing, Eng.ng & Construction with Masonry
Estimated concentric compressive strength of masonry Products, F.B. Johnson ed., Gulf Publishing, Houston,
Texas, 1969.
Estimated compressive 7. KHOO, C.L., HENDRY, A.W., A failure criteria for
Reference Notes
strength [N/mm2] brickwork in axial compression, Proc. 3 rd I. B. MA. C., Essen,
1973.
Francis [3] elastic theory 15.0
8. PAGE, A., BROOKS, D., Load bearing masonry – A
Hilsdorf [6] limit analysis 13.7 review, in Proc. of the 7 th I. B. M. C., Melbourne, 1985.
limit analysis + 9. DRYSDALE, R.G., HAMID, A.A., Effect of ec-centricity
Khoo & Hendry [7] 17.8
experimental on the compressive strength of brickwork, J.nl Brit. Cer.
Soc., 30, 1982.
EC 6 [20] - 7.4
10. MAURENBRECHER, A.H.P. Compressive strength of
Fiche-UIC [21] - 7.8 eccentrically loaded masonry prisms, Proc. III Can. Mas.
Italian Code [22] for M2 mortar 7.4 Symp., Edmonton, Canada, June 1983.
Italian Code [22] for M3 mortar 6.8 11. TAYLOR, N., MALLINDER, P. The brittle hinge in
masonry arch mechanism, Str. Eng., 71, 1993.
Present work experimental 9.9 12. BINDA, L., MIRABELLA ROBERTI, G., TIRA-BOSCHI,
C., ABBANEO, S., Measuring masonry material properties,
The results of table 2 underline that the limit-analysis Proc. U.S.-Italy Workshop on guidelines for seismic
approach somehow overestimates the actual compressive evaluation and rehabilitation of unreinforced masonry
strength of masonry, while modern codes, probably relying buildings, section VI, 1994.
on a large base of experimental data, give empirical formulas 13. ATKINSON, R.H, NOLAND, J.L, ABRAMS, D.P. A
which may fit quite well the experimental data. This is deformation failure theory for stack bond prisms incompression, Proc. VII I.B.Ma.C., Melbourne, Aus., 1985.
14. RABIAIOLI R., Control methods for masonry arch
bridges: an example (in italian), Ing. Ferr., August 1993.
15. ROTS, J.G. Numerical simulation of cracking in structural
masonry, Heron, 36, 1991.
16. BRENCICH, A., GAMBAROTTA, L. Isotropic damage
model with different tensile-compressive response for brittle
materials, Int. J.nl Sol. Str., 38, 2001.
17. WILLAM, K., WARNKE, E. D., Constitutive model for
the triaxial behaviour of concrete, Proc. IASBE, vol. 19,
ISMES, Bergamo, 1975.
18. DRYSDALE, R.G., HAMID, A.A. Capacity of concrete
block masonry prisms under eccentric compressive loading,
ACI J.nl, 80, June 1979.
19. BRENCICH, A., DE FRANCESCO, U., GAMBAROTTA,
L. Elastic no tensile resistant – plastic analysis of masonry
arch bridges as an extension of Castigliano’s method, Proc.
9th Can. Mas. Symp., Fredericton, 2001.
20. ENV 1996-1-1 march 1998 - EURO CODE 6. Design of
masonry structures, Part 1-1: General rules for buildings –
Rules for reinforced and un-reinforced masonry, 1998.
21. FICHE-UIC 778-3E. Recommandations pour l’evaluation
de la capacite portante des ponts-voutes existants en
maçonnerie et beton, 1994.
22. DEPARTMENT OF PUBLIC WORKS. Technical code
for design, building and assessment of masonry buildings
and their strengthening – 20th November 1987 (in Italian).
APPENDIX
Notation
σx, σy , σz, τxy , τxz, τy z, components of the stress tensor
Eb, νb Elastic modulus and Posson’s ratio for brick
Em , ν m Elastic modulus and Posson’s ratio for mortar
EM Elastic modulus for masonry
fc uniaxial compressive strength
fbc biaxial compressive strength
ft uniaxial tensile strength
tb brick thickness
tm mortar joint thickness
h brick length (maximum dimension)
e load eccentricity
ηb = tb/(tm+ t b) brick volume ratio
ηm = tm/(tm+ t b) mortar volume ratioYou can also read