Assessment of Asphalt Cracking using High-Speed Photography
←
→
Page content transcription
If your browser does not render page correctly, please read the page content below
Assessment of Asphalt Cracking using High-Speed
                       Photography
Ian van Wijk1, Thejaswee Valluru2, Mehdi Serati3
   1. Adjunct Professor, University of Queensland, School of Civil Engineering, Brisbane,
      Queensland, Australia
   2. Student, University of Queensland, School of Civil Engineering, Brisbane, Queensland,
      Australia
   3. Assistant Professor (lecturer), University of Queensland, School of Civil Engineering,
      Brisbane, Queensland, Australia

ABSTRACT

Cracking is one of the dominant failure modes in asphalt pavements. These cracks can
broadly be classified as structural (bottom-up), environmental (bottom-down), reflective, or
due to excessive deformation (parabolic, shoving). Fatigue crack resistance of asphalt mixes
is commonly determined, but the failure is defined as a reduction of stiffness and the actual
cracking is not assessed. A number of tests have been developed to measure cracking in
asphalt samples, but not widely used as standard tests. An improved understanding of the
crack characteristics and quantification would be beneficial in assessing asphalt mixes with
recycled materials, glass and modifiers, and in providing optimised pavement thickness
solutions, particularly in pavements with lean mix concrete or cemented layers and asphalt
overlays on concrete pavements.
In order to further the understanding of asphalt crack development and characteristics, a
study was initiated to use ultra-high-speed photography techniques to evaluate the crack
propagation in a range of asphalt mixes and to consider crack assessment principles used in
rock testing. The measurements and observations include crack initiation, crack pattern (i.e.
development of tensile and/or shear cracks), and stress level. Several types of asphalt mixes
were tested, as well as a specific mix at different temperatures. Results indicate that macro
(visible) tensile cracks could appear at load levels below the maximum peak load in the
stress-strain domain and that cracks could be shear rather than tensile cracks at low
temperatures.
This paper provides a brief overview of the most commonly used tests to measure asphalt
fracture testing, presents some relevant findings from these tests and research utilising high-
speed photography techniques and comments on the potential consequences of some of the
test results.
Keywords: Asphalt fracture crack testing and characteristics, indirect tensile splitting test,
ultra-high-speed photography.

1. INTRODUCTION

Deformation (mainly observed as rutting or shoving due to combination of insufficient
pavement thickness, moisture intrusion, weak asphalt mixes, and lack of compaction) and
cracking are the predominant modes of failure in pavements with asphalt base and surface
courses. Cracking can broadly be classified as fatigue or structural (eventually manifested as
crocodile cracking), environmental (observed as block cracking) and reflection cracking
(often seen as transverse cracking) [1-5]. Fatigue or structural cracking is initiated by load-
induced tensile strains exceeding the tensile strength (or related parameter such as
cumulative strain) at the bottom of the asphalt layer. These cracks then migrate (bottom-up)
with time and load repetitions to the surface of the asphalt. Environmental cracking generally
develops at the surface of the asphalt layer due to aging and drying of the binder at the
surface through bending-induced surface tension and bending-induced near surface tension.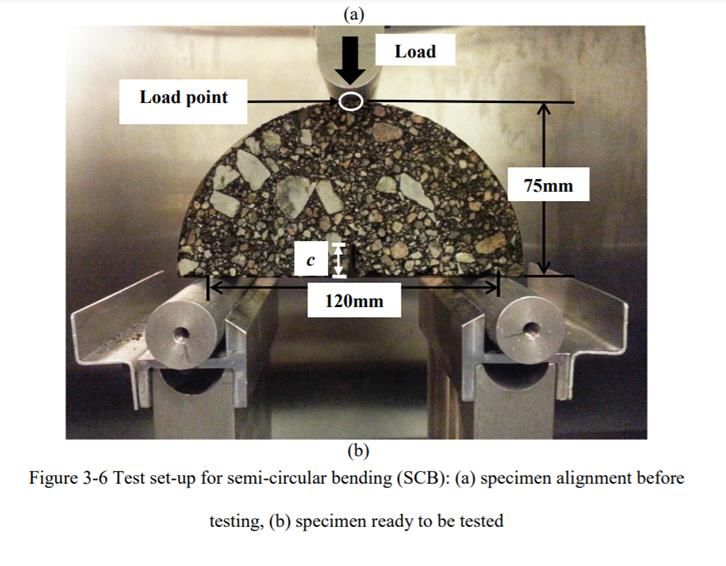
Assessment of Asphalt Cracking using High-Speed Photography
With further aging and drying, as well as loading, the cracks progress deeper into the asphalt
layer (top-down).
A broad distinction can be made between fatigue and fracture cracking. Fatigue cracking
properties are commonly used to predict the structural behaviour of the asphalt (which is
manifested as bottom-up cracking) and are most often measured by a reduction in elastic
modulus of 50% under load-induced constant stress or strain of a laboratory specimen
(rectangular or trapezoidal beam or circular sample) [6-9]. Fracture cracking, on the other
hand, induces and measures the actual cracking, and is used to predict the development of
reflection and aging (top-down) cracking. From a modelling perspective, fracture mechanics
is a useful tool to characterise crack initiation and propagation [10-12]. Fracture energy (Gf)
has been used as a simple parameter representing fracture for asphalt (AC) mixtures [13].
The cracking response is strain-rate and temperature dependent. The fatigue cracking
characteristics of asphalt are not necessarily the same as the fracture cracking
characteristics.
As indicated earlier cracking is one of the predominant distresses occurring in pavements
and has significant design, rehabilitation and maintenance cost implications for road
agencies and councils. Whereas fatigue crack resistance of asphalt mixes is commonly
determined, actual cracking is not widely assessed, nor are there universally adapted
standardized laboratory cracking test methods for routine mix design and screening
purposes for asphalt mix crack resistance. This has resulted in conservative design
guidelines, e.g., the requirement of a minimum asphalt thickness of 175 mm on a cemented
and lean mix concrete layers.
The benefits have been recognised in the USA where there has been increased attention to
fracture performance testing and cracking related index parameters to evaluate low and
intermediate temperature cracking resistance of asphalt mixtures [14].
A better understanding and characterisation of actual asphalt fracture cracking would lead to
savings in pavement construction and maintenance, and an increase in the life of a
pavement. Both contributing to the reduction in carbon footprint and a more circular economy.
As an example, an increase in recycled asphalt pavement (RAP) content to 20% would result
in the reduction of CO2 equivalent emissions of 5% which is like the reduction in the
thickness of an asphalt layer of 175 mm to 165 mm, and an increase in RAP to 40% in a
reduction of 16%, which is equivalent to a reduction of the 175 mm layer to 150 mm [15]. The
effect of optimisation of the pavement design can be significant in terms of energy savings
and cost reduction.
This paper provides a brief overview of the most used tests to measure asphalt fracture
testing, presents some relevant findings from these tests, discusses research conducted at
the University of Queensland (UQ) utilising ultra-high-speed photography techniques to
evaluate the crack propagation and concludes with observations about the consequences of
some of the results.

2. ASPHALT FRACTURE TESTS

Test procedures developed to assess asphalt fracture cracking include the single-edge
notched beam, the disk-shaped compact tension (DCT), and the Semi-circular Bend (SCB)
tests, the Texas overlay test, the indirect tensile creep and strength test (IDTCST), the
IDEAL-CT test, SCB-AASHTO TP85, the SCB-Louisiana Transportation Research Center
test, and the SCB-Illinois Flexibility Index test [5, 13, 17-18]. All except the IDEAL-CT test
entail the cutting of notches or slots into the samples. A number of cracking indexes have
also been defined to quantify the Semi-Circular Bend (SCB) test results, i.e., Fracture Energy
(Gf), Illinois Flexibility Index (FI), Toughness Index (TI), and Fracture Strain Tolerance (FST).
Several studies have been undertaken to validate and compare the above laboratory tests
results with field performance [19-24]. Some of the findings include:
                 AfPA 2021 International Flexible Pavements Symposium | Roads going full circle
                                                       2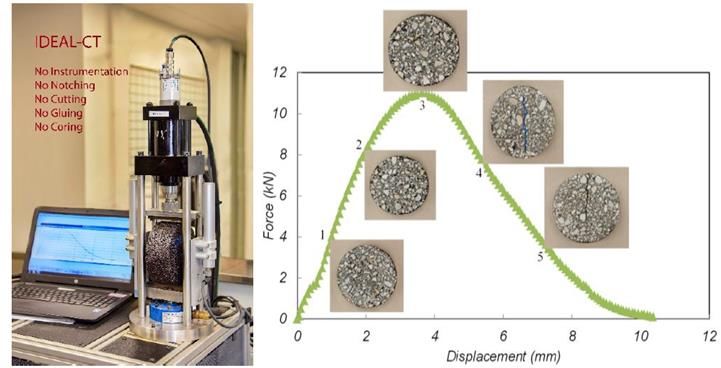
Assessment of Asphalt Cracking using High-Speed Photography
   •   The Illinois I-FIT flexibility index (FI) was found to be responsive to mix design
       adjustments (viz., binder content and RAP percentage) and correlated with the rate of
       transverse cracking. The Texas overlay test did not correlate to transverse cracking
       [22].
   •   A FI value of more than 8 indicated a low propensity for cracking [22].
   •   The FI was found to better distinguish between mixes with high asphalt binder
       replacements than the fracture energy [22].
   •   The IDEAL-CT compared well with the Texas Overlay test (OT) and Illinois Flexibility
       Index test (I-FIT) and showed a very good correlation with field cracking performance
       data [23].
   •   A very good correlation was found between fatigue cracking at a full-scale ALF and FI
       values obtained by testing the plant-produced AC mixes collected during the
       production [24].
Three of the most widely used asphalt fracture tests are described in more detail below.

2.1 Texas overlay [5,23]
The Texas overlay test was originally developed to assess the susceptibility of mixtures to
reflective cracking. The test entails the measurement of the number of cycles to failure
(defined as the number of cycles to reach a 93% drop in initial load) of an asphalt specimen
bonded between a fixed plate and moveable plate with a 2 mm gap that opens and closes to
simulate the movements of underlying joints or cracks (see Figure 1). The magnitude of the
opening displacement is 0.63 mm in a triangular waveform lasting 10 seconds and then
repeated. The test is normally performed at 25 ± 0.5°C on samples with air void contents of
7.0 ± 1.0%. Typical acceptance criterion ranges from 150 (New Jersey DOT for high-RAP
mixtures) to 300 (Texas for thin asphalt overlays) [5].

                                 FIGURE 1 Texas overlay test [5]

2.2 Ideal Cracking Test (IDEAL-CT) [17,25]
The IDEAL-CT was developed as a simple and inexpensive test using the standard circular
asphalt samples or cores. The test is typically run at 25ºC with 150-mm-diameter, 62-mm-
high cylindrical specimens gyratory compacted specimens compacted to 7% air voids and a
loading rate of 50 mm/min. However, any size of cylindrical specimens with various
diameters (100 or 150 mm) and thicknesses (38, 50, 62, 75 mm, etc.) can be tested. This
test is conducted in a Marshall load frame (or similar load frame) and loaded to failure in the
indirect tensile mode. The cracking tolerance Index (CT-index) is calculated from the load-
displacement curve (as a function of the fracture energy, displacement and specimen
diameter). The test set-up and typical load-displacement curve are shown in Figure 2.

                 AfPA 2021 International Flexible Pavements Symposium | Roads going full circle
                                                       3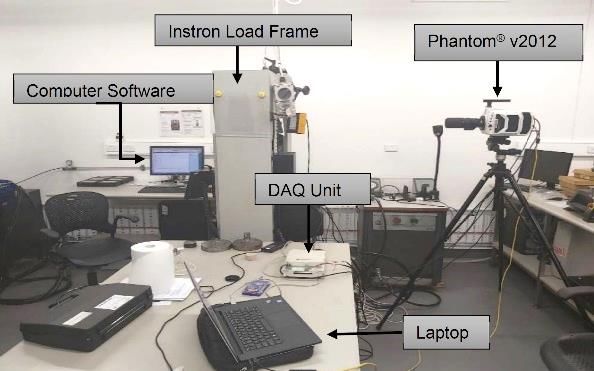
Assessment of Asphalt Cracking using High-Speed Photography
FIGURE 2 IDEAL-CT test set-up and typical load-displacement curve [17]
In the definition of the CT-index Zhou [25] postulated that there are 5 different stages in the
development of cracking on the load-displacement curve. The first 2 are present during the
pre-peak load segment (represented by points 1 and 2 on the curve in Figure 2) where no
macro cracks are visible. Cracks start appearing at post-peak loading, typically at a load
between the peak load and a value 33% less than the peak load (point 4 in Figure 2). At
higher deformations, the load decreases further, and crack development progresses quickly
(at a load of 33% to 67% of the peak load, between points 4 and 5 in Figure 2) until the
specimen separates into 2 pieces (from point 5 on Figure 2 onwards) at loads of less than
33% of the peak load. A CT-index criterion of greater than 70 is used by the Virginia
Department of Transport as an indication of adequate crack fracture properties [5]. It is worth
also mentioning that the IDEAL-CT test is very similar (in terms of boundary conditions and
sample geometry) to the so-called Brazilian test in rock mechanics were a disc shaped
sample of rock is loaded across it thickness at the two-end of its diameter until failure [26,27].
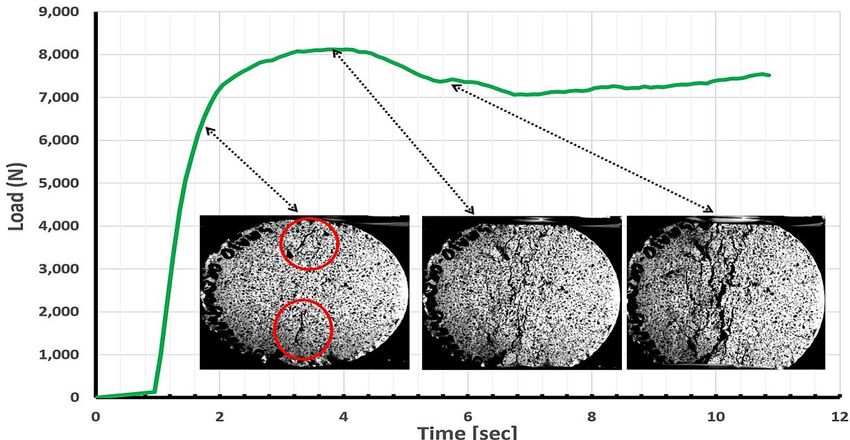
2.3 Illinois Flexibility Index Test [13,28]
Illinois Flexibility Index test (I-FIT also known as IL-SCB) was developed to rank asphalt
mixtures based on their cracking resistance. The development of the test was initiated (in
2012) by an increase in cracking in Illinois after the introduction of rutting performance tests,
which was compounded by the introduction of RAP. The test comprises the displacement of
a notched semi-circular 150 mm diameter sample under a vertical load at the displacement
rate of 50 min/mm at 25°C (see Figure 3). The recommended test parameters include
sample thicknesses 40 to 50 mm, notch lengths 5 to 15 mm, and test temperatures 15 to
40°C.
From the recorded load-displacement curve, the fracture energy (Jc in J/m2) and flexibility
index, FI (a function of the fracture energy and post-peak slope on the load-displacement
curve) are calculated [24, 28]. The coefficient of variation of the FI values typically ranged
between 10% and 20%.
AfPA 2021 International Flexible Pavements Symposium | Roads going full circle
4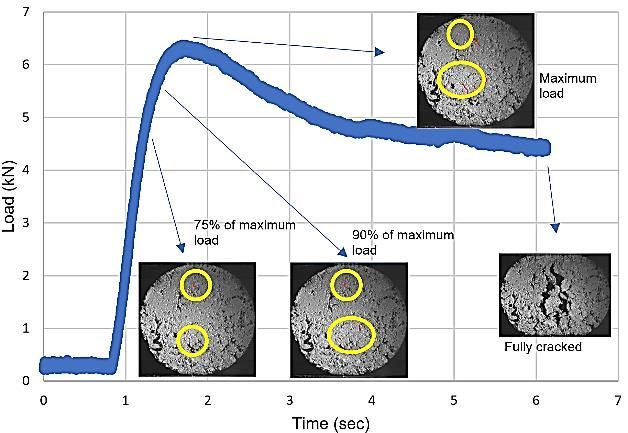
Assessment of Asphalt Cracking using High-Speed Photography

                             FIGURE 3 The IL-SCB test set-up [13]

Asphalt mixes with fracture energy values of more than 800 J/m2 performed well [28].
Similarly, FI values of more than 8 indicate acceptable crack fracturing performance [21].

2.4 Selective findings
Some relevant results from the studies referred to earlier are graphically displayed in
Figures 4 and 5 [17, 24-26].
Figure 4 demonstrates the effect of binder content and binder type (represented by the
binder temperature rating (the higher the value, in °C, is the softer the binder). As expected,
the crack resistance is enhanced by an increase in binder content and a reduction in
viscosity. The information also shows the quantum of the changes and the variations in the
crack potential prediction of the different tests.
Also, as expected aging reduces the crack - from a CT-index value of 375 after 4 hours, to
288 after 12 hours and 69 after 24 hours of aging (curing at 135°C) [24].
Figure 5 displays the effect of the percentage of RAP on the predicted crack resistance.
Although the magnitude varies among the different tests, the effect of the increase in the
percentage of RAP is significant.

                 AfPA 2021 International Flexible Pavements Symposium | Roads going full circle
                                                       5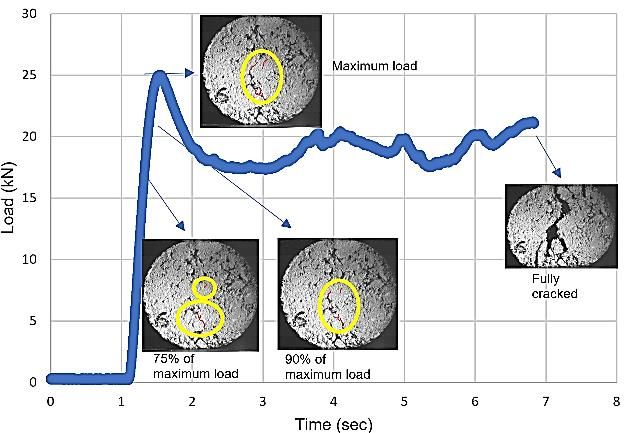
Assessment of Asphalt Cracking using High-Speed Photography

  FIGURE 4 Results demonstrating the effect of binder content, binder type and test
                                   procedure

   FIGURE 5 Results demonstrating the effect of RAP percentage on fracture crack
                                    potential

One study [17] investigated the different fracture indices, their variations with changes in test
temperature (1, 13 and 25°C), loading rates (2, 10 and 50 mm/min), and reclaimed asphalt
pavement, RAP (0, 10 and 40%) and found that the results varied among the different
cracking indices.

                 AfPA 2021 International Flexible Pavements Symposium | Roads going full circle
                                                       6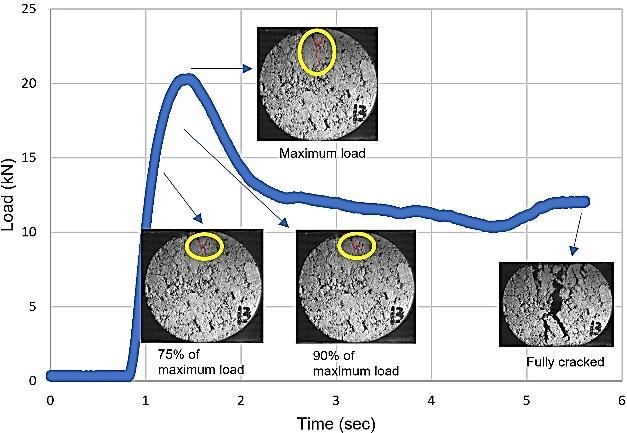
Assessment of Asphalt Cracking using High-Speed Photography
In summary, as expected, binder content, binder type, temperature, and aging affect the
fracture cracking characteristics of asphalt, but the extent of the effect of the percentage of
RAP is surprising. The testing is useful in quantifying these effects, but the variances among
the different tests should be recognised.

3. TESTS UTILISING ULTRA-HIGH-SPEED CAMERA PHOTOGRAPHY
   TECHNIQUES

3.1 Initial reported observations
More recently, research was initiated at the University of Queensland (UQ) to explore the use
of ultra-high-speed photography techniques to observe crack development in asphalt mixes.
The main aim was to get a further understanding of asphalt crack development and
characteristics and to consider crack assessment principles used in rock testing. The indirect
tensile splitting test (ITS), widely used in the testing of asphalt properties and in the IDEAL-
CT cracking test, was preferred for the evaluation of asphalt cracking for its ease of sample
preparation and testing. The investigation started with the configuration of the ultra-high-
speed camera and other measuring equipment to obtain appropriate and simultaneous
readings. A Phantom v2012 camera was used, which is capable of recording at up to 22,000
frames per second (fps) at 1-megapixel resolution and 1,000,000 fps at reduced resolution.
During the initial series of testing, 4 different types of asphalt mixes (dense graded asphalt
with 10 mm, 14 mm and 20 mm aggregate and a stone mastic asphalt with 10 mm
aggregate) were tested at room temperature. The second series of tests involved testing of
the same asphalt mix (dense graded asphalt with 14 mm and modified binder, AC14H) at
three different temperatures including 5°C, 24°C and 35°C. Samples produced by the
standard voids and Marshall property testing were used in the tests, i.e., 100 mm diameter
specimens compacted to a thickness of 60 mm with 50 blows. The load application speed
was varied from the standard 50 mm/minute to produce cracking patterns which could be
analysed. The equipment used and results obtained were presented in detail in a number of
publications [27,28]. The main initial findings reported in these publications were:
•   The ultra-high-speed camera could effectively be used to monitor the cracking pattern in
    asphalt samples and linked to load and displacement measurements. The configuration
    and details of the equipment are given in Figure 6.

                 AfPA 2021 International Flexible Pavements Symposium | Roads going full circle
                                                       7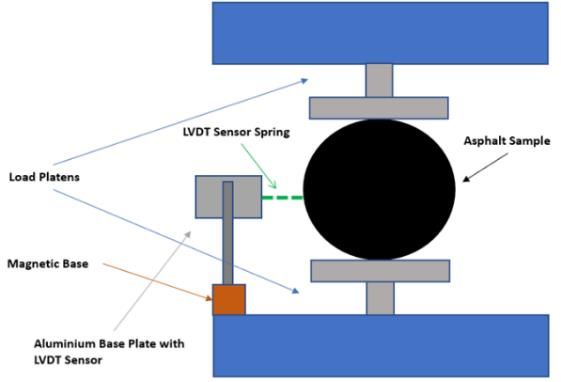
Assessment of Asphalt Cracking using High-Speed Photography

Equipment
•   A Phantom v2012 ultra-high-speed camera to monitor the cracking pattern in tested samples.
•   The camera is capable of capturing images at up to 1,000,000 frames per second at reduced
    resolution, and up to 22 kHz at a full resolution of 1280 x 800 pixels.
•   Two sets of displacement sensors to capture horizontal and vertical deformations during loading.
•   The vertical displacement was measured using the load frame signal (after being calibrated to
    account for the machine deformation)
•   A Linear Variable Differential Transformer (LVDT) sensor (Burster 8712-50 Linear Transducer
    LVDT, measurement range of 50 mm, and linearity of ±0.1%) was used and connected directly to
    the samples to record the horizontal expansion.
•   A high-resolution National Instruments Data Acquisition (NI USB-6221 DAQ) unit was utilized to
    synchronize the load and displacement signals with the high-speed camera.

                      FIGURE 6 Equipment description and set-up [29]

Fracture cracking in the asphalt samples was observed to start from stress levels as low as
65% of the peak load in the pre-peak load phase as shown in Figure 7. This is contrary to the
hypothesis used by Zhou [25] in the development of the CT-index, which is also generally the
case for rock-like geomaterials where large cracks only become visible on the face of a failed
sample until after the peak load point on the stress-strain curve is reached. For these
materials, crack initiation (microcracks) typically occurs at around 40% – 50% of the rock
peak strength. These microcracks then combine to form larger macroscopically visible cracks,
the material fails and consequently leads to a sudden drop of peak strength in the material’s
stress-strain curve [29].

                  AfPA 2021 International Flexible Pavements Symposium | Roads going full circle
                                                        8
Assessment of Asphalt Cracking using High-Speed Photography
FIGURE 7 Typical load-time curve [29]
• Temperature variation not only influences the fractural strength of asphalt samples but
also the shape of the stress-strain curve and cracking/fracturing mode as shown in
Figure 8. The most prominent difference in the shape of the stress-strain curve is the
shape after the peak load had been reached. The other observed difference is that
cracking on 3 out of the 5 samples tested at 5°C showed shear failure patterns compared
to tensile on all other samples. It is important to note that these observations are based
on a limited amount of testing and will be explored in more depth in future research.
(a) Sample AC14H-03 load curve at 35oC (b) Sample AC14H-06 load curve at 5oC
(c) Sample AC14H-13 load curve 24°C (d) Temperature vs average peak strength
FIGURE 8 Summary of the test results conducted at varying temperatures [30]
AfPA 2021 International Flexible Pavements Symposium | Roads going full circle
9Assessment of Asphalt Cracking using High-Speed Photography
3.2 Further analysis of test results
Further analysis of the UQ research is presented in this section and covers comments on the
load at which the first crack was observed versus the peak (maximum) load, the effect of
asphalt mix type and test temperature, and the relationship with indirect tensile strength
(ITS).
One of the major outcomes of the UQ research was the observation that the cracks
developed at loads below the peak load. That is, if it happens, the IDEAL-CT test
overestimates the asphalt fracturing strength. This is demonstrated by the results in Figure 9.
The average value of the load at which the first crack developed compared to the peak load
varies from 80% to 95% and appears to be strongly related to the asphalt mix aggregate size
and binder content. However, as shown in Figure 10, the variability of the test results should
also be considered in the assessment of the results.
The difference between load at the first crack to the peak load (i.e. larger ratio) increases
with an increase in nominal aggregate size (from 10 to 20 mm) and reduction in binder
content (from around 5.3% to 4.7%) bitumen. This is not the case for the load at first crack.
The behaviour of the 10 mm SMA is very different from that of the 10 mm dense-graded
asphalt.
FIGURE 9 Peak load, load at first crack and load ratio results for different asphalt
mixes
AfPA 2021 International Flexible Pavements Symposium | Roads going full circle
10Assessment of Asphalt Cracking using High-Speed Photography
FIGURE 10 Load at first crack vs peak load ratio results for different asphalt mixes
Figures 11 and 12 display the results of the testing of asphalt samples (the same mix, viz.
14 mm aggregate with a modified binder). As expected, the peak load and load at first crack
reduce with an increase in temperature (Figure 11), but the ratio of the two appears to be the
same at an average of around 90% (Figure 12). This ratio is similar to the value for the
14 mm mix obtained during the testing of different asphalt mixes (Figure 10).
FIGURE 11 Load at first crack and peak load at different temperatures (AC14H mix)
AfPA 2021 International Flexible Pavements Symposium | Roads going full circle
11Assessment of Asphalt Cracking using High-Speed Photography
FIGURE 12 Load at first crack vs peak load ratio results at different test temperatures
(AC14H mix)
Figure 11 shows the strong relationship between both the peak load and the load at which
the first crack was observed and the ITS (which is not unexpected), but a poor relationship
between the ratio and the ITS. This could indicate that the ITS can be used to predict the
load at which cracking would occur, but not the ratio between this load and the peak load.
FIGURE 13 Relationship between tensile strength and crack appearance loading
AfPA 2021 International Flexible Pavements Symposium | Roads going full circle
12Assessment of Asphalt Cracking using High-Speed Photography
The preliminary results indicate that:
• Cracks develop before the peak load.
• The ratio of load at first crack and peak load varies for different asphalt mixes but not
for different testing temperatures.
• The effect of temperature on crack potential is significant.
• The load at first crack can be predicted by the ITS, but not the ratio of load at first
crack to peak load.
These are preliminary findings which will be verified and expanded upon further during the
ongoing research.
4. CONCLUSIONS
Although procedures exist to measure asphalt fracture cracking and that these are (to
varying degrees) related to in-service asphalt pavement cracking, their use to characterise
and select appropriate asphalt mixes have been limited.
A better understanding of asphalt fracture cracking and the subsequent selection of asphalt
mixes can lead to longer lasting pavements fatigued by environmental factors, the reduction
of the thickness of asphalt layers on cemented and lean mix concrete layers, and wider
ranging assessment of the effect of an increased use of RAP and glass in asphalt mixes.
Some of the international results show the pronounced negative effect of the percentage of
RAP on the fracture characteristics of the asphalt mix, which may be different to the effect on
the modulus or failure behaviour.
The practical implementation of the results could be a reduction in the requirement of bound
cover on cemented layers (i.e. the current requirement of 175 mm asphalt in Australia) based
on climatic region (temperature) and asphalt binder type, the limitation of the use of RAP in
layers to be fatigued by the environment, and the reduction of reflection cracking in asphalt
overlays on concrete pavements.
The research conducted at the University of Queensland using high-speed photography
demonstrated that this technology can not only effectively be used to detect cracking, but
also provides valuable additional information to the assessment of asphalt fracture cracking.
It identified the occurrence of macro-cracking prior to the peak load and shear failure instead
of purely tensile failure in the circular samples tested in the standard indirect tensile loading
situation.
The findings from the QU research are based on limited tests and further research is
underway to assess the importance of these observations on the fracture crack
characterisation of asphalts. In addition, consideration will be given to the development of a
crack index (which could be a combination of a number of parameters) and correlation with
other cracking test results and in-service performance. But these observations need to be
further verified, the consequences of the crack appearance at loads below the peak load,
and the possible shear instead of tensile failure on the testing and fracture crack properties
of asphalts better understood.
5. ACKNOWLEDGEMENTS
The authors would like to thank Mr Chris Lange from Fulton Hogan for providing the samples
used in the tests.
AfPA 2021 International Flexible Pavements Symposium | Roads going full circle
13Assessment of Asphalt Cracking using High-Speed Photography
6. REFERENCES
[1] Rolt, J. Top-Down Cracking: Myth or Reality? TRL PA3738/1, 2001.
[2] Baladi, G.Y., Schorsh, M., and Svasdisant, T. Determining the Causes of Top-down
Cracks in Bituminous Pavements. Michigan State University, East Lansing, 2003.
[3] Report 2019-03, Investigation of Cracking Resistance of Asphalt Mixtures and Binders,
MnDOT’s Office of Research & Innovation, January 2019.
[4] Alae, M., Zhao, Y., Zarei, S., et al. Effects of layer interface conditions on top-down
fatigue cracking of asphalt pavements. International Journal of Pavement Engineering,
2020.
[5] Nair, H., and Habbouche, J. Installation and Initial Evaluation of Paving Fabric Interlayers
for Mitigating Reflective Cracking in Pavements, FHWA/VTRC 20-R33, Virginia
Transportation Research Council, Charlottesville, 2020.
[6] Austroads Test Method AGPT/T274. Characterisation of Flexural Stiffness and Fatigue
Performance of Bituminous Mixes, 2016.
[7] European Standards EN 12697-24:2012, Bituminous mixtures – Test methods for hot mix
asphalt – Part 24: resistance to fatigue European Committee for Standardization, 2012.
[8] FHWA-HIF-16-027. Testing for Fatigue Cracking in the Asphalt Mixture Performance
Tester, 2016.
[9] American Association of State Highway and Transportation Officials, Determining the
Damage Characteristic Curve of Asphalt Concrete from Direct Tension Cyclic Fatigue
Tests, AASHTO TP 107, Washington, D.C., 2014.
[10] Buttlar W, Rath P, and Majidifard H. Relating DC(T) Fracture Energy to Field
Cracking Observations and Recommended Specification Thresholds for Performance-
Engineered Mix Design. Transportation Research Circular Number E-C251. Relationship
Between Laboratory Cracking Tests and Field Performance of Asphalt Mixtures,
Transportation Research Board 500 Fifth Street, NW Washington, D.C. 2019.
[11] Lytton R.L. et al. NCHRP Report 669: Models for Predicting Reflection Cracking of
Hot-Mix Asphalt Overlays, Washington DC, 2010
[12] Lytton R.L. et al. NCHRP Document 257: A Mechanistic–Empirical Model for Top–
Down Cracking of Asphalt Pavements Layers, Washington DC, 2018.
[13] Nsengiyumva, G. Development of Semi-Circular Bending (SCB) Fracture Test for
Bituminous Mixtures, Thesis Degree of Master of Science, University of Nebraska-
Lincoln, 2015.
[14] Haslett, K.E. Evaluation of Cracking Indices for Asphalt Mixtures Using SCB Tests at
Different Temperatures and Loading Rates, University of New Hampshire, Durham, 2018.
[15] Infrastructure Sustainability Council of Australia (ISCA). IS Material calculator
Version-1-2-2020-09-18, 2020.
[16] Lubinda F. Walubita, Abu Faruk, Allex E Alvarez, Richard Izzo, Brett Haggerty, Tom
Scullion Laboratory Hot-Mix Asphalt Cracking Testing, Evaluation of Three Repeated
Loading Crack Tests December 2013. Transportation Research Record Journal of the
Transportation Research Board
[17] Zhou F, Im S., and Hu S. Development and validation of the IDEAL Cracking test.
Transportation Research Circular Number E-C251. Relationship Between Laboratory
Cracking Tests and Field Performance of Asphalt Mixtures, Transportation Research
Board 500 Fifth Street, NW Washington, D.C. 2019.
AfPA 2021 International Flexible Pavements Symposium | Roads going full circle
14Assessment of Asphalt Cracking using High-Speed Photography
[18] Kim, M., Mohammad L.M., and Elseifi, M.A. Characterization of Fracture Properties of
Asphalt Mixtures as Measured by Semicircular Bend Test and Indirect Tension Test.
Transportation Research Record: Journal of the Transportation Research Board, No.
2296, 2012, pp. 115–124.
[19] Zhou, F., and D. Newcomb et al. Experimental Design for Field Validation of
Laboratory Tests to Assess Cracking Resistance of Asphalt Mixtures. Draft final report of
NCHRP 9-57. Texas A&M Transportation Institute, College Station, 2016.
[20] Ma, W., Tran N. H., Taylor A., Willis J.R., and Robbins M. Comparison of Laboratory
Cracking Test Results and Field Performance. Journal of Association of Asphalt Paving
Technologists, Portland, Oregon, 2015.
[21] Walubita, L. F., Faruk A.N., Koohi Y., Luo R., Scullion T., and Lytton R. The Overlay
Tester: Comparison with Other Cracking Test Methods and Recommendations for
Surrogate Cracking Tests. FHWA/TX-13/0-6607-2. Texas A&M Transportation Institute,
College Station, 2013.
[22] Imad L Al-Qadi, et. al. Utilizing lab tests to predict asphalt concrete overlay
performance. Report FHWA-ICT-17-020, Illinois Center for Transportation, Urbana, 2017.
[23] Zhou, F. and Scullion, T. Overlay Tester: A Rapid Performance Related Crack
Resistance Test. Report FHWA/TX-05/0-4667-2. Texas Transportation Institute, the
Texas A&M University System, College Station, 2005.
[24] Al-Qadi I.L., Ozer H, and Lambros J. Development of the Illinois Flexibility Index Test.
Transportation Research Circular Number E-C251. Relationship Between Laboratory
Cracking Tests and Field Performance of Asphalt Mixtures, Transportation Research
Board 500 Fifth Street, NW Washington, D.C. 2019.
[25] Zhou F. Development of an IDEAL cracking test for asphalt mix design Quality
Control and Quality Assurance. Final Report for NCHRP IDEA Project 195, Texas A&M
Transportation Institute, 2019.
[26] Serati, Mehdi, Alehossein, Habib and Williams, David J. 3D elastic solutions for
laterally loaded discs: generalised Brazilian and Point Load tests. Rock Mechanics and
Rock Engineering, 47 (4), 1087-1101. doi: 10.1007/s00603-013-0449-9, 2013.
[27] Serati, Mehdi, Masoumi, Hossein, Williams, David J. and Alehossein. Modified
Brazilian test for indirect measurement of tensile strength of brittle materials. ARMA 2017:
51st U.S. Rock Mechanics/Geomechanics Symposium, San Francisco, CA, United
States, 25-28 June 2017. Alexandria, VA, United States: ARMA, 2017.
[28] Cooper, S.B., and Mohammad, L. N. Implementation of Balanced Mixture Criteria
During Asphalt Mixture Design. Louisiana’s Experience. Transportation Research
Circular Number E-C251. Relationship Between Laboratory Cracking Tests and Field
Performance of Asphalt Mixtures, Transportation Research Board 500 Fifth Street, NW
Washington, D.C. 2019.
[29] Serati, M, Valluru, T., van Wijk, I., and Masoumi, H, 2020. High-Speed Photography
of Asphalt Cracking, Proceedings of 54th U.S. Rock Mechanics/Geomechanics
Symposium, Golden, Colorado, USA, 28 June–1 July 2020.
[30] Serati, M, Valluru, T, van Wijk, I. Characterisation of the fracture mode in Asphalt at
varying temperatures, 2021 Resource Operators Conference, 11–12th February 2021,
Brisbane, Australia.
AfPA 2021 International Flexible Pavements Symposium | Roads going full circle
15You can also read