Market Analysis for Fischer-Tropsch - Waxes Kimberly L. Jensen, R. Jamey Menard, and Burton C. English - Southeastern ...
←
→
Page content transcription
If your browser does not render page correctly, please read the page content below

Market Analysis for Fischer-Tropsch
              Waxes
  Kimberly L. Jensen, R. Jamey Menard, and Burton C. English
Authors are Associate Professor, Professor, Research Leader, and
Professor, respectively, of the Department of Agricultural and Resource
     Economics, Institute of Agriculture, University of Tennessee.

 This study was funded through USDA’s Agriculture and Food Research
Initiative Regional Coordinated Agricultural Project Grant Program. For
   downloadable copies, please visit the Department’s web site at the
 Biobased Energy Analysis Group’s web site at http://beag.ag.utk.edu or
 the Southeastern Partnership fort Integrated Biomass Supply System’s
                   website at http://www.se-ibss.org/

        Additional copies of this report may be obtained from:
         Department of Agricultural and Resource Economics
                     The University of Tennessee
                         2621 Morgan Circle
                      Knoxville, TN 37996-4518
                           (865)-974-3716
Table of Contents

Introduction ............................................................................................................................................ 1

Fischer-Tropsch Process .................................................................................................................... 2

   Process Description ..................................................................................................................... 2

   Commercialization ...................................................................................................................... 3

U.S. Production and Supplies of Waxes ......................................................................................... 5

   Product Supplied and Wax Capacities......................................................................................... 5

Wax Imports............................................................................................................................................ 8

   Total Imports ............................................................................................................................... 8

   Import Sources ............................................................................................................................ 8

   Wax Imports by Type ................................................................................................................ 11

Wax Exports .......................................................................................................................................... 11

   Total Exports.............................................................................................................................. 11

   Export Destinations ................................................................................................................... 11
Wax Demands ....................................................................................................................................... 13

Wax Prices ............................................................................................................................................. 17

Conclusions ........................................................................................................................................... 18

References Used .................................................................................................................................. 19
List of Tables

Table 1. U.S. Supply and Disposition of Waxes, 1981-2011 ......................................................... 6

Table 2. Lubricating Oil and Wax Capacities ................................................................................ 7

Table 3. U.S. Wax Market Size ...................................................................................................... 8

Table 4. U.S. Import Sources of Waxes, 2004-2011 ..................................................................... 9

Table 5. U.S. Export Destinations for Waxes, 2004-2011 .......................................................... 12

Table 6. Value of Manufacturing Shipments for Industries Potentially Using FT Waxes .......... 16
List of Figures

Figure 1. U.S. Crude Oil First Purchase Price, 1980-2011 ............................................................. 1

Figure 2. Supply & Disposition of Waxes in the United States, 1981-2011 ................................ 7

Figure 3. Shares of U.S. Wax Imports by Source, 2011 .............................................................. 10

Figure 4. Wax Imports by Type into the United States, 2007-2010 .......................................... 11

Figure 5. Shares of U.S. Wax Imports by Destination, 2011 ...................................................... 12

Figure 6. North American Wax Demand by Application, 2006 .................................................. 14

Figure 7. Production of Medium Waxes, 2006-2020 ................................................................. 14

Figure 8. Value of Shipments by Industries Using FT Waxes ..................................................... 15

Figure 9. Paraffin Wax: FOB USG in US Gulf Spot Slackwax Bulk ............................................. 17

Figure 10. Paraffin Wax: CFR S.E. Asia Mp 58/60c In Asia Pacific Spot Fully Ref Slab ............. 18
Market Analysis for Fischer-Tropsch Waxes

Introduction

       Waxes are organic substances that are solid at room temperature but become free-

flowing liquids at slightly higher temperatures. While the main commercial source of wax is

crude petroleum, mineral wax can also be produced from lignite, plants, animals, and insects.

Overall synthetic wax consumption in North America in 2010 was estimated at 420 million

pounds (AFPM 2013a). The fastest growing wax markets are for hydrogenated vegetable and

natural palm waxes. Synthetic waxes mainly represented by Fischer-Tropsch (FT) and

polyethylene (PE) waxes currently represent 11 percent of global wax supply (Zaworski, 2011).

       Currently, the United States imports a significant share of the waxes supplied (65.3

percent). International trade has grown increasingly important in wax markets, with the United

States being a major global market demander. Important import source countries include

China and Canada (AFPM, 2013a).

       During periods of high
                                              120
petroleum prices, such as
                                              100
those seen in the 2008 and                    80
                                   $/barrel

                                              60
2011 (Figure 1), and with the
                                              40

methods used in refining oil                  20
                                               0
producing less by-product
                                                    1980
                                                    1982
                                                    1984
                                                    1986
                                                    1988
                                                    1990
                                                    1992
                                                    1994
                                                    1996
                                                    1998
                                                    2000
                                                    2002
                                                    2004
                                                    2006
                                                    2008
                                                    2010

waxes, other sources of waxes

are becoming economically         Figure 1. U.S. Crude Oil First Purchase Price, 1980-2011
                                                        (Source: DOE/EIA, 2013a)

                                                    1
more competitive. Examples of such a source are waxes produced as co-products in biofuels
production. The purpose of this study is to examine potential markets for waxes produced with
biofuels.
Fischer-Tropsch Process
Process Description
Gasification is one process pathway for producing biofuels. The process requires a high-
temperature and a catalyst for biofuel production. The resulting product produced from
gasification is a flammable gas called synthesis gas or syngas. Fixed bed, fluidized bed, and
entrained flow are the three main reactor types used for gasification with each having
advantages and disadvantages and corresponding operating temperature ranges. Before
gasification can occur, some degree of biomass processing must occur. Normally size reduction
and drying of the feedstock for gasification are required. Once the syngas is produced,
contaminants (i.e., particulates, tars, alkali compounds, sulfur compounds, nitrogen
compounds, etc.) must be removed or reduced so downstream processes are not affected.
Once the syngas is cleaned, it is ready to be transformed into higher value products such as
power generation, liquid-fuel synthesis, and chemical synthesis. Major commercial applications
for the use of syngas include ammonia production from hydrogen, methanol synthesis, and
hydrocarbons synthesis via the FT process. For FT catalytic synthesis, a variety of alkanes can
be produced. Iron catalysts and high temperatures are used to produce gasoline-range
products, whereas low temperatures and cobalt catalysts are used to produce diesel-range and
wax products. As the temperature decreases, lower hydrocarbon chains form. Long-carbon-
chain wax products are favored at low temperatures. If diesel products are selected, further
2hydrocracking is required in a separate unit adding capital costs for liquid fuel production
(Swanson et al., 2010). In order to produce waxes from FT catalytic synthesis, this gas-to-liquid
(GTL) technology needs further commercial development.
Waxes produced via the FT process are considered synthetic waxes and may be
classified as hard or medium. Because of increased pressure from governments, environmental
organizations and the publics’ pollution concerns, plus emissions from vehicles, GTL technology
is expected to expand in the future. Another synthetic wax, polyethylene, and FT hard waxes
are interchangeable to some degree. Medium waxes that have a high degree of inter-
changeability include FT medium waxes, petroleum waxes, alpha-olefins, and natural waxes.
Currently, shortages of hard waxes exist resulting in expected increased demand in the next
decade from adhesives, inks, PVC lubrication, and new applications (Cook, 2010). Of the overall
synthetic wax consumption in North America in 2010 of 420 million pounds, FT wax accounts
for about 195 million pounds (AFPM, 2013a).
Commercialization
Sasol, a South African company involved in mining, energy, chemicals, and synfuels, uses
proprietary FT technology to produce petrol and diesel from coal and natural gas. Solvents, co-
monomers, ethylene, propylene, and FT waxes are extracted from the FT process. Sasol is
currently involved in joint ventures or collaboration for projects located in Qatar, Iran, and
Nigeria. The company is involved in a feasibility study for 80,000 barrels per day coal to liquid
plant in China and is in planning stages for facilities to be located in Uzbekistan and North
America (Sasol, 2013). Sasol Wax is expanding the Sasolburg hard wax production facility. The
3plant produces about 200,000t of hard waxes, medium waxes, liquid paraffins and waxy oils.
The first phase will increase the capacity of the site by 40% (Chemicals-Technology, 2012).
South Africa’s national oil company, PetroSA, has a GTL refinery at Mossel Bay
producing 36,000 barrels per day. The refinery produces liquefied petroleum gas, petrol, diesel,
and value added chemicals. Two main classes of chemicals are produced—alcohols and low-
aromatic distillates. For the low-aromatic distillates produced, applications include inks and
surface coatings, wax polishes, spray lubricants, among many others. Two new projects in the
future include Project Ikhwezi, which will tap gas reserves in sustain GTL refinery in Mossel Bay,
and Project Mthombo, which will be a crude refinery in the Eastern Cape (PetroSA, 2013).
Shell Middle Distillate Synthesis (Malaysia) located in Bintulu, Sarawak uses GTL
technology to produce chemical feedstocks and waxes. The specialty waxes produced are used
for hot melt adhesives, printing inks, cable filling, match sticks, corrugated board, fibre board,
and PVC lubricants. With color additives, the waxes can be further used for crayons, candles,
graphic arts and other decorative items (Shell, 2013).
Ras Laffan is an industrial city located near Doha, Qatar and is administered by Qatar
Petroleum. The site utilizes technology for the production of liquefied natural gas and GTL
products. Two synthetic fuel plants based in Ras Laffan are Oryx GTL and Pearl GTL. Both
facilities convert liquid natural gas into liquid petroleum products. Oryx GTL produces 34,000
barrels per day of oil and was the world’s first commercial-scale GTL plant (Quatar Petroleum,
2013). Pearl GTL is the world’s largest GTL plant, producing 140,000 barrels per day of
petroleum liquids (Pipeline and Gas Journal, 2011).
4UPM, a Finnish pulp, paper and timber manufacturer, has three business groups that
focus on energy and pulp, paper, and engineered materials. The fiber business, however, forms
the foundation for UPM’s strategy. More specific product groupings the company is involved in
includes paper (both coated and uncoated), energy (emission free electricity and biomass based
combined heat and power production), biofuels (biodiesel from gasification technology), pulp,
forest services, timber, labels, plywood, composites, and biobased chemicals and additives
(UPM, 2013).
Rentech, located in Commerce City, Colorado, and with partner ClearFuels employs
biomass gasification technology to produce syngas for renewable power and fuels production.
Using FT chemistry, the facility produces approximately 10 barrels per day of renewable and
synthetic drop-in diesel and jet fuels. As part of their production process, the company
produces specialty waxes and chemicals. Commercial-scale facilities are planned for White
River, Ontario; Natchez, Mississippi; Rialto, California; and Port St. Joe, Florida (Rentech, 2013).
The Flambeau River Biofuels project in Park Falls, Wisconsin is projected to use 1,000
tons of woody biomass (wood) per day or 350,000 dry tons per year and produce 10 MMgy of
FT waxes and 8 MMgy FT diesel or 9 MMgy of each (USDPE/EERE, 2013). This project is slated
to be in operation by 2012 (Retka Schill, 2009).
U.S. Production and Supplies of Waxes
Product Supplied and Wax Capacities
Since the mid-1990’s, U.S. product supplies of waxes have declined (Table 1). In 2011,
the product supplied from the United States was 2,723,000 barrels, less than one-third of the
1996 peak of 8,789,000 barrels. A key factor in this decline of production of waxes is the
5changes in crude oil markets and refining. The production by refineries and blenders in the
United States declined from a peak of 9,380,000 barrels to 3,038,000 barrels in 2011.
Table 1. U.S. Supply and Disposition of Waxes, 1981-2011
Decade 0 1 2 3 4 5 6 7 8 9
Year
Product Supplied (Thousand Barrels)a
1980s 6,581 5,146 5,595 5,541 5,670 5,525 5,911 6,131 6,043
1990s 6,014 6,344 6,729 7,229 7,330 7,331 8,789 7,900 7,652 6,761
2000s 5,975 6,563 5,810 5,606 5,555 5,665 4,722 3,953 3,457 2,207
2010s 3,085 2,723
U.S. Refinery and Blender Net Production of Waxes (1,000 Barrels)
1980s 6,943 5,135 5,535 5,388 5,506 5,613 5,879 6,166 6,223
1990s 6,193 6,681 6,738 7,328 7,637 7,713 9,380 8,372 8,355 7,075
2000s 6,478 6,523 6,322 5,739 5,530 5,808 5,387 4,504 3,647 2,804
2010s 3,028 3,038
U.S. Imports of Waxes (Thousand Barrels)
1980s 260 379 334 490 514 582 543 631 638
1990s 418 491 580 646 575 472 468 441 613 971
2000s 860 918 1,017 1,157 1,470 1,471 1,113 1,242 1,568 1,497
2010s 1,987 1,779
U.S. Exports of Waxes (Thousand Barrels)
1980s 494 252 283 462 370 468 562 625 620
1990s 642 767 806 711 808 925 1,002 993 1,157 1,301
2000s 1,293 1,313 1,245 1,459 1,532 1,705 1,757 1,829 1,857 2,165
2010s 1,841 2,011
a
A gallon of microcrystalline wax weighs about 7 pounds (GlobalWax, 2013).
(Source: DOE/EIA, 2013b)
Figure 2 illustrates the downward trend in refinery and blender production from the
United States, along with increasing importance of trade, both imports and exports. The
location of much of the lubricating oil and wax capacity is in oil refining areas. Major lubricating
oil and wax capacities from refineries can be found in Texas, Louisiana, Oklahoma, and
California (Table 2).
610,000
9,000
8,000
1,000 Barrels 7,000
6,000
5,000
4,000
3,000
2,000
1,000
0
Product Supplied U.S. Refinery & Blender Prod.
Imports Exports
Figure 2. Supply & Disposition of Waxes in the United States, 1981-2011
Source: DOE/EIA, 2013c
Table 2. Lubricating Oil and Wax Capacities
U.S. Refiners Location Plant Capacitya
1,000 barrels/day
American Refining Group Bradford, Pennsylvania 3.6
Calumet Lubricants Comp Princeton, Louisiana 9.7
Calumet Lubricants Comp Shreveport, Louisiana 65.0
Chevron Corporation Richmond, California 57.6
Cross Oil & Refining Comp Smackover, Arkansas 7.0
Ergon Refining Vicksburg, Mississippi 22.0
Ergon – West Virginia Newell, West Virginia 6.0
Excel Paralubesb Westlake, Louisiana 32.2
Exxon Mobil Corporation Baton Rouge, Louisiana 182.9
Exxon Mobil Corporation Baytown, Texas 282.0
Exxon Mobil Corporation Beaumont, Texas 126.0
HollyFrontier Corporationc Tulsa, Oklahoma 155.3
The International Group Smethport, Pennsylvania 3.5
LyondellBasell Industries Houston, Texas 280.4
Motiva Enterprises LLC Port Arthur, Texas 64.0
Paulsboro Refining LLC Paulsboro, New Jersey 160.0
San Joaquin Refining Comp Bakersfield, California 14.3
Valero Energy Corporation Three Rivers, Texas 3.2
Total: 1,474.7
a
Per EIA 2011 Petroleum Supply Annual
b
Flint Hills – ConocoPhillips’ Westlake
c
Plant capacity data for both Tulsa East & Tulsa West
(Source: AFPM, 2013b)
7The Fischer-Tropsch portion of the market is still relatively small accounting for about
1.45 percent of the U.S. market (Table 3). The Fischer-Tropsch wax supply would fall into the
range of waxes with performance similar to modified vegetable wax.
Table 3. U.S. Wax Market Size
Product Market Size
MM lbs
Low Melt Paraffin 1,000
Mid Melt Paraffin 600
High Melt Paraffin 380
Polyethylene 275
Microcrystalline Waxes 220
Petrolatum 210
Fischer-Tropsch 40
Carnauba 12
Montan 10
Lanolin 9
Beeswax 7
Candelilla 1
(Source: Craig, 2007)
Wax Imports
Total Imports
Imports of waxes have increased steadily over the past several years (Table 4). Growth
in wax imports has been driven by changes in U.S. production, plus a continuing growth in
demand.
Import Sources
Canada’s importance as a source of waxes has dropped dramatically, whereas China’s
importance has increased (Table 4). By 2011 (Figure 3), China held 43 percent share of U.S. wax
imports on a volume basis. In 2011, wax imports to the United States totaled close to 1.8
million barrels. The top five countries exporting wax to the United States were China (769,000
barrels), Canada (257,000), Japan (150,000), Greece (140,000), and the United Kingdom
8(85,000). For 2011, wax imports from these five countries totaled 1.4 million barrels, or 78.8
percent of total United States wax imports. Wax imports from South Africa (84,000) and
Malaysia (75,000) combined totaled 159,000 barrels.
Table 4. U.S. Import Sources of Waxes, 2004-2011
Year
Source 2004 2005 2006 2007 2008 2009 2010 2011
(1,000 Barrels)
Argentina 1 1
Brazil 27 6 6 3 30
Canada 784 773 78 110 138 148 393 257
China 469 415 475 534 976 814 894 769
Taiwan 34 13 19 25 25
Egypt 23 22 66 38
France 4 4 75 4 16
Germany 17 16 30 12 2 11 10
Greece 60 103 140
Hong Kong 23
Hungary 6 4 7 5 8 14 6 7
India 15
Indonesia 2
Israel 2
Italy 20 8 1 15
Japan 15 15 130 144 112 208 214 150
Korea 2 2
Malaysia 142 219 163 149 125 132 75
Mexico 25 10 6 3
Netherlands 5 3 2 1 2
Norway 16
Russia 1 2
Singapore 11 5 23
S. Africa 83 91 81 95 95 77 73 84
Spain 16 2
Thailand 68 5 33 55
U.K. 4 85
Total 1,470 1,471 1,113 1,242 1,568 1,497 1,987 1,779
(Source: DOE/EIA, 2013d)
91% 1% 4%
2% China
2%
3% Canada
4% Japan
Greece
5% U.K.
43% S. Africa
5% Malaysia
Thailand
8% Egypt
Taiwan
Singapore
8% Hong Kong
All Others
14%
Figure 3. Shares of U.S. Wax Imports by Source, 2011
Source: DOE/EIA, 2013f
Asia is a key supplying region due to the combination of China’s petroleum waxes, FT
waxes from Malaysia, natural palm waxes from Malaysia and Indonesia, and PE waxes from
Japan, Korea, and Thailand (Agashe, 2006). The top five U.S. ports receiving wax shipments
were Philadelphia, Pennsylvania (648,000 barrels); Oakland, California (279,000); Buffalo-
Niagara Falls, New York (241,000); New York, New York (132,000); and Richmond, California
(123,000). In 2011, these ports received approximately 80.0 percent of the total wax imported
to the United States. Wax imports from Malaysia entered the United States through Texas
ports primarily, whereas South African wax imports entered California, New York, South
Carolina, and Texas ports (USDOE/EIA, 2013e). Declines in paraffin wax supplies from North
America (due to changes in Group I base oil production) and Western Europe have been offset
by growing supplies from China (Zaworski, 2011).
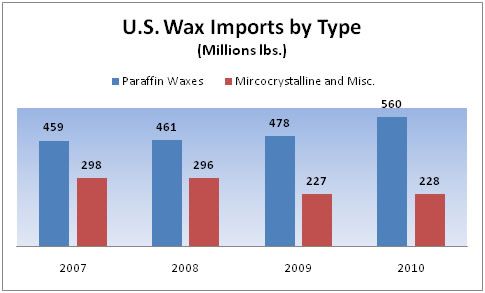
10Wax Imports by Type
The United States imports about 62 percent from paraffin type waxes, and about 38
percent microcrystalline and other waxes (Figure 4). During the past several years, the role of
paraffin imports has increased relative to other wax types.
Figure 4. Wax Imports by Type into the United States, 2007-2010
Source: AFPM, 2013
Wax Exports
Total Exports
As can be seen in Table 5, overall exports of waxes from the U.S. have been increasing.
Growth in wax imports by Canada has helped increased overall exports.
Export Destinations
Exports to Canada have increased from 870,000 barrels in 2004 to 1,162,000 barrels in
2011 (Table 5). Exports to Mexico, another key trading partner, have remained fairly level.
While holding a much smaller share, exports to Belgium grew rapidly between 2004 and 2011.
11Table 5. U.S. Export Destinations for Waxes, 2004-2011
Year
Source 2004 2005 2006 2007 2008 2009 2010 2011
(1,000 Barrels)
Belgium 11 9 13 29 16 27 19 19
Canada 870 919 969 771 810 832 955 1,162
Chile 3 5 4 4 2 29 36 35
China 10 7 19 55 68 263 79 43
France 21 7 78 327 243 88 20 23
India 4 9 9 11 17 166 59 40
Japan 20 17 5 6 6 10 20 22
Mexico 471 595 549 516 555 422 476 462
Netherlands 2 1 6 10 26 84 43 102
United Kingdom 5 5 5 6 7 89 5 22
Total 1,532 1,705 1,757 1,829 1,857 2,165 1,841 2,011
Source: (DOE/EIA, 2013f)
In 2011, Canada imported about 58 percent of the wax exported by the United States
(Figure 5). This was followed by Mexico, which imported 23 percent of U.S. exports. Much
smaller proportions of exports go to a variety of countries in Europe, South America, and Asia.
1% 1% Canada
1% 1% 4%
2% Mexico
2%
2% Netherlands
5%
China
India
Chile
58%
France
23%
Japan
United Kingdom
Belgium
Figure 5. Shares of U.S. Wax Imports by Destination, 2011
Source: DOE/EIA, 2013g
12Wax Demands
Wax consumption has been projected to grow at an average annual rate of greater than
2 percent from 2010 to 2020 (Craig, 2007; Zaworski, 2011). Waxes are used in a variety of
products, including packaging, coatings, personal care products, and, of course, candles. Waxes
can also be further processed into synthetic lubricants. FT hard and medium waxes have a
variety of uses. Currently, shortages of hard waxes exist resulting in increased demand in the
next decade from adhesives, inks, PVC lubrication, and new applications. Medium waxes can
be used for making candles, while paraffins can used in polymers, bitumen modifiers, hot melt
adhesives, and printing inks. Medium waxes can also be used in construction, packaging, paper,
personal care, and tire industries. The largest volume growth in wax demand will arise from
applications that currently use petroleum waxes (Cook, 2010). However, in order for FT waxes
to play a role in meeting this demand, gas to liquid technology is needed (Cook, 2010).
Overall wax demands are largest for board sizing and candles (Figure 6). Combined
these two products account for about 44 percent of the demand. These uses are followed by
Rheology/Surface Application, which is in turn driven by plastics, tire, rubber and hot melt
adhesives industry growth. The next largest category is corrugated boxes.
Petroleum wax production is driven oil industry developments, with production from
this source expected to decline in the future (Figure 7). If a decline in production occurs, an
undersupply will develop over next decade, with FT medium waxes being a candidate source to
help meet this short fall. FT medium waxes have a high degree of purity (no sulphur, aromatics)
(Cook, 2010).
134% 3%
5%
23%
Board Sizing
14% Candles
Other
Rhelogy/Surface Applic.
Corrugated Boxes
Cups/Containers
Health Industries
15% 21%
Flexible Packaging
15%
Figure 6. North American Wax Demand by Application, 2006
Source: Craig, 2007
Figure 7. Production of Medium Waxes, 2006-2020
(Source: Cook, 2010)
14The historical value of shipments from industries potentially using FT waxes are shown
in Table 6. These wax using industries include candles, paint and coating manufacturing,
resins, plastics, and synthetic rubber manufacturing, tire manufacturing, polish and other
sanitation goods, corrugated and solid fiber boxes, and printing ink manufacturing. By far, the
largest industries are resins, plastics, and synthetic rubber manufacturing.
Among industries potentially using FT waxes, several experienced growth in the 2000’s
until 2008/2009, with several of these industries experiencing a downturn (Figure 8). Several of
the industries did gain value in 2010 however.
$100 Candles
$90
$80 Paint & Coatings
$70
Resins, Plastics, &
$60 Synthetic Rubber
Million $
$50
Tires
$40
$30 Polish & Sanitation
Goods
$20
$10 Corrugated & Solid
Fiber Boxes
$0
2002 2003 2004 2005 2006 2007 2008 2009 2010 Printing Ink
Figure 8. Value of Shipments by Industries Using FT Waxes
Source: Census Bureau, 2010
15Table 6. Value of Manufacturing Shipments for Industries Potentially Using FT Waxes
NAICS Description 2002 2003 2004 2005 2006 2007 2008 2009 2010
Product Shipment Value ($1,000)
339999 Candles 1,266,915 1,343,069 1,231,114 1,312,309 1,205,116 1,201,385 1,416,698 1,440,454 1,495,818
Paint and coating
325510 manufacturing 19,235,657 19,499,529 21,305, 421 22, 906, 857 23,727,641 22,367,758 21,057,613 18,523,431 21,042,836
Resin, plastics, and
synthetic rubber
32521 manufacturing 52,321,610 56,366,464 65,655,975 82,858,829 85,114,327 91,011,605 90,129,994 66,850,1895 86,502,608
32621 Tire
Manufacturing 12,789,156 13,470,727 14, 099, 140 14, 329, 174 16,748,256 17,115,613 16,321,926 14,840,563 16,630,467
Polish and other
sanitation good
325612 manufacturing 8,228,102 8,665,906 9, 001, 179 9, 224, 478 9,874,762 10,304,962 8,997,874 9,162,032 8,459,173
Corrugated and
322211 solid fiber boxes 27, 851 ,507 27 ,686 ,609 28, 934, 796 30 ,363, 391 32,080,947 30,871,505 31,451,896 28,330,685 30,663,604
Printing ink
325910 manufacturing 4, 044, 871 3, 940, 047 4, 395, 293 4, 833, 152 4,716,554 4,620,458 4,461,546 4,085,365 5,064,601
(Source: Census Bureau, 2010)
16Wax Prices
Wax prices in the United States track Asian prices (see Figures 9 and 10). Both of these
sets of prices are heavily influenced by petroleum prices (see Figure 1). In 2012, U.S. Bulk
Slackwax (a semi-refined wax) prices were about $1,300 per MT. Prices for paraffin wax FOB at
the US Gulf have shown a steady increase over the past several years (Figure 9). These
increases were spurred by tight wax supplies and rising crude oil prices (Zaworski, 2011). Prices
spiked in 2008 with the increase in crude oil prices. In 2012, prices averaged about $1,300 per
metric ton. Asian paraffin prices were about $1,450 per MT. High melting point and low
viscosity FT wax can bring as much as $2,500 per ton.
2,000
1,800
1,600
US$/Metric Ton
1,400
1,200
1,000
800
600
400
200
0
Figure 9. Paraffin Wax: FOB USG in US Gulf Spot Slackwax Bulk
Source: ICIS, 2012
171,600
1,400
1,200
US$/Metric Ton 1,000
800
600
400
200
0
Figure 10. Paraffin Wax: CFR S.E. Asia Mp 58/60c In Asia Pacific Spot Fully Ref
Slab
(Source: ICIS, 2012)
Conclusions
The desire to produce biofuels to help offset the United States reliance on imported oil
will potentially drive growth in the biofuels industry. The Fischer-Tropsch technology can
convert a variety of feedstocks, including biomass, wastes, natural gas, coal, or pet coke into
transportation fuels. A co-product of this process is FT waxes. The market for FT waxes
appears to be growing, as market demands expand here in the United States and overseas. The
market has several suppliers in existence already; however, the majority of these are overseas.
Traditional users of petroleum based waxes can constitute potential users of FT waxes. The
plastics/resins industries, which are potential users of FT waxes overall, are continuing to
expand in the United States, with a dip during the 2008/2009 period. In addition to domestic
use, export markets, such as Canada and Mexico, for waxes may constitute another set of
markets for FT waxes.
18References Used
Agashe, G. 2007. Introduction to Global Opportunities and Threats in the Wax Business, 2006-
2020. LW-07-107 .
American Fuel & Petrochemical Manufacturers. 2013b. Lubricating Oil and Wax Capacities of
Refiners and Re-Refiners in the Western Hemisphere. Internet site: www.afpm.org.
American Fuel & Petrochemical Manufacturers. 2013a Wax Facts. Internet site:
http://www.afpm. org/wax-facts/. Last accessed 1/3/2013.
Chemicals-Technology.com. 2012. “Sasol Wax Expansion Project, Sasolburg, South Africa.”
Available at http://www.chemicals-technology.com/projects/sasol-wax-expansion-
project/
Cook, T. 2010. The Role of Fischer-Tropsch Waxes in Meeting Future Market Needs. LW-10-
107. National Petrochemical & Refiner Association.
Craig, D. 2007. NatureWax®: Novel Waxes for Today & Tomorrow. International Lubricants &
Waxes Meeting , November 1-2, 2007 , Houston, TX. LW-07-108.
GlobalWax. 2013. Handy Wax Facts. Internet site: http://www.globalwax.net/facts.htm. Last
accessed 1/3/2013.
Independent Chemical Information Service (ICIS). 2012. Historical Price Data Available for U.S.
and Asian Paraffin Wax, 2005-2012. Internet site: http://www.icis.com/.
PetroSA. Internet site: http://www.petrosa.co.za/Pages/Home.aspx. Last accessed 1/3/2013.
Pipeline and Gas Journal. First Gas Flows From Pearl GTL In Qatar, March 2011, Vol. 238. No. 3.
Internet site: http://www.pipelineandgasjournal.com/first-gas-flows-pearl-gtl-qatar.
Last accessed 1/7/2013.
Quatar Petroleum. 2013. Oryx GTL. Internet site: http://www.qp.com.qa/en/Homepage/
QPActivities/SubsidiariesAndJointVentures/SubsidiariesAndJointVenturesDetails.aspx?SJ
VID=bfae4d2f-fa15-4b5c-9f10-cb8fba3e6ea4. Last accessed 1/7/2013.
Rentech Company Website. 2012. Available at http://www.rentechinc.com/.
Retka Schill, S. Advanced biofuel project picks up steam in Wisconsin. Biodiesel Magazine.
Internet site: http://www.biodieselmagazine.com/articles/3824/advanced-biofuel-
project-picks-up-steam-in-wisconsin/. October 28, 2009.
Sasol. Internet site: http://www.sasol.com/sasol_internet/frontend/navigation.jsp?
navid=1&rootid=1. Last accessed 1/3/2013.
19Shell MDS (Malaysia) Internet site: http://www.shell.com.my/home/content/mys/products_
services/solutions_for_businesses/smds/ Last accessed 1/3/2013.
Swanson, R., J. Satrio, R. Brown, A. Platon, and D. Hsu. Techno-Economic Analysis of Biofuels
Production Based on Gasification. Technical Report NREL/TP-6A20-46587, November
2010.
U.S. Census Bureau. 2010. “Annual Survey of Manufacturers.” American FactFinder. Available
at http://factfinder2.census.gov/faces/tableservices/jsf/pages/productview.
xhtml?pid=ASM_2009_31VS101&prodType=table.
U.S. Department of Energy, Energy Information Administration (DOE/EIA). 2013e. Company
Level Imports Archives. Historical Imports by Month Including Final Revisions. Internet
site: http://www.eia.gov/petroleum/imports/companylevel/archive/. Last accessed
1/4/2013.
U.S. Department of Energy, Energy Information Administration. 2013f. Exports by Destination.
Petroleum & Other Liquids. Available at http://www.eia.gov/dnav/pet/pet_move_expc
_a_EPPW_EEX_mbbl_a.htm.
U.S. Department of Energy, Energy Information Administration (DOE/EIA). 2013d. Imports by
Country of Origin. Internet site: http://www.eia.gov/dnav/pet/pet_move_impcus_
a2_nus_eppw_im0_mbbl_a.htm. Last accessed 1/3/2013.
U.S. Department of Energy, Energy Information Administration (DOE/EIA). 2013c. Supply and
Disposition. Petroleum and Other Liquids. Internet site: http://www.eia.gov/
dnav/pet/pet_sum_snd_d_nus_mbbl_a_cur.htm.
U.S. Department of Energy, Energy Information Administration (DOE/EIA). 2013b. U.S. Product
Supplied of Waxes. Petroleum and Other Liquids. Internet site: http://www.eia.
gov/dnav/pet/hist/LeafHandler.ashx?n=PET&s=MWXUPUS1&f=A. Last accessed
1/3/2013.
U.S. Department of Energy, Energy Information Administration (DOE/EIA). 2013a. U.S. Crude Oil
First Purchase Price. Internet site: http://www.eia.gov/dnav/pet/hist/LeafHandler.
ashx?n=PET&s=F000000__3&f=A. Last accessed 1/3/2013.
U.S. Department of Energy, Energy Information Administration (DOE/EIA). 2013g. Wax: U.S.
Imports by Country of Origin. Internet site: http://www.eia.gov/dnav/pet/
pet_move_impcus_a2_nus_eppw_im0_mbbl_a.htm. Last accessed 1/3/2013.
UPM Company Website. 2012. Available at http://www.upm.com/EN/Pages/default.aspx.
Zaworski, F. Global Wax Market Makes Room for Alternatives. Feb. 15, 2011. Internet site:
http://www.icis.com/Articles/2011/02/15/9435638/global-wax-market-makes-room-
for-alternatives.html. Last accessed 1/3/2013.
20You can also read