Reef Terrace Development from Bathymetric Mapping of the Maui-Nui Complex, Hawaii
←
→
Page content transcription
If your browser does not render page correctly, please read the page content below
Reef Terrace Development from Bathymetric Mapping of the
Maui-Nui Complex, Hawaii

Iain Faichney, James Cook University
Mentor: David Clague
Summer 2007

Keywords: fossil reef, Hawaii, sea level, subsidence, marine terrace

ABSTRACT
High resolution bathymetry data collected over the Maui-Nui Complex shows a series of
terraces stepping down the flanks of the volcanic islands. This study compiled these data
to make interpretations on the evolution of these terraces with respect to island
subsidence and sea level fluctuations throughout the history of the islands. These data
were processed using MBSystem and mapped in ArcGIS using ArcMap and ArcScene.
The mapping consisted of tracing reef crests and examining the behavior of these
terraces. It revealed dipping of the submerged terraces away from a structural high to the
south of Lanai. It is proposed that this high was caused by a buried volcanic cone
revealed in the bathymetry data as a small cone standing above the flat reef terrace.

INTRODUCTION
The Maui-Nui Complex is the series of islands of Lanai, Molokai, Maui and
Kahoolawe and their adjacent areas, located in the Hawaiian Archipelago, northwest of
the island of Hawaii in the central Pacific Ocean (Figure 1). For this study, the island of
Oahu was been included in the Maui-Nui Complex as it was connected to Molokai as
shown by the bathymetry (Figure 1).

GEOLOGICAL SETTING
The Hawaiian Islands, along with the Emperor Seamounts further northwest, are a
volcanic chain created as a result of the Pacific plate moving northwest across a relatively
stationary hotspot (Wilson 1963; Morgan 1972). At such a hotspot, a magmatic plume
rises from deep in the mantle and erupts as volcanic cones, which build into islands;
sequentially as the plate moves across the hotspot. Rapid loading of the crust over the
hotspot causes localized lithospheric subsidence, as shown in Hawaii by tide gauge data
at Hilo (Moore, Ingram et al. 1996) by dated submerged coral reef terraces (Ludwig,
Szabo et al. 1991) and as modeling of seismic sections away from the island of Hawaii
(Moore 1987; Watts and Ten Brink 1989). Farther from the central loading point, this
subsidence gives way to relative stability, and increasingly distant, lithospheric processes

                                             1
produce a zone of uplift. More distal from the hotspot still, the islands revert again to
subsidence (Moore 1987) in response to lithospheric cooling with age.

 Figure 1 Location
 map. a. Bathymetry
 map of the Main
 Hawaiian Islands
 showing the Maui-
 Nui Complex. b.
 Vertical profile line
 A-A' showing
 interpreted terraces.
 c. Exploded section
 from (a.) south and
 west of Lanai
 showing interpreted
 fossil reef terraces as
 coloured lines. The
 image is a slope map
 overlain with
 bathymetry displayed
 by a Haxby spectrum

A null line is the position of net zero vertical movement within this dynamic region. In
the Maui-Nui Complex uplift is to the northwest, and subsidence in the direction of the
main load of Hawaii is to the southeast. Currently, the exact location of the null line of
the Hawaiian Islands is poorly constrained due to insufficient and conflicting evidence.
Studies of subaerial conglomerates on Lanai indicate uplift (Rubin, Fletcher et al. 2000),
and dated coral and coralline algal deposits from submerged reefs off Lanai provide
evidence for either a nearly static situation (0.01 mm/yr) or slow subsidence (0.04
mm/yr) at Lanai (Webster, Clague et al. 2006; Webster, Clague et al. 2006).
Additionally, observational and modeling data (Watts and Ten Brink 1989) indicate that
the null line lies between Molokai and Oahu. However, Moore and Campbell (1987)
show that tide gauge data from Oahu indicates stability. The vertical movement of this
region is complicated and poorly understood or constrained.

                                            2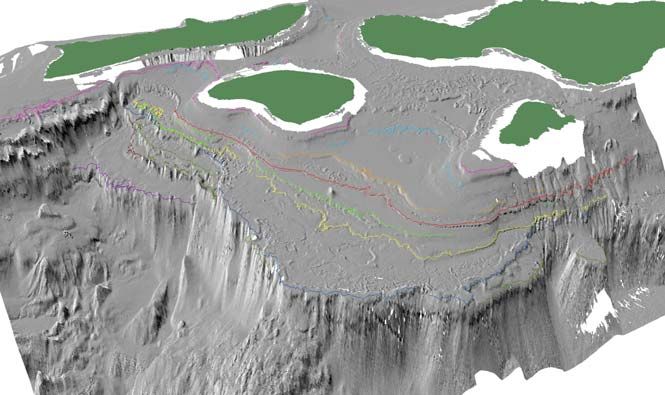
CLIMATE FUNCTIONS
Two separate types of sea-level variation exist over geological timescales; eustatic and
relative change. Eustatic sea-level change is a world-wide adjustment that affects all
oceans, usually caused by ice sheet growth and decay associated with ice-ages, whilst
relative sea-level change is in reference to a local datum often caused by local subsidence
or uplift. Approximately 900 thousand years ago (ka), midway through the development
of the Main Hawaiian Islands, a marked change in global climate occurred. The Mid-
Pleistocene Transition (MPT) (Figure 2) was a change from a climate oscillation with a
41kyr cycle present in the Pliocene and early Pleistocene to the current 100kyr eustatic
sea-level oscillations. The known ages of the Maui-Nui islands predate the MPT:
(Koolau = 2.6 Ma and Waianae = 3.9-3.0 Ma (Oahu), West Molokai = 1.9 Ma and East
Molokai= 1.8 Ma (Molokai), Lanai =1.3 Ma (Lanai), West Maui = 1.3 Ma and Haleakala
= 1.1 Ma (Maui) and Kahoolawe = 1.0 Ma (Kahoolawe). The surrounding reef terraces
for each island are younger to these ages, however

Figure 2 This figure shows a sea-level proxy curve from the Pliocene showing the Mid Pleistocene
Transistion (MPT) from 41 kyr oscillations to the current 100 kyr oscillations. The horizontal scale is in
millions of years.

REEF DEVELOPMENT
Typically a stable tectonic environment will lead to stacked reef units laying one on top
of the next, such as in the Great Barrier Reef (GBR) (Webster and Davies 2003) or reef
units overlying karst surfaces such as at One Tree Reef in the GBR (Davies and Kinesy
1977). Where carbonate reefs and platforms exist in an environment of rapid subsidence
a process called drowning and back-stepping can occur. This is when, due to coral
growth’s inability to keep up with relative sea-level rise, the platform moves out of the
shallow carbonate growth zone and drowns. Once the rapid sea-level rise slows, another
reef or platform starts to develop further up slope where the coral growth zone has been
re-established(Schlager 1981; Mullins, Dolan et al. 1991; Galewsky, Silver et al. 1996;
Webster, Wallace et al. 2004; Webster, Wallace et al. 2004).

This study focuses on the bathymetric relief of the seafloor around the southwestern
section of the Maui-Nui Complex. It will provide an evolution of this reef terrace
sequence with respect to island subsidence and global climate change, and delineate the
location of the null line.

                                                     3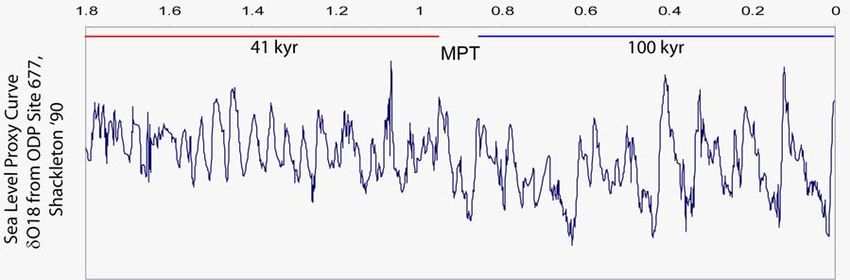
MATERIALS AND METHODS

DATA COLLECTION
High resolution bathymetry and backscatter data has been collected across the Main
Hawaiian Islands over the past thirty years. Multiple organizations have been involved in
this effort, including the Monterey Bay Aquarium Research Institute (MBARI), the
University of Hawaii (UH), the Japan Agency for Marine-Earth Science and Technology
(JAMSTEC), the National Oceanic and Atmospheric Administration (NOAA), the United
States Geological Survey (USGS), Scripps Institution of Oceanography, (SIO), and
Woods Hole Oceanographic Institute (WHOI). In addition to the 30, 120 and 1002 kHz
bathymetric surveys carried out; there have been LIDAR surveys conducted around the
coastlines of Oahu, Molokai, Hawaii, and sections of the coastlines of Lanai and Maui by
the US Army Corp of Engineers. All this data has been compiled at MBARI in a
database on the machine “Heckel”.

DATA PROCESSING
Bathymetric data from the MBARI database, including grids of Penguin Bank and new
data from the Lanai terraces newly acquired from NOAA were processed using
MBSystem, a bathymetric and backscatter data processing and display software package
developed by Dr David Caress of MBARI and Dayle Chayes of the Lamont-Doherty
Earth Observatory at Columbia University (Schmidt, Chayes et al. 2006). Processing the
data consisted of identifying and flagging noisy pings and bad data from the surveys
using the MBGridViz and MBEdit tools. Transit lines were also eliminated and dual 12
and 100 kHz tracks were decoupled and selectively deleted from gridding datalists based
on water-depth and data coverage criteria.

STRUCTURE ANALYSIS
Bathymetric data grids were created with MBSystem from edited processed multibeam
data at a resolution of 30m and imported into ArcGIS. The grids were generated as a
seris of spatially small grids due to file-size limitations. A global 30m resolution was
selected to allow ease of data manipulation over large areas whilst still retaining useful
detail. Additionally, at depths of 400+ meters, a 30m cell is close to error involved from
beam divergence. Reef morphology and terraces, shelf edges and patch reefs were
identified and traced using slope maps and hill-shade images created from the grids in
ArcMap. The 3D ArcScene function of the ArcGIS suite was also utilized to help
correlate the traced terraces around the islands and across the Complex. Identified
terraces, (Figure 1b, c), were used as the basis for resolving tipping conditions across the
Complex. The analysis involved picking three points from the same part of the same
terrace and using an extension within ArcView 3.2, written at MBARI by Gerry Hatcher,
to resolve tipping dip and dip orientation. These points were selected along the reef crests
at the seaward change in slope to maximize consistency.

                                             4
Figure 3 This is a 3D image from ArcScene, showing the exposure and extent of the interpreted reef
terraces around the southwestern edge of the Maui-Nui Complex. The coloured lines represent the
identified terraces shown in Figure 1. This data is displayed with a 10X vertical exaggeration.
RESULTS
TERRACE CORRELATION
Ten of the most continuous reef terraces were identified by their changes in slope at the
reef crest, and were labeled Reef Terraces 1-10 (Figure 1a & b), shallowest to deepest.
Time limitations of this internship program prevented full identification of all these
terraces around the Maui-Nui Complex, so focus was concentrated on the areas west and
south of Lanai, where greatest exposure of the terrace development was apparent. These
terraces are not traceable in all locations within the Complex, and were identified with
this numbering system from the greatest exposure of the entire suite, west of Lanai. A
profile was drawn at this location (Figure 1a) and the depths to the terraces along this
profile are used as identifying features (Figure 1b, Table 1).
TIPPING SCENARIOS
Initially large grids of central Maui-Nui Complex were tipped using the largest spread of
to indicate the overall attitude of the terraces. Table 1 shows the results of this large scale
approach. The defining characteristic of this data suite is that the angle of dip increases
with depth.
Terrace Depth Dip & Dip Direction Terrace Depth Dip & Dip Direction
T1 115m 0.0º > 083º T5 530m 0.6º > 087º
T2 320m 0.5º > 198º T6 640m 0.7º > 089º
T3 400m 0.6º > 084º T7 720m 0.7º > 099º
T4 450m 0.5º > 086º T8 860m 0.9º > 086º
Table 1 This table shows identified terraces, their depths and global tipping dip and dip orientation
determined by resolving terraces back to the horizontal plane in ArcView 3.2. These global measurements
were taken from the seaward change in slope along the reef crests to the south and west of Lanai (Figure 1).
A second tipping exercise was run on T2, T5 and T8 to assess the observation that the
angle of dip varied along the southwestern shelf edge (Figure 3). This second round was
5still conducted on the same large grid, however the sample area was reduced to
encapsulate the variation of dip, splitting the exercise into a northern series using a closer
spacing of the three anchor-points to the north of the profile line, and a southern series,
using closer spaced anchor-points to the south of the profile line. The results of the
second run are shown in Table 2.
Terrace Depth Northern Sector Dip & Terrace Depth Southern Sector Dip &
Dip Direction Dip Direction
T2 320m 0.4º > 203º T2 320m 0.0º > 063º
T5 530m 0.4º > 185º T5 530m 0.6º > 087º
T8 860m 0.5º > 141º T8 860m 0.3º > 064º
Table 2 This table shows the Northern and Southern Short-Tip exercises, with the two segments defined by
the location of the profile A-A' in Figure 2c.
The nature of the reef terrace traces along the exposed edges of the Complex primarily
allows only two dimensional small scale tipping scenarios. A third series of tipping
scenarios was run on the deeper reefs along the southern edge of this part of the complex
where the exposure exhibits the maximum angle of dip (Figure 3). Due to erosion scarps,
there are only three identifiable terraces along this edge, and these results are displayed in
Table 3.
Terrace Minimum Depth Maximum Depth Dip Dip Direction
T6 678m 1362m 0.8º 085º
T7 536m 1831m 1.0º 072º
T8 776m 1776m 1.2º 061º
Table 3 This table shows the southern edge of the study area, where there is broadly east west dip trend,
(Figure 3). Note that the magnitude of the dip angles along this axis are the largest exhibited so far, in the
general direction of the central loading point of Mauna Kea.
DISCUSSION
BARRIER ISLANDS
Bathymetric mapping and profiling around the Maui-Nui Complex revealed some
distinctive features. The pinnacle features of T5, T6 and T8 (Figure 4) are depth
correlated with the reef terraces landward of them. This type of feature is interpreted as
barrier coral reef, similar the shelf-edge reefs of the Great Barrier Reef (Webster and
Davies 2003). T8 also exhibits a headland feature connecting the barrier reefs to the
north with the coastline, forming an embayment. This headland connection appears to
have continued to the south also, but is now overlain by younger terraces. This type of
barrier feature is not found elsewhere within the main Hawaiian Islands.
6Figure 4 This figure is a slope map overlain by Haxby shaded bathymetry showing the terrace exposure to
the west of Lanai. A-A’ is the profile line from figure 1b. The dashed lines B and C show interpreted fault
planes.
It is proposed that these features evolved as a direct consequence of reef growth under the
41kyr sea-level oscillations prior to the MPT. Age data from the lava on Lanai put that
island at approximately 1.28 Million years old (Clague and Dalrymple 1989), and it
follows that the oldest (deepest) reefs formed immediately subsequent to this, in response
to the 41kyr oscillations. The shorter, lower-amplitude sea-level changes allowed the
terrace pinnacles to be re-occupied before subsiding out of reef-building depth, and in
this way, reef-growth occurred on the same terraces over progressive sea-level cycles.
This would effectively change a subsiding tectonic platform into a stable environment
with stacked reefs.
Variation in sea-floor topography could account for the stacked reefs building as
pinnacles instead of terrace-wide growth. Subsequent to the Mid-Pleistocene Transition,
the longer, larger-amplitude sea-level oscillations prevented this short-circuiting of the
subsiding coastline. In addition to being longer, each cycle is much larger amplitude,
with greater sea-level fluctuations. Abrupt sea-level rises move the platforms out of reef-
building depth (Webster, Clague et al. 2004), and so coral reef growth does not reoccupy
the same terraces or pinnacles. The evolution of terraces around Hawaii in the last half
million years has been under 100kyr climatic forcing, hence the lack of stacked reefs and
barrier reef systems formed around islands younger than the MPT.
7FAULT ZONES
Correlation of reef terraces was achieved through depth correlations and continuity
mapping. Given high rainfall and runoff from the tropical climate of the Hawaiian
Islands, erosion produces gaps in the continuity of terrace exposure, good examples are
revealed in the deep canyon system south of Kahoolawe and on the northern side of
Molokai (Figure 1a). Deep drainage channels are also in evidence to the northern end of
T7 and where the profile A-A’ was taken (Figure 3).
In two sections of terrace exposure west of Lanai, however, drainage channels and
erosion cannot account for gaps in terrace continuity. T10 and T6 are offset significantly
and correlation of these terraces was only possible through the use of the ArcScene 3D
imaging (Figure 3). Two fault zones have been interpreted in these locations to account
for this difficulty in correlation and have been labeled B and C in Figure 4. Fault B was
inferred from a breakdown in the correlation of T6. The 640m terrace (T6) exhibits the
similar pinnacle structures as T5 and T8; however the terrace also appears to extend out
seaward perpendicular to the coast in a straight line. Associated with this feature, is the
headland identified in T8, with these features suggesting a measure of fault control.
The feature identified as fault C (Figure 4) was interpreted from the large slip face
exposed in the terrace scarp of T9 and T10. This fault also appears to control the
drainage channel along which the profile line A-A’ (Figure 1) was mapped. This fault
scarp also appears to be the syncline of the fault tipping exhibited in the first round of
Short-Tip Scenarios (Table 2). The exposed terraces to the north are tipping generally
southerly, and to the south of this fault zone, these same terraces are tipping easterly.
EXTENDED TERRACE
An element of the Maui-Nui complex uncovered by this bathymetric mapping project is
the extended terrace south of Lanai and west of Kahoolawe (Figure 1). The existence of
this platform has been known for some time, however this mapping has revealed that it
has a raised edge, and it tips both to the northeast and southeast, (T8 in Table 2 and Table
3). I propose that this raised rim of T8 is caused by another volcano buried beneath the
carbonate reefs of this section of the Complex. A volcano here would provide a substrate
for fringing coral reef terraces development and reef growth could account for the raised
rim. This theory is supported by the existence of a small cone raised over the flat terrace,
visible in Figure 3.
CONCLUSIONS AND RECOMMENDATIONS
Further work on this mapping project should include tracing the terraces around the entire
complex including Oahu and down the Hana Ridge north of Hawaii. Short tips across the
entire Complex will allow the development off a full tectonic history, and an
understanding of the development of carbonate reef terraces. To test the theory proposed
with regard to a buried volcano south of Lanai, a Western Flyer cruise with Tiburon dives
on the small cone identified would provide data on this cone’s origin. Chirp lines across
this section of the Complex could also provide sub-bottom profiling to help test this
theory.
8ACKNOWLEDGEMENTS
David Caress and Jenny Paduan offered valuable assistance with the use of Unix and
MBSystem, and Hans Thomas and Mike McCann with use of MBSystem in a Windows
environment. Thanks to Jonathon Weiss from NOAA for the newly gridded bathymetric
data. This project was only made possible through the MBARI Internship program so a
special thanks to George Matsumoto for organizing this program, and to my JCU PhD
supervisor Jody Webster for his support. Special thanks also to my mentor David Clague
for his support and guidance, but most of all thanks and gratitude to Jenny Paduan for her
unending patience, friendship, and expertise in just about everything. I would also like to
thank Christina Tanner and Julie Himes for ferrying me around everywhere.
References:
Clague, D. A. and G. B. Dalrymple, Eds. (1989). Tectonics, Geochronology, and Origin of the Hawaiian-
Emperor Volcanic Chain. The Geology of North America. Boulder, Colorado, Geological Society of
America.
Davies, P. J. and D. W. Kinesy (1977). "Holocene reef growth - One Tree, Great Barrier." Marine Geology
24: M1-M11.
Galewsky, J., E. Silver, et al. (1996). "Foredeep tectonics and carbonate platform dynamics in the Huon
Gulf, Papua New Guinea." Geology 24:9: 819-822.
Ludwig, K. R., B. J. Szabo, et al. (1991). "Crustal subsidence rate off Hawaii determined from 234U/238U
ages of drowned coral reefs." Geology 19: 171-174.
Moore, J. G. (1987). Subsidence of the Hawaiian Ridge. Volcanism in Hawaii. R. W. Decker, Wright, T. L.
and Staufer, P. H. Washington DC, U.S. Geological Survey Professional Paper 1350: 85-100.
Moore, J. G. and J. F. Campbell (1987). "Age of Tilted Reefs, Hawaii." Journal of Geophysical Research
92:B3: 2641-2646.
Moore, J. G., B. L. Ingram, et al. (1996). "Coral ages and island subsidence, Hilo drill hole." Journal of
Geophysical Research 101:B5: 11599-11605.
Morgan, J. (1972). "Deep Mantle Convection Plumes and Plate Motions." AAPG Bulletin 56:2: 203-213.
Mullins, H. T., J. Dolan, et al. (1991). "Retreat of carbonate platforms: Response to tectonic processes."
Geology 19: 1089-1092.
Rubin, K. H., C. H. Fletcher, III, et al. (2000). "Fossiliferous Lana'i deposits formed by multiple events
rather than a single giant tsunami." Nature 408:6813: 675-681.
Schlager, W. (1981). "The paradox of drowned reefs and carbonate platforms." GSA Bulletin 92:4: 197-
211.
Schmidt, V., D. Chayes, et al. (2006). The MB-System Cookbook, Lamont-Doherty Earth Observatory.
Watts, A. B. and U. S. Ten Brink (1989). "Crustal Structure, Flexure and Subsidence History fo the
Hawaiian Islands." Journal of Geophysical Research 94:B8: 10,473-10,500.
9Webster, J. M., D. A. Clague, et al. (2006). "Support for the Giant Wave (Mega-Tsunami) Hypothesis:
evidence from submerged terraces off Lanai, Hawaii." International Journal of Earth Sciences DOI:
10.1007/s00531-006-0107-5: 8.
Webster, J. M., D. A. Clague, et al. (2006). "Drowned coralline algal dominated deposits off Lanai, Hawaii;
carbonate accretion and vertical tectonics over the last 30 ka." Marine Geology 225:1-4: 223.
Webster, J. M., D. A. Clague, et al. (2004). "Drowning of the -150m reef off Hawaii: A casualty of global
meltwater pulse 1A?" Geology 32:3: 249-252.
Webster, J. M. and P. J. Davies (2003). "Coral variation in two deep drill cores: significance for the
Pleistocene development of the Great Barrier Reef." Sedimentary Geology 159: 61-80.
Webster, J. M., L. Wallace, et al. (2004). "Drowned carbonate platforms in the Huon Gulf, Papua New
Guinea." Geochemistry Geophysics Geosystems 5:11: Q11008, doi:10.1029/2004GC000726.
Webster, J. M., L. Wallace, et al. (2004). "Coralgal composition of drowned carbonate platforms in the
Huon Gulf, Papua New Guinea; implications for lowstand reef development and drowning." Marine
Geology 204: 59-89.
Wessel, P. and B. H. Keating (1994). "Temporal variations of flexural deformation in Hawaii." Journal of
Geophysical Research 99:B2: 2747-2756.
Wilson, J. T. (1963). "A Possible Origin of the Hawaiian Islands." Canadian Journal of Physics 41: 863 -
870.
10You can also read