Finite element modeling of ASTM-G98 galling test - Numerical study of stress distributions in stainless steel specimens
←
→
Page content transcription
If your browser does not render page correctly, please read the page content below
Jurnal Tribologi 25 (2020) 102-118

Finite element modeling of ASTM-G98 galling test – Numerical
study of stress distributions in stainless steel specimens
Gérald Franz 1*, Kofi Edoh Agode 1, Stéphane Panier 1, Thibault Lesage 2

1 Université de Picardie Jules Verne, Laboratoire des Technologies Innovantes, EA3899, Avenue
des Facultés, Le Bailly, 80025 Amiens, FRANCE.
2 UTC, Laboratoire Roberval, UMR CNRS 7337, Centre de Recherche Royallieu, 60203

Compiègne, FRANCE.
*Corresponding author: Gerald.franz@u-picardie.fr

    KEYWORDS                                  ABSTRACT
                                              Galling, defined as a severe kind of adhesive wear
                                              encountered when friction occurs between two sliding
                                              surfaces under sufficient load, is a complex multiscale and
                                              multi-physics phenomenon still not thoroughly
                                              understood. Its initiation and propagation is impacted by
    Adhesive wear
                                              different factors related to microstructure, surface defects
    Austenitic steel
                                              or chemical composition. Currently, a normalized galling
    Finite element modeling
                                              test, denoted ASTM G-98, can be used to determine
    Galling
                                              experimentally a threshold galling stress of material
    Stress analysis
                                              couples. A three-dimensional finite element modeling,
                                              using ABAQUS, of this tribological test has been carried
                                              out in this work in order to investigate the mechanisms
                                              appearing during galling of 316L stainless steel in
                                              particular.

1.0     INTRODUCTION
    When two loaded mating surfaces slide with respect to each other, a form of surface damage,
caused by microscopic transfer of material between metallic surfaces usually called galling, can
be observed. It frequently occurs in high load and slow relative motion applications, but can
appear even at low stresses and high velocities. In the literature, other terms like adhesive wear,
scuffing, scoring or seizure can be previously found to describe damage similar to galling (Ives et
al., 1987; Peterson and Winer, 1989). However, unlike other forms of wear, galling can’t be
considered as a gradual process. It occurs suddenly and evolves quickly, altering the surface
integrity (material transfer, wear debris…) of the mechanical components, and consequently
degrading their tribological properties. The current definition of galling has been established in

Received 11 February 2020; received in revised form 19 March 2020; accepted 9 April 2020.
To cite this article: Franz et al. (2020). Finite element modeling of ASTM-G98 galling test – Numerical study of stress
distributions in stainless steel specimens. Jurnal Tribologi 25, pp.102-118.

                                             © 2020 Malaysian Tribology Society (MYTRIBOS). All rights reserved.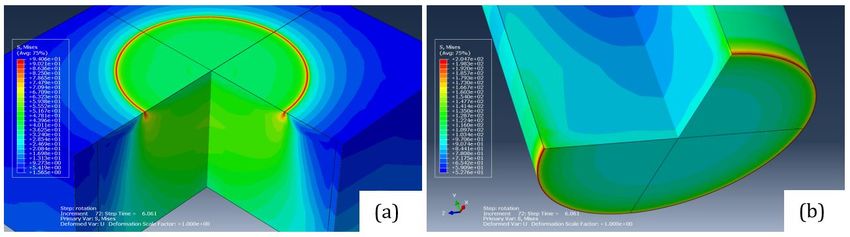
Jurnal Tribologi 25 (2020) 102-118

the ASTM G40 standard as “a form of surface damage arising between sliding solids, distinguished
by microscopic, usually localized, roughening and creation of protrusions (e.g. lumps) above the
original surface. It often includes plastic flow or material transfer or both.” (ASTM G40, 2008).
    Many industrial applications, including moving parts or contact surfaces, are confronted with
galling. Such a wear process can lead to disastrous consequences particularly in the agro-food,
chemical and pharmaceutical industries (e.g. deposition of metal particles with carcinogenic
elements (Cr, Ni…) on food or pharmaceutical products, atmospheric pollution by fine particles…),
where austenitic stainless steels are commonly chosen for their relative ease of manufacture, high
strength and stiffness, and excellent corrosion resistance. Unfortunately, these materials are also
known to be especially prone to galling (Magee, 1992).
    Laboratory tests, capable to give repeatable results, have been developed to evaluate the
galling resistance of various material couples and identify what mechanisms contribute to galling.
Many galling methods are described in the literature, depending on the type of contact zone (e.g.
point, line or surface) (Peterson et al., 1985; Swanson et al., 1988; Ives et al., 1989; Blau and
Budinski, 1999; Hummel, 2001; Podgornik et al., 2004). The choice of test device depends on the
objectives of the study. For example, the pin-on-flat test allows determining the effect of surface
topography (Peterson et al., 1985; Podgornik et al., 2020). Because of the orientation change of
the topography on the contacting surfaces during the button-on-block test, it is not possible to
evaluate the contribution of this parameter on galling mechanisms with this kind of experimental
configuration. We will only focus on the two commonly used standardized test procedures for
obtaining the relative ranking of galling resistance of material couples, i.e. ASTM G-98 (ASTM,
2002) and ASTM G-196 (ASTM, 2008). Numerous experimental results can be found in the
literature for a large range of material couples, and stainless steel in particular (Hummel and
Partlow, 2003; Hummel and Partlow, 2004; Harsha et al., 2016). In the button-on-block test
(ASTM G-98), a constant compressive load is maintained between two flat specimens. One
cylindrical specimen with a flat end, called the button (or pin), is slowly rotated for one revolution
on the other flat specimen held fixed, called the block. Galling is determined by unassisted visual
inspection. A new galling test method, developed by Hummel (Hummel, 2008), has recently been
adopted as a new standard for galling measurement and denoted ASTM G196-08. The test
configuration consists of two concentric hollow cylindrical specimens with the ends mated. The
resulting shape of the contact surface is an annulus. The upper specimen is loaded and rotated
about its axis and the bottom one is held fixed. According to ASTM G196-08, galling is a stochastic
phenomenon and no single threshold stress is able to characterize galling behaviour (Hummel
and Helm, 2009). The main weakness of these standard tests lies in the subjective determination
of threshold galling stress by visual examination, allowing distinguishing only two binary states,
i.e. “galled” or “not galled”. Recently, Budinski et al. have proposed a new rating system to
interpret the results of these two ASTM standard tests using visual as well as low-powered
binocular microscope examination. It is possible to rank galling tendencies numerically by
assigning intermediate number values to the galling steps (e.g. burnishing, scoring, adhesive
transfer…), from 0 when no galling to 10 for galling (Budinski and Budinski, 2015).
    The testing of material couples’ compatibility remains the commonly accepted way of handling
galling. That is due to the well-known visual evidence of galling that can be clearly identified,
according to the specifications given by ASTM standards (ASTM, 2002; ASTM, 2008), whereas the
mechanisms leading to the onset of galling are not yet commonly agreed upon. Moreover, for a
large part of works in the literature on the galling of stainless steels, conclusions relating on the
influence of different factors on the severity of galling are limited to qualitative observations of

                                                                                                 103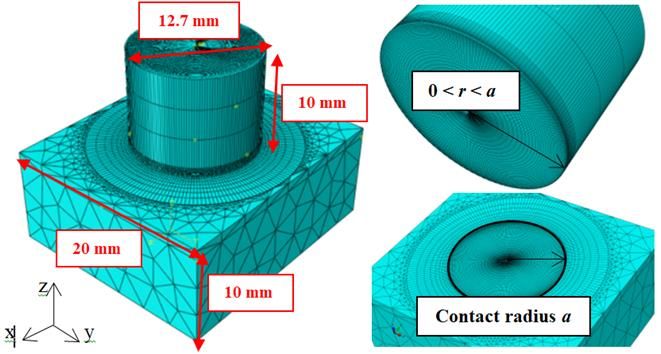
Jurnal Tribologi 25 (2020) 102-118

the phenomena (e.g. impact of the nature of the materials (Schumacher, 1973; Budinski, 1981),
effect of the nature of the microstructure (Heikkilä, 2003; Karlsson, et al., 2013) or the surface
roughness (Nosar and Olsson, 2013; Budinski et al., 2003), sensitivity to the type of surface
treatment (Schumacher, 1985; Taube, 1998; Clark, 2017), effect of the temperature (Harsha et al.,
2016b). Little explanation is provided on the correlations between the adhesive wear resistance
or galling threshold and the above-cited factors. Due to its multi-physics aspects (thermal,
chemical and mechanical) the wear process remains difficult to understand, as well as to simulate.
However, plasticity can be reasonably considered as the prominent mechanism contributing to
galling. Galling is defined as a severe kind of adhesive wear, appearing between sliding metal
contacts, which are rough and exhibit complex morphology. Consequently, the contact that occurs
between asperities and sliding surface deformations are related with important localized plastic
strains near contact spots. Budinski (Budinski, 1981) considered that galling resistance is related
to plasticity and noted that if tensile strength was about equal to yield strength, galling resistance
is deteriorated. Bhansali and Miller (Bhansali and Miller, 1982) have underlined the role of plastic
deformation, considering that severe asperity plastic strains occur and accumulate ahead of
moving asperities, leading to an increase of the true area of contact and asperity interlocking.
They also investigated the impact of stacking fault energy (SFE) on galling resistance and
remarked that materials with low SFE promoted galling resistance. They explained that if
asperities in contact fracture instead of deform, that involves less energy and leads to better
galling resistance. These conclusions are in agreement with the Schumacher’s works
(Schumacher, 1973; Schumacher, 1978) suggesting that SFE can be related to galling tendencies.
More recently, Budinski and Budinski (Budinski and Budinski, 2015) assumed that the main
material property that promotes galling is plastic deformation, considering that material must be
able to plastically deform to form a protrusion.
    In order to corroborate this assumption and to help understand galling mechanisms of
stainless steel pairs, a three-dimensional finite element modeling is used to simulate the ASTM G-
98 standard test. The distribution of the Von Mises and normal stresses along the radial distance
and the depth, for the button and the block, are plotted and analyzed for several levels of friction.
The numerical thickness of plastically affected regions is compared with experimental data.

2.0      GALLING RESISTANCE TEST – ASTM G98 BUTTON-ON-BLOCK TEST
   The experimental results that will be shown in Section 4.0 are issued from galling tests
performed at CETIM (Senlis, France) following the ASTM-G98 norm (Lesage, 2019). The testing
device, consisting of a standard tensile-compression machine, and specimens are illustrated
Figure 1. This galling test, which is a button-on-block test, is composed of two flat specimens
maintained in compression against each other while one of these specimens is rotated for only
one full revolution, performed in 6 seconds in a single step at constant speed. At the end of each
test, both specimens are visually inspected. In the case where the specimens appear undamaged,
the procedure is repeated with a higher load on untested specimens. Galling occurs if the
contacting surfaces exhibit torn metal. The threshold galling is determined as the average
between the highest non-galled test and the lowest galled test.

                                                                                                 104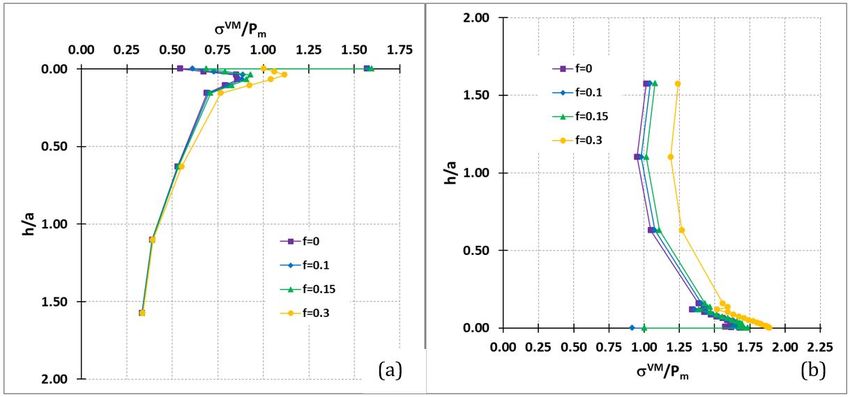
Jurnal Tribologi 25 (2020) 102-118
(a) (b)
Figure 1: (a) Testing device and (b) specimens’ illustration with main dimensions, in reversed
position (Hubert et al., 2014).
3.0 FINITE ELEMENT MODELING
In a button-on-block system, a cylindrical pin with a flat end is sliding against a flat block, as
described in the above section. The test is decomposed into an indentation step and a rotation
step. Numerical modeling of such tribological standard test has never been reported previously
in the literature. The galling simulation is performed with the commercial software ABAQUS, for
316L stainless steel pairs. The button and the block consist of the same elastic-plastic isotropic
material (316L) with strain hardening according to monotonic test data (see Figure 2). The value
of the Young modulus is 197 GPa and the Poisson ratio is 0.3. In this model, the temperature effect
due to plastic deformation and friction is neglected because the standardized galling test is
considered to be quasi-static due to its low rotation velocity (0.33 s-1).
Figure 2: Experimental strain/stress curve obtained after a monotonic test performed on 316L.
105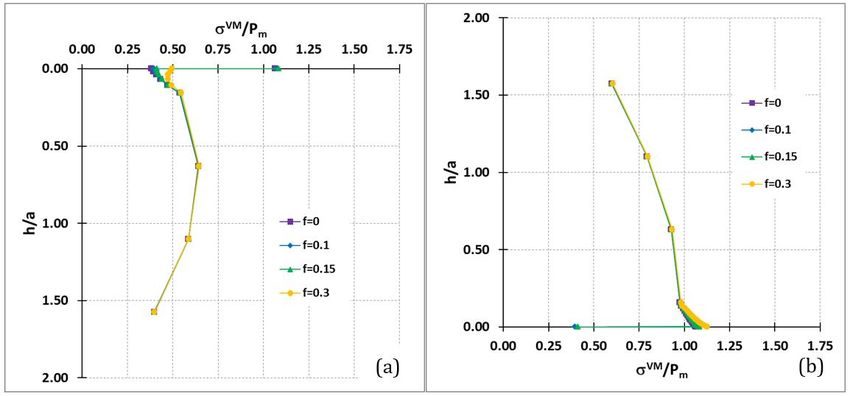
Jurnal Tribologi 25 (2020) 102-118
Since it is necessary to simulate the relative sliding motion between the pin and the block, the
“finite sliding” formulation, corresponding to one of the contact algorithm used in ABAQUS, is
chosen as allowing any arbitrary separation, rotation and sliding between the contacting surfaces.
Furthermore, “surface to surface” contact discretization is used because it is well-known this kind
of discretization improves the accuracy of contact stresses. The interactions between the button
and the block surfaces were defined using the default “master-slave” algorithm in ABAQUS, with
a hard contact pressure over-closure relationship. Since the button rotates on the block surface,
the button contact surface is set as the slave surface of the contact interaction. A mesh ratio
between the master and slave surfaces of one had been defined.
The main object of the numerical modeling is first to reproduce the real pressure between the
contacting surfaces and to determine the thickness of plastically affected regions. The pressure
distribution between the button and the block is affected by the choice of the friction formulation.
Friction modeling involves establishing a relationship between the tangential contact force and
the relative sliding speed. It is difficult to take into account the friction (adhesion-slip) because of
the very great diversity of the behaviors. Friction has been investigated for many years
(Amontons, 1699; Coulomb, 1785) but many friction mechanisms are still not well-understood.
As the frictional behavior between sliding surfaces occurs at the atomic level, friction is influenced
by the complex morphology of the contact surfaces. Dry friction is predominantly governed by
adhesion and ploughing of the asperities (Bowden and Tabor, 1971; Tabor, 1981). Environmental
conditions (e.g. load, velocity, temperature…) and material factors (e.g. surface roughness,
material properties…) have been found to affect the frictional behavior. Different constitutive
laws taking into account local and micromechanical phenomena within the contact interface have
been proposed (Oden and Pires, 1983; Oden and Pires, 1983b; Anand, 1993; Stupkiewicz and
Mroz, 1999) and an overview on numerical modeling has been given by Oden and Martins (Oden
and Martins, 1986). In the present work, the authors have focused on a simpler formulation of
frictional contact for dry friction. The most frequently used standard Coulomb friction model is
used, assuming that the friction force is proportional to the normal contact force. The coefficient
of proportionality, denoted f , is assumed to remain constant and is called coefficient of friction.
The contacting surfaces no longer stick to each other and the sliding between these surfaces
occurs if the equivalent shear stress is higher than the critical shear stress crit f P where P
represents the contact pressure. It is assumed here that the friction coefficient remains constant
because the galling test is considered as quasi-static and there is no effect of temperature.
However, it is known that this coefficient can be influenced by physical and geometrical
parameters. Many works can be found in the literature, where a variable friction coefficient is
introduced with the classical Coulomb law (Rabinowicz, 1958; Kragelski, 1965; Rice and Ruina,
1983).
The button and the block are directly modelled in 3D, in order to include the rotation step of
the galling test. The overall finite element mesh, developed after a mesh convergence study
described in Section 4 below, is given Figure 3. A finer mesh, composed of a total of 167 400
C3D8R elements, is used near the contact zone. The top of the block and the bottom of the button,
constituting the contact zone, are respectively meshed by a finest way along a height of 1 mm.
106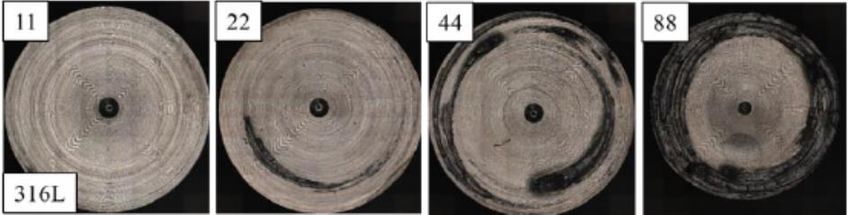
Jurnal Tribologi 25 (2020) 102-118
Figure 3: 3D mesh of the ASTM G-98 configuration.
4.0 RESULTS AND DISCUSSION
The contact zone mesh sizes are chosen in order to allow accurate reproduction of the contact
pressure distribution between the pin and the block. Numerical frictionless simulations have been
performed, for a range of mean pressure Pm between 12 MPa and 350 MPa, with different meshing
for an elastic cylindrical flat button loaded in compression on an elastic block. The validity of the
mesh is firstly checked by comparing the obtained results to the normalized contact pressure
distribution z (where z is the contact pressure, or normal stress) determined analytically
Pm
(Sneddon, 1946) as a function of the contact radius a and the radial distance r from the center of
the button (see Figure 3) by:
z a
, ra (1)
Pm 2 a2 r 2
For the selected meshing, shown in Figure 3, the comparison of the finite-element results with
the analytical ones for the variation of normalized contact pressure is plotted Figure 4. As shown
in this figure, the proposed 3D FE model is able to capture accurately the contact pressure
distribution between the contacting surfaces after the indentation step. Consequently, the overall
finite element mesh given Figure 3 is validated.
107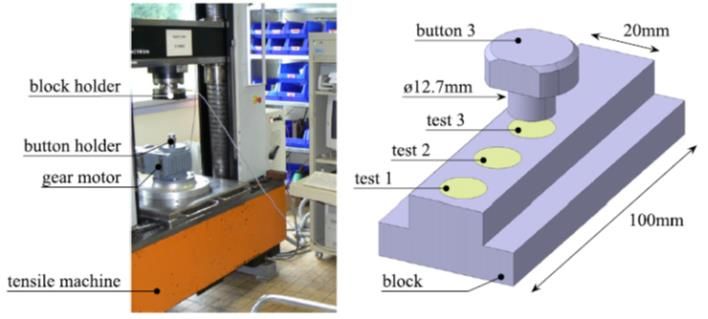
Jurnal Tribologi 25 (2020) 102-118
Figure 4: Normalized contact pressure distribution.
In order to validate the numerical model, numerical galling simulations have been performed
according to the experimental conditions of ASTM G-98 tests realized on 316L pairs, described in
Section 2.0. At the indentation step, the button is first loaded during one second with normal load
of 1 520 N, 2 787 N, 5 574 N or 11 148 N, corresponding to mean contact pressure of 12 MPa, 22
MPa, 44 MPa, and 88 MPa respectively. At the rotation step, the indentation force is maintained
and the button is rotated a total of 360 ° over a period of 6 seconds at constant velocity. The
obtained results are compared with experimental data, concerning the presence of galling and the
thickness of plastically affected regions. Different values of the coefficient of friction (f = 0; 0.1;
0.15 and 0.3) are tested in the numerical model in order to investigate the qualitative impact of
friction on Von Mises and normal stress distribution at the contact surface and within the depth
of the stainless block and button. The representation of the numerical results for the different
stresses (i.e. VM, z) and distances (i.e. r and h) will be normalized by the mean contact pressure
Pm and the contact radius a, respectively. h represents both the algebraic (unsigned) value of the
height of the button and the depth of the block. Its value equals zero at the contact surface. They
will be plotted at the end of the rotation step of the galling test.
Figures 5(a–d) show 316L steel button specimens from an ASTM-G98 test with different levels
of mean pressure. It can be observed that damage due to galling appears more significantly at 88
MPa along the perimeter of the button.
(a) (b) (c) (d)
Figure 5: 316L stainless steel button sample tested at (a) 11 MPa, (b) 22 MPa, (c) 44 MPa, (d) 88
MPa.
108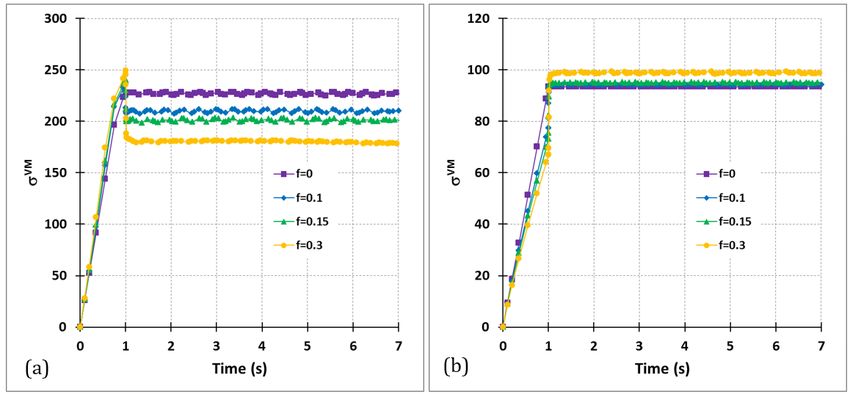
Jurnal Tribologi 25 (2020) 102-118

   The results obtained with the present FE model shows there is no plastic deformation for
simulations performed with a mean contact pressure of 12 MPa, 22MPa and 44 MPa while an
amount of plastic strain appears at the perimeter of the button for the value of 88 MPa. Figure
6(a) shows that the model only generates plastic strain at the outer edge of the button. So, it can
be assumed that plasticity contributes to galling. The width of the simulated plastic deformation
band, corresponding to the thickness of plastically affected region, cannot be compared with the
width of experimental galling zone at the end of the ASTM-G98 test because the model does not
take the evolution of wear into account. However, as depicted Figure 6(b), the model seems to be
able to determine a thickness of plastically affected region in agreement with the value of about
100 µm (h/a = 0.016) observed by EBSD at the deepest valley on the sample surface after
experimental galling test performed at 88 MPa. As suggested by Figure 6(b) and Figure 7,
increasing the coefficient of friction f tends to increase the amount of equivalent plastic strain at
the perimeter of the button, without changing the overall thickness of plastically affected region.

                        (a)                                                (b)
Figure 6: Equivalent plastic strain distribution for Pm = 88 MPa at the circumference of the button
(a) with f = 0.15, (b) along the height of the button for different values of friction coefficient.

    Figure 7 depicts the amount of equivalent plastic strain at the outer perimeter of the button
obtained by the model for different values of friction coefficient and mean contact pressure.
Numerical simulations are performed for two amounts of mean pressure where plasticity occurs.
It can be observed that the degree of plasticity increases with the amount of mean contact
pressure. For example, the value of equivalent plastic strain is multiplied by 5 for the frictionless
case and by about 9 for f = 0.3. Moreover, for a variation of the friction coefficient f between 0 and
0.3, the equivalent plastic strain increases by 150% for Pm = 88 MPa and its value is quadrupled
for Pm = 175 MPa. Experimentally, the severity of galling is enhanced when the compressive load
applied during the normalized test is raised.

                                                                                                 109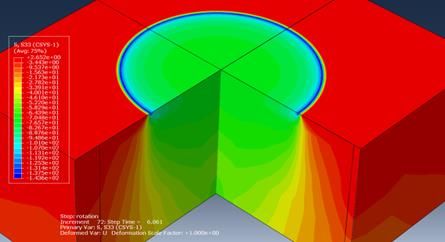
Jurnal Tribologi 25 (2020) 102-118

Figure 7: Equivalent plastic strain at the circumference of the button for different values of friction
coefficient and mean pressure.

    The location of galling at the perimeter of the contact surface can be explained by the sliding
distance and the stress magnitude. In the ASTM-G98 test, the sliding distance is proportional to
the radial distance from the center of the button. The greatest sliding distance corresponds to the
circumference of the button, where galling occurs. That is in agreement with the works of Jarrell
and Bejbl showing that the longer the sliding distance, the more frequently galling appears (Jarrell
and Bejbl, 1999).
    On the other hand, the stress distribution is not uniform due to the contact conditions of the
galling test. A concentration of stress is located at the perimeter of the button. Figure 8 depicts
the normal stress distribution in the block and the button at the end of the galling test, for a mean
contact pressure of 88 MPa and with a coefficient of friction equal to 0.15. The 3D FE model
simulates an axisymmetric distribution for the overall tested range of friction coefficient, i.e. from
0 to 0.3. This distribution remains identical from the beginning of the rotation step. For this
reason, it is possible to plot the normal stress distribution along the radial distance at the contact
surface, at the end of the galling test, as shown in Figure 9. We can observe that the model is able
to correctly reproduce the stress concentration along the perimeter of the contact surface. For a
variation of the friction coefficient f between 0 and 0.3, the evolution of the normal stress as a
function of the radial distance remains the same. However, we can notice that higher values of f
lead to lower absolute values of normal stress near the circumference. The value of the simulated
stress concentration is between about two and three times the value of mean contact pressure.

 (a)                                                   (b)`
Figure 8: Normal stress distribution for Pm = 88 MPa and f = 0.15 (a) in the block, (b) in the button.

                                                                                                  110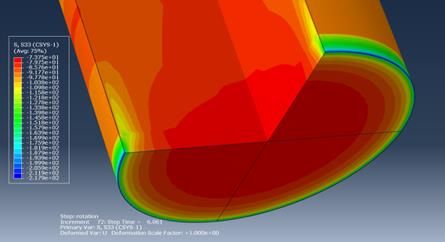
Jurnal Tribologi 25 (2020) 102-118

Figure 9: Normal stress distribution for different values of friction coefficient and Pm = 88 MPa at
the contact surface.

    Then, we were interested in the evolution of the normal stress in the thickness at the center of
the surface contact and at the vicinity of its perimeter, where galling occurs. The distribution of
this stress is plotted in the block, as shown in Figures 10(a) and 11(a), and in the button, as
depicted in Figures 10(b) and 11(b). The evolution of the normal stress along the thickness of the
block and the button is not influenced by the value of the friction coefficient. It can be noticed that
the variation of the normal stress inside the block and the button is observed only where the
contact pressure is concentrated (Figure 9): the normal stress decreases significantly at the
perimeter of the surface contact, inside the block and the button, and remains relatively constant
at their center. The normal stress increases significantly for 0 < h/a < 0.02, corresponding to the
plastically affected zone determined on Figure 6(b), and reaches a maximum at the outer edge,
near the bottom of the button, as depicted in Figure 10(b). It can also be noticed that the
compressive normal stress at depths greater than the contact radius (h/a > 1) approaches the
mean pressure in the button specimen (see Figure 10(b)) but decreases to less than half of the
mean pressure in the block specimen (see Figure 10 (a)).

                          (a)                                          (b)
Figure 10: Normal stress distribution for different values of friction coefficient and Pm = 88 MPa
at the circumference of the surface contact along (a) the depth of the block, (b) the height of the
button.

                                                                                                  111
Jurnal Tribologi 25 (2020) 102-118
(a) (b)
Figure 11: Normal stress distribution for different values of friction coefficient and Pm = 88 MPa
at the center of the surface contact along (a) the depth of the block, (b) the height of the button.
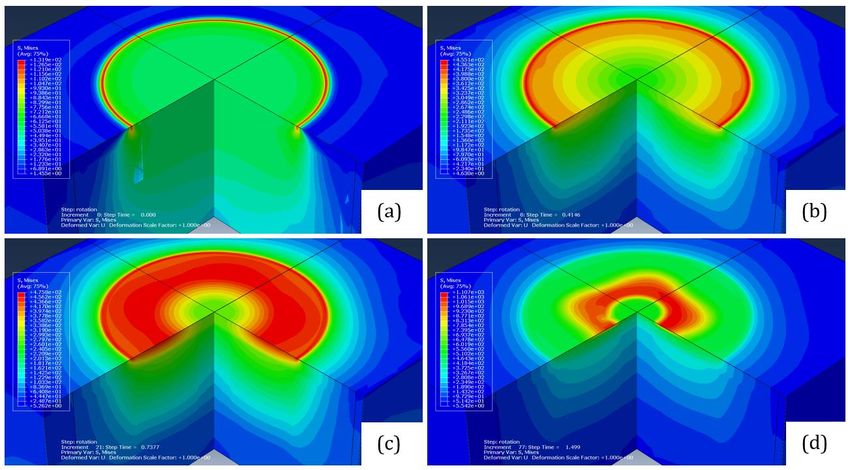
Figure 12 represents the Von Mises stress distribution on the block and the button at the end
of the galling test, for a mean contact pressure of 88 MPa and with a coefficient of friction equal to
0.15. As observed for the normal stress distribution, the Von Mises stress distribution calculated
by the 3D FE model is axisymmetric for the range of friction coefficient, i.e. from 0 to 0.3. That’s
why we can plot the Von Mises stress distribution along the radial distance at the contact surface,
as shown in Figure 14. It should be noted that, unlike the numerical results obtained for friction
coefficients lower than 0.15, the stress distribution does not remain identical during the overall
rotation step of the galling test for f = 0.3, as illustrated in Figures 13(a–d). Figure 14 reflects the
stress concentration at the perimeter of the contact surface. The friction effect on the evolution of
the Von Mises stress along the radial distance seems negligible for values lower than 0.15, because
the curves plotted for f varying between 0 and 0.15 are superimposed. For f = 0.3, the shape of the
Von Mises stress evolution along the radial distance is similar to the others, but the curve is shifted
up. So the Von Mises stress values increase compared to the results obtained for the friction
coefficient between 0 and 0.15.
Figure 12: Von Mises stress distribution for Pm = 88 MPa and f = 0.15 (a) in the block, (b) in the
button.
112Jurnal Tribologi 25 (2020) 102-118
Figure 13: Von Mises stress distribution for Pm = 88 MPa and f = 0.3 in the block at different
amounts of rotation (a) =0°, (b) =20°, (c) =45°, (d) =90°.
Figure 14: Von Mises stress distribution for different values of friction coefficient and Pm = 88 MPa
at the contact surface.
The distribution of the Von Mises stress is also plotted in the thickness at the center of the
surface contact and at the nearness of its perimeter, in the block and in the button, as depicted
Figures 15 and 16. Unlike the normal stress distribution that remains identical as friction varies,
the Von Mises stress distribution is impacted by the value of the friction coefficient, particularly
at the circumference of the contact surface. The Von Mises stress values increase as friction
increases. That is probably due to the presence of higher shear stress at the circumference
compared to the center of the contact surface due to the rotation of the button.
113Jurnal Tribologi 25 (2020) 102-118
Figure 15: Von Mises stress distribution for different values of friction coefficient and Pm = 88 MPa
for a point at the circumference of the surface contact along (a) the depth of the block, (b) the
height of the button.
Figure 16: Von Mises stress distribution for different values of friction coefficient and Pm = 88 MPa
for a point at the center of the surface contact along (a) the depth of the block, (b) the height of
the button.
The evolution of the Von Mises stress obtained by the FE model during the overall galling test,
for different friction coefficient values, is plotted at the perimeter (see Figure 17(a)) and at the
center (see Figure 17(b)) of the contact surface. In order to improve the readability of Figure
17(b), the chosen ordinate scale is different from the one of Figure 17(a). It can be noticed that
the value of Von Mises stress is between two and three times higher at the circumference than at
114Jurnal Tribologi 25 (2020) 102-118
the center. For frictionless simulation (f = 0), the Von Mises stress reaches a value at the end of
the indentation step and remains at the same level during the rotation step, at the center and at
the perimeter of the contact surface. That can be explained by the absence of frictional shear stress
when the button rotates without friction. The introduction of friction in the simulations leads to
a modification of the Von Mises stress evolution during the galling test. In this case, the rotation
of the button produces a sudden raise of the frictional shear stress and decrease of the normal
stress at the perimeter of the contact surface. It results in a drop of the Von Mises stress at the
onset of the rotation step, as illustrated in Figure 17(a). The Von Mises stress calculated at the
circumference of the contact surface at the end of the galling test decreases by about 20% when
the friction coefficient varies from 0 and 0.3. Once the frictional shear stress reaches a limit, then
the normal stress stays at a constant value. At the center of the contact surface, Figure 17(b)
reveals that taking into account the friction causes a jump of the Von Mises after the end of the
indentation step, due to an increase of the tangential and radial components of the stress due to
the rotation. Figure 17 also shows that the higher the friction coefficient value, the larger the drop
or the jump for the Von Mises stress during rotation. The Von Mises stress calculated at the center
of the contact surface at the end of the galling test increases by about 6% when the friction
coefficient varies from 0 and 0.3.
Figure 17: Von Mises stress evolution during the test for different values of friction coefficient and
Pm = 88 MPa at (a) the circumference, (b) the center of the contact surface.
5.0 CONCLUSION
Quasi-static and sliding dry friction are frictional mechanisms studied for several decades but
remain an open field of research due to the difficulty to correctly identify the contribution of
numerous factors on the initiation and development of wear. The onset and propagation of galling
is not thoroughly understood. A three-dimensional finite element modeling of the ASTM-G98
galling test is purposed in order to investigate the mechanisms appearing during galling of 316L
stainless steel. Numerical modeling of this standard test has never been done in the literature.
115Jurnal Tribologi 25 (2020) 102-118
(a) The numerical results, compared with experimental ones for ASTM G-98 tests realized on
316L pairs, show that plasticity can reasonably be considered as the prominent
mechanism contributing to galling. Indeed, significant galling is observed experimentally
for the value of mean contact pressure Pm = 88 MPa, where plastic deformation appears
numerically. No plastic deformation is found for simulations performed with a mean
contact pressure of 12 MPa, 22 MPa and 44 MPa.
(b) The model shows that plastic strain develops only at the outer edge of the button, for Pm
> 88 MPa, where galling is located experimentally. That confirms the role of plasticity in
galling occurrence. The amount of equivalent plastic strain p obtained by the model
increases with the amount of mean contact pressure. For example, for the numerical
simulation with a friction coefficient f = 0.15, the model gave p = 1.1e-3 for Pm = 88 MPa
and p = 5.17e-3 for Pm = 175 MPa, corresponding to a multiplication by about 5 of the
severity of the plasticity. That can be correlated with the experimental observation
showing that the severity of galling is enhanced quickly when the mean contact pressure
is higher.
(c) The plastically affected region is determined numerically for galling test performed at 88
MPa with various amounts of friction. This thickness is found to be unaffected by
increasing the friction coefficient. It remains about 100 µm, corresponding to the value
determined after experimental galling test performed at 88 MPa.
(d) The non-uniform stress distribution, especially its concentration at the perimeter of the
contact surface, calculated by the model can explain the location of galling at the
circumference of the button during the ASTM-G98 test. The contact pressure calculated
by the model varies between 85% and 100% of the mean contact pressure on 75% of the
contact surface radius. The value of the simulated stress concentration at the perimeter
is between about two and three times the value of mean contact pressure.
(e) The evolution of the normal stress along the thickness at the center and at the
circumference of the block and the button is not influenced by the value of the friction
coefficient. The normal stress increases significantly in the width of the plastically
affected zone and reaches a maximum at the outer edge, near the bottom of the button.
The results of simulations of the overall galling test with friction, obtained by the present FE
model, show that the rotation of the button produces an increase of the frictional shear stress and
a decrease of the normal stress at the circumference of the contact surface, leading to a decrease
of the Von Mises stress compared to the level obtained at the end of the indentation step. This
decrease is impacted by the choice of the friction coefficient value.
REFERENCES
Amontons, G. (1699). On the resistance originating in machines (in French). Mémoires de
l’Académie Royale, 206–222.
Anand, L. A. (1993). Constitutive model for interface friction. Computational Mechanics, 12, 197–
213.
ASTM G40, Terms and Definitions Relating to Wear and Erosion. (2008). ASTM International,
West Conshohocken PA.
Bhansali, K. J., & Miller, A. E. (1982). The role of stacking fault energy on galling and wear behavior.
Wear, 75, 241–252.
116Jurnal Tribologi 25 (2020) 102-118
Blau, P. J., & Budinski, K. G. (1999). Development and use of ASTM standards for wear testing.
Wear, 225–229, 1159–1170.
Bowden, F. P., & Tabor, D. (1971). Friction and Lubrication of Solids. Oxford University Press.
Budinski, K. G. (1981). Incipient galling of metals. Wear, 74, 93–105.
Budinski, K. G., & Budinski, S. T. (2015). Interpretation of galling tests. Wear, 332–333, 1185–1192.
Budinski, K. G., Budinski, M. K., & Kohler, M. S. (2003). A galling-resistant substitute for silicon
nickel, Wear, 255, 489–497.
Clark, K. P. (2017). The effects of low temperature carbon diffusion treated fasteners on thread
galling resistance. In ASME 2017 Pressure Vessels and Piping Conference. American Society of
Mechanical Engineers Digital Collection.
Coulomb, C. A. (1785). The theory of simple machines (in French). Mémoires de Mathématique et
de Physique de l'Académie Royale des Sciences, 10, 161–331.
Harsha, A. P., Limaye, P. K., Tyagi, R., & Gupta A. (2016). Development of tribological test
equipment and measurement of galling resistance of various grades of stainless steel, Journal
of Tribology, 138(2).
Harsha, A. P., Limaye, P. K., Tyagi, R., & Gupta, A. (2016). Effect of temperature on galling behavior
of SS 316, 316L and 416 under self-mated Condition. Journal of Materials Engineering and
Performance, 25(11), 4980–4987.
Heikkilä, I. (2003). Influence of tool steel microstructure on galling resistance against stainless
steel. Tribology Series, 43, 641–649.
Hubert, C., Marteau, J., Deltombe, R., Chen, Y. M., & Bigerelle, M. (2014). Roughness
characterization of the galling of metals. Surface Topography: Metrology Properties, 2.
Hummel, S. R. (2001). New test method and apparatus for measuring galling resistance. Tribology
International, 34, 593–597.
Hummel, S. R. (2008). Development of a galling resistance test method with a uniform stress
distribution. Tribology International, 41, 175–180.
Hummel, S. R., & Helm, J. (2009). Galling50, a stochastic measure of galling resistance. Journal of
Tribology, 131, 034502-1–034503-3.
Hummel, S. R., & Partlow, B. (2003). Threshold galling load and frictional behavior of stainless
steel couples in line contact. Wear, 255, 504–508.
Hummel, S. R., & Partlow, B. (2004). Comparison of threshold galling results from two testing
methods. Tribology International, 37, 291–295.
Ives, L. K., Peterson, M. B., & Bansali, K. J. (1987). A literature review of the galling process.
Merchant H. D. E., Bansali K. J., Eds. Metal Transfer and Galling in Metallic Systems, The
Metallurgical Society: Warrendale P A, 1–27.
Ives, L. K., Peterson, M. B., & Whitenton, E. P. (1989). The mechanism, measurement, and influence
of properties on the galling of metals. NISTIR 89-4064.
Jarrell, J. D., & Bejbl, F. (1999). Medical Device and Diagnostics Industry 50–57.
Karlsson, P., Krakhmalev, P., Gaard, A., & Bergsrom, J. (2013). Influence of work material proof
stress and tool steel microstructure on galling initiation and critical contact pressure.
Tribology International, 60, 104–110.
Kragelski, I. V. (1965). Friction and wear. London. Butterworths.
Lesage, T. (2019). Grippage des aciers inoxydables: influence de la nature des matériaux, de la
microstructure et des traitements thermochimiques de surface (Doctoral dissertation,
Compiègne).
117Jurnal Tribologi 25 (2020) 102-118
Nosar, N. S., & Olsson, M. (2013). Influence of tool steel surface topography on adhesion and
material transfer in stainless steel/tool steel sliding contact. Wear, 303, 30–39.
Oden, J. T., & Martins, J. A. C. (1986). Models and computational methods for dynamic friction
phenomena. Computer Methods in Applied Mechanics and Engineering, 52, 527–634.
Oden, J. T., & Pires, E. B. (1983). Algorithms and numerical results for finite element
approximations of contact problems with non-classical friction laws. Computers and
Structures, 19, 137–147.
Oden, J. T, & Pires, E. B. (1983). Nonlocal and nonlinear friction laws and variational principles for
contact problems in elasticity. Journal of Applied Mechanics, 50, 67–76.
Peterson, M. B., Bhansali, K. J., Whitenton, E. P., & Ives, L. K. (1985). Galling wear of metals.
International Conference on Wear of Materials, Vancouver, Canada, pp. 293–301.
Peterson, M.B., & Winer, W. (1989). Wear Control Handbook. ASME: New York.
Magee, J. H. (1992). ASM handbook, friction, lubrication and wear technology. vol. 18. ASM
International.
Podgornik, B., Hogmark, S., & Pezdirnik, J. (2004). Comparison between different test methods for
evaluation of galling properties of surface engineered tool surfaces. Wear, 257, 843–851.
Podgornik, B., Kafexhiu, F., Nevosad, A., & Badisch, E. (2020). Influence of surface roughness and
phosphate coating on galling resistance of medium-grade carbon steel. Wear, 446–447.
Rabinowicz, E. (1958). The intrinsic variables affecting the stick-slip process. Proceedings of the
Royal Society, 71, 668–675.
Rice, J. R., & Ruina, A. L. (1983). Stability of steady frictional slipping. Journal of Applied Mechanics,
50, 343–349.
Schumacher, W. J. (1973). New galling data aid in selecting stainless steel. Material Engineering,
4, 61–63.
Schumacher, W. J. (1978). Adhesive wear of engineering alloys. Met. Prog., 32–36.
Schumacher, W. J. (1985). Nitrogen strengthened austenitic stainless steel for improved corrosive
wear resistance, new development in stainless steel technology. American Society for Metals
Conference Proceedings, 107–116.
Sneddon, I. N. (1946). Boussinesq’s problem for a flat-ended cylinder. Proceedings of the
Cambridge Philosophical Society 42.
Standard test method for galling resistance of materials, G98-02. ASTM Annual book of standards,
Vol.03.02, 2002.
Standard test method for galling resistance of material couples, G196-08. ASTM Annual book of
standards, Vol.03.02, 2008.
Stupkiewicz, S., & Mroz, Z. (1999). A model of third body abrasive friction and wear in hot metal
forming. Wear, 231, 124–138.
Swanson, P. A., Ives, L. K., Whitenton, E. P., & Peterson, M. B. (1988). A study of the galling of two
steels using two test methods. Wear, 122, 207–223.
Tabor, D. (1981). Friction – The present state of our understanding. Journal of Lubrification
Technology, 103, 169–179.
Taube K. (1998). Carbon-based coatings for dry sheet-metal working. Surface and Coatings
Technology, 98, 976–984.
118You can also read