THE AFFECT OF VISUAL ACUITY ON DRIVING ABILITY - A SIMULATOR STUDY - VTI PM 2021:8 - DIVA PORTAL
←
→
Page content transcription
If your browser does not render page correctly, please read the page content below
The affect of visual acuity
         on driving ability
               A simulator study

                  Helena Selander
                 Birgitta Thorslund
                    Per Henriksson

                                           VTI PM 2021:8
                                         Published 2021
                                      vti.se/publications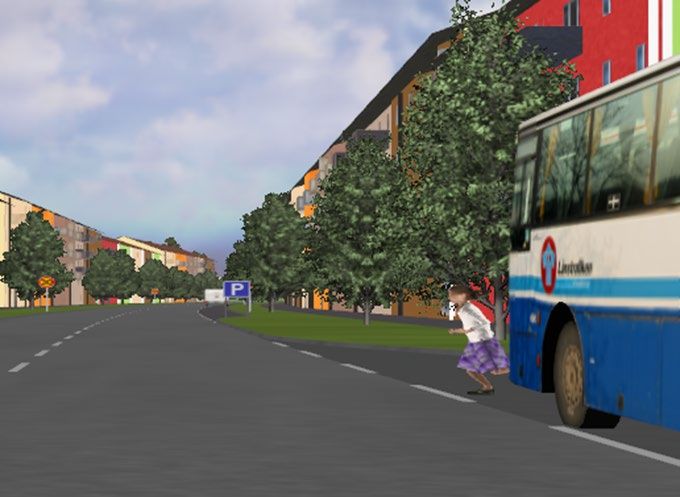
VTI PM 2021:8

The affect of visual acuity on driving ability
                              A simulator study

                                     Helena Selander

                                    Birgitta Thorslund

                                      Per Henriksson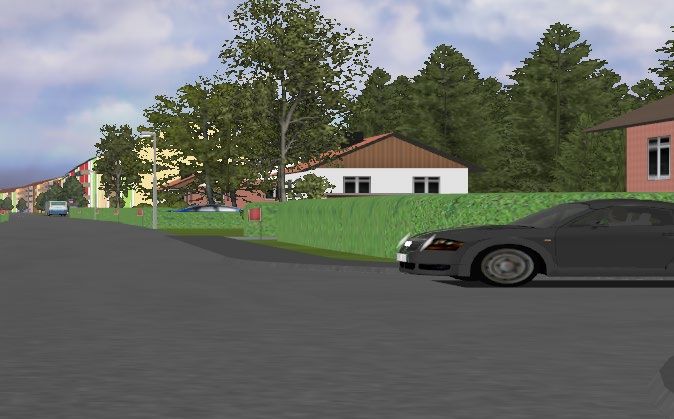
Authors: Helena Selander (VTI), Birgitta Thorslund (VTI), Per Henriksson (VTI)
Reg. No., VTI: 2019/0248-8.2
Publication: VTI PM 2021:8
Published by VTI, 2021
Kort sammanfattning
Flera synförmågor tenderar att försämras med ökad ålder. Trots detta kontrolleras synförmågan i
Sverige endast i samband med ansökan om körkortstillstånd. Denna studie genomfördes med syftet att
undersöka synens påverkan på körfömåga, oavsett ålder. Totalt deltog 89 personer (36 män) i åldrarna
18–77 år i studien. Deltagarna var uppdelade i fem grupper: två yngre grupper med godkänd (≥ 0,5)
respektive nedsatt syn (nedsatt till minst 0,4), två äldregrupper med godkänd (≥ 0,5) respektive nedsatt
syn (nedsatt till minst 0,4) samt en grupp personer med ögonsjukdom (glaukom, katarakt och AMD).
Med tanke på att tidigare forskning har visat att det behövs fler syntester än enbart synskärpa (visus)
för att bedöma bilkörning kompletterades visus med kontrastseende och testet Useful Field of View
(UFOV) samt simulatorkörning. Datainsamlingen, i en körsimulator från VTI, genomfördes av
studenter på Optikerprogrammet vid Karolinska Institutet i Stockholm. Körsimulatorn var en stationär
simulator utan rörelseplattform som var utrustad med automatlåda och tre skärmar. Inga skillnader
mellan grupperna framkom när det gäller antal krockar, men däremot fanns signifikanta skillnader vid
flera händelser under simulatorkörningen. För de två yngre grupperna fanns skillnader för totalt 5 av
12 händelser. De med nedsatt synskärpa såg fotgängare eller fordon senare än de med bättre
synskärpa. Detta resulterade i ett riskfyllt körbeteende eftersom de reagerade för objektet, det vill säga
bromsade eller stannade, senare eller hade högre hastighet än vad som var lämpligt. För de äldre
framkom skillnader mellan grupperna i 3 av 12 händelser. De äldre förarna med god syn upptäckte
fordonet och fotgängarna tidigare, vilket betyder att de uppvisade en bättre reaktionsförmåga och
därmed ett säkrare körbeteende. Studien visade således att körsimulator är ett användbart verktyg för
att bedöma körförmåga och att synfunktioner spelar en viktig roll för säker bilkörning. Dock behöver
detta studeras ytterligare för att öka förståelsen för exakt vilken grad av nedsättning kopplat till varje
typ av synförmåga som försämrar körbeteendet och leder till minskad trafiksäkerhet.

Nyckelord
Körförmåga, synskärpa, trafiksäkerhet

VTI PM 2021:8                                                                                            5
Abstract
As we age, visual abilities tend to worsen. Despite this, in Sweden vision is only checked when
applying for a drivers’ licence. This study was performed to investigate the impact of vision on driving
ability, regardless of age. Eighty-nine people (36 men) between the ages of 17 and 77 participated in
the study. Participants were divided into five groups: two younger groups with good (≥ 0.5) and
impaired visual acuity (impaired to at least 0.4), two older groups with good (≥ 0.5) and impaired
visual acuity (impaired to at least 0.4), as well as a group with people with eye disease (glaucoma,
cataracts and AMD). Considering that previous research has shown that there is a need for more vision
tests than just visual acuity (visus) to determine driving ability, contrast vision, the Useful Field of
View (UFOV) test and simulator driving were also used in this study. Data collection, in a driving
simulator from VFI was performed by optometry students from the Karolinska Institute in Stockholm.
The driving simulator was a stationary simulator with an automatic gearbox and three screens, but no
moving platform. There were no differences between groups when it came to collisions, but there were
several significant differences during different events while participants were using the simulator. For
the two younger groups, there was a difference in 5 out of 12 events. Pedestrians and other vehicles
were seen later by those with an impaired visual acuity compared to those with good visual acuity.
This resulted in risky driving behaviour because they reacted to the object, either braked or stopped,
later or had a higher speed than was appropriate. For the older groups, there are differences between 3
out of 12 events. The older drivers with good visual acuity saw the vehicle and pedestrian sooner,
which meant that they were able to react better and drive more safely. The study showed that a driving
simulator is a useable tool to determine driving ability and that visual ability plays an important role in
safe driving. However, this does need to be studied further to increase our understanding of exactly the
degree of impairment associated with each type of visual impairment that impairs driving behaviour
and leads to reduced road safety.

Keywords
Driving ability, visual acuity, traffic safety

6                                                                                         VTI PM 2021:8
Preface
The National Society for Road Safety (NTF in Swedish) has commissioned this simulator study to
investigate whether visual acuity has an affect on the ability to drive safely. Data collection was
performed with the help of optometry students and their supervisor Marika Wahlberg Ramsay from
the Karolinska Institute, and we would like to thank them for their help. Data analysis, collation and
writing was performed by the researchers, Helena Selander, Per Henriksson and Birgitta Thorslund at
The Swedish National Road and Transport Research Institute (VTI). Help with the simulator and
adjustments to the program were provided by Andreas Jansson at VTI. Translation of this report to
English was performed by Kate Bramley-Moore.
We would also like to thank all of the participants who have contributed to the data collection.
Gothenburg, January 2020.

Helena Selander
Project leader

Granskare/Examiner
Björn Lidestam, VTI.
De slutsatser och rekommendationer som uttrycks är författarens/författarnas egna och speglar inte
nödvändigtvis myndigheten VTI:s uppfattning./The conclusions and recommendations in the report
are those of the author(s) and do not necessarily reflect the views of VTI as a government agency.

VTI PM 2021:8                                                                                            7
Contents
Kort sammanfattning .............................................................................................................................5
Abstract ...................................................................................................................................................6
Preface .....................................................................................................................................................7
1. Introduction .......................................................................................................................................9
2. Methods ............................................................................................................................................11
2.1. Data collection and participants .................................................................................................11
2.2. The simulator .............................................................................................................................11
3. Results ..............................................................................................................................................13
3.1. Background data, sight status and summarised simulator performance ....................................13
3.2. Driving in the simulator .............................................................................................................15
3.2.1. Event 1. Pedestrian approaches from the right .....................................................................15
3.2.2. Event 2: A parked green car merges .....................................................................................17
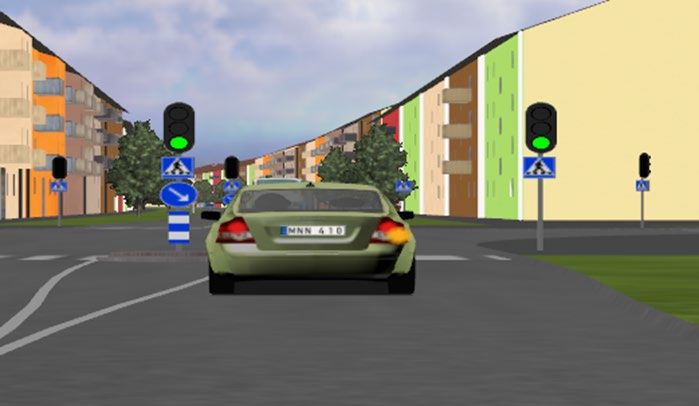
3.2.3. Event 3: Traffic light controlled intersection ........................................................................18
3.2.4. Event 4: Pedestrian appears from the left at a pedestrian crossing .......................................20
3.2.5. Event 5: Green car at an intersection ....................................................................................21
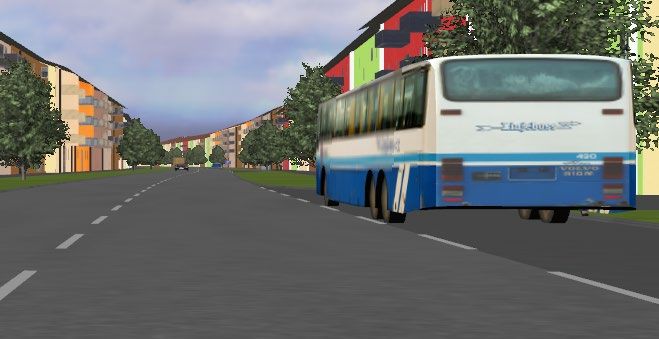
3.2.6. Event 6: A parked bus after an intersection ..........................................................................22
3.2.7. Event 7: Pedestrians approaching from both right and left ...................................................23
3.2.8. Event 8: Pedestrian on the right hand side of a crossing ......................................................25
3.2.9. Event 9: A girl runs out from in front of a parked bus..........................................................26
3.2.10. Event 10: Car reversing in a residential area ........................................................................27
3.2.11. Event 11: Car approaching from the right at an intersection in a residential area ................29
3.2.12. Event 12: Parked bus ............................................................................................................30
4. Discussion .........................................................................................................................................32
References .............................................................................................................................................33
8 VTI PM 2021:8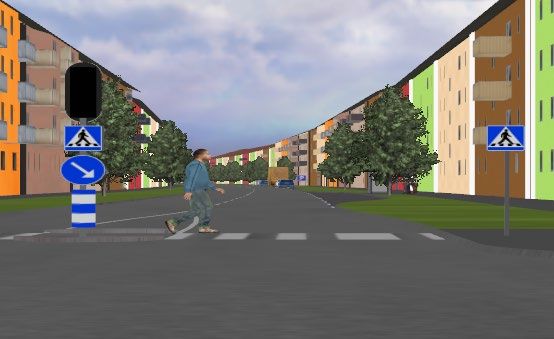
1.        Introduction
Several visual abilities tend to worsen with increasing age, such as visual acuity, contrast vision, the
ability to change between different distance viewing and the ability for pupil’s to change according to
light conditions. Despite this, in Sweden vision is only checked when applying for a drivers’ licence.
The required binocular visual acuity for passenger vehicle drivers has been set at least 0.5 (central,
with/out corrective lenses) since 1984 (1). For those who drive for a living (group 2 licences), the
binocular (both eyes together) visual acuity requirement is 0.8, and every five years the professional
driver is required to have both a doctor’s and vision test certificate (1). Before 1984, the visual acuity
requirement was higher for passenger vehicle drivers, but was changed because it was determined that
“passenger vehicle drivers can decide for themselves if driving a car is appropriate or not” (2).
In contrast to some other countries within the EU, Swedish doctors are required to report drivers with
insufficient vision to the Transport Agency (Transportstyrelsen). If visual acuity for passenger vehicle
drivers is below 0.3 and the worsening of vision has happened suddenly, a 6 month adjustment period
is required before the licence can be renewed (1). This is due to the need for the driver to adjust and
become familiar with different ways of assessing distance and depth.
For a passenger vehicle licence, vision testing is performed by a doctor, optometrist, eye nurse,
orthoptist etc. In order to measure visual acuity a 4 or 5 meter eye chart should be used. All of the
optotypes (letters) should be able to be read without error. For group 2 licences the eye test can only
be performed by a doctor and visual acuity should be at least 0.8 in the best eye and a minimum of 0.1
i the worse eye with the best correction. There is an exception for taxi driver registrations, which can
be given even if the worse eye’s visual acuity is lower than 0.1, as long as the binocular visual acuity
is at least 0.8 (and the other visual requirements are met) (1).
It’s common that visual acuity begins to worsen between the ages of 40 and 50, and is compensated
with the use of glasses or contact lenses. With increasing age the need for light increases and there is a
reduced adjustment ability, which can be relevant when driving in the dark or when driving in and out
of a tunnel during the darker hours of the day. In contrast to other countries in both the Nordic region
and the EU, Sweden doesn’t require assessment to ensure that passenger car drivers have sufficient
vision after a certain age (3). Drivers with low visual acuity can therefore continue to drive as long as
they don’t seek healthcare (3). Opinions surrounding Sweden’s visual acuity requirement levels and
aged based health checks have been discussed and recently a study was performed, looking at the
connection between being involved in an accident and ‘traffic dangerous’ illnesses amongst older
drivers (4). The report included different diagnoses from the Traffic Agency’s regulations and general
advice about medical requirements for possession of a driver’s licence (TSFS 2010: 125). According
to the report, drivers with illnesses common amongst the elderly, such as cardiovascular illness, and
reduced visual function had an increased likelihood of being in an accident, compared to drivers with a
diagnosis (4). Individuals with a reduced visual function had had some kind of contact with the
healthcare system (not primary care) because of an eye disease or other diagnosis that had affected
their vision were included in the study. Excluded from the study were individuals who had ‘only’
reduced visual acuity or reduced contrast vision because of their age.
Winter in Sweden is long, and it can be difficult for all of us to drive during the long dark months. The
ability to see contrast reduces as we age. Contrast vision is important to be able to see and recognise
small details and is important for safe driving, because it requires a person to be able to see objects
both when it is dark as well as light (5).
For example, a curb can appear diffuse and difficult to see for someone with reduced contrast
sensitivity (see Image 1 below). However, people with reduced contrast sensitivity can still have good
visual acuity. Some age related illnesses, such as cataracts, primarily affect contrast sensitivity. People
who have reduced contrast sensitivity can have difficulty in several different daily activities, such as
reading and driving (6). In studies that have specifically investigated driving, contrast sensitivity

VTI PM 2021:8                                                                                             9
impairment has been shown to result in a reduced capacity to recognise road signs and dangers in
traffic (7), manoeuvring (8), and driving in the dark (9,10).

Image 1. Photo from www.medicinskoptik.se/.
Vision, cognition and motor skills are all important components in safe driving and vision and
attention are significant factor in good driving ability (11). However there has yet to be found an
unambiguous connection between vision and traffic safety (12,13). The way in which Sweden
measures visual acuity has been criticised as it is done statically and not dynamically. The reason that
vision is not reassessed as being sufficient after someone has a driver’s licence is most likely one of
monetary but also time cost, or for safety’s sake (eg driving tests). Using a simulator has been
discussed as a tool to assess the importance of vision in safe driving. Simulator programs contain
specific variables that pose a risk when driving, such as a child or an elk running out into the road. A
driving simulator is a safe alternative to driving assessment performed on roads, which minimises the
risks and makes it possible to assess reproducible driving conditions (13). In summary, our aim with
this study was to investigate, using a driving simulator, if vision affects safe driving ability. If a driver
with reduced visual acuity (0.5).

10                                                                                          VTI PM 2021:8
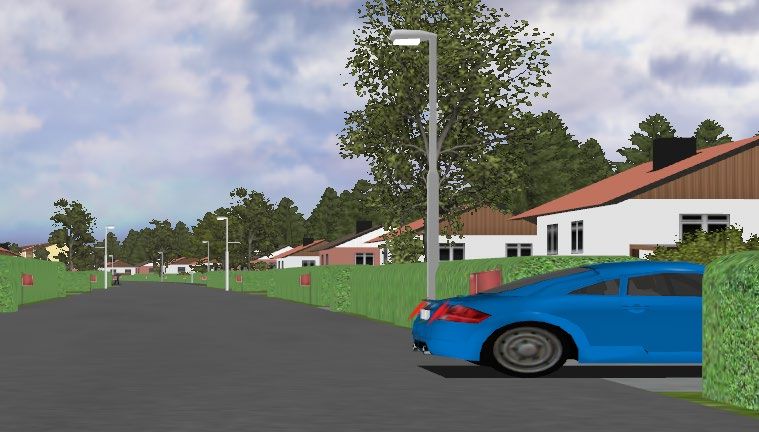
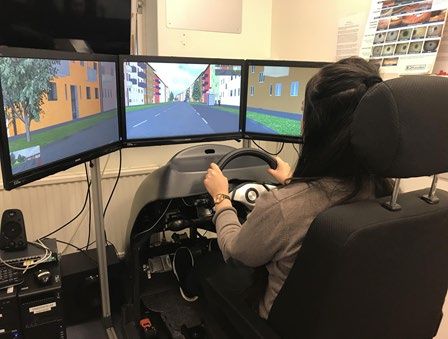
2.       Methods

2.1.      Data collection and participants
Data collection was performed by students from the optometry programme at the Karolinska Institute
in Stockholm. Participants were recruited using the students’ network, NFT’s network, and advertising
at St Göran’s Eye Clinic. Participants received both verbal and written information about the study,
and that their participation would not affect their licence status. Eighty nine people (36 men) between
the ages of 18 and 77 participated in the study and all of them had a valid driver’s licence. Before
testing began participants answered a few questions about their driving habits.
Considering that previous research has shown that more than just visual acuity tests are required to
assess driving (14), visual acuity testing was complemented with a test to look at contrast vision, the
test Useful Field of View (UFOV), as well as driving in the simulator. UFOV is a data based visual
and cognitive test that measures visual processing speed (part 1), divided attention (part 2) and
selective attention (part 3) (15). The result for each part is presented in the form of milliseconds (ms)
and can vary between 13-1500 ms (a lower value means a better result). A UFOV result generates an
estimated risk (risk category 1-6), which establishes what the risk is that a driver may cause a collision
(for example, risk category 1 = a very low risk). The test has repeatedly shown to be correlated with
driving and demonstrated good validity and reliability (15,16). Visual acuity was measured
monocularly (one eye at a time) as well as binocularly (both eyes together) on a LogMar chart with
high contrast and also with low contrast, 10%. All measurements were performed in the same light
conditions in the same room for all participants. A binoncular sight test (Titmus) was performed to
ensure that participants could see with both eyes simultaneously. For the tests performed, all
participants used their own corrective lenses for distance. Once vision had been tested, half of each
group had their binocular visual acuity reduced by fogging to 0.4. This was to ensure that participants
were not able to see better than 0.5 binocularly. The reduction was achieved by adding plus lenses
while participants were looking at a sight chart until the desired reduction was achieved. This was
done at a measured distance to each test respectively; UFOV, 60cm and 100cm for the driving
simulator.

2.2.      The simulator
The driving simulator was a stationary simulator without a moving platform and was fitted with an
automatic gearbox and three screens (see Image 2 below). The program had been developed for a
previous vision project (17) and began with a practice section of around 5 minutes so that participants
could familiarise themselves with the simulator. After this the ‘test driving’ began (approximately 15
mins), which consisted of a driving scenario in which there were close to 20 or more or less critical
situations, such as vehicles or pedestrians which suddenly drove/walked out in front of the driver. The
situations were evaluated with a selection of measurements such as collisions, position, distance, speed
and reaction time.

VTI PM 2021:8                                                                                          11
Image 3. The simulator used in the project.

12                                            VTI PM 2021:8
3.         Results
Participants were divided into five groups: two younger groups with good (≥ 0.5) and impaired
(reduced to at least 0.4) visual acuity, two older groups with good (≥ 0.5) and impaired (reduced to at
least 0.4) visual acuity, as well as a group of people who had eye disease (glaucoma, cataracts and
AMD). The first four groups consisted of 20 people, and the final group, with eye disease, consisted of
9 people (Table 1). The two younger groups were compared separately (t-test or Chi2-test), and the
older groups, as well as the group with eye disease, were compared with each other (ANOVA and
Tukey’s post hoc test). Significance was set at 5%.

3.1.       Background data, sight status and summarised simulator
           performance
In the table presented below, background data, results of the vision tests and a few general
measurements of behaviour during the simulation. Two older people were forced to stop the
simulation because of nausea (simulator sickness).

Table 1. Gender distribution, age, visual performance and summarised measurements from the
simulated driving. *One person in each age group stopped because of simulator sickness and no result
from the simulated driving was registered. ** Two people didn’t answer this question.

                                                      Young,         Young,      Older,       Older,           Participants
                                                      good           impaired    good         impaired         with eye
                                                      vision         vision      vision       vision           disease(s)

  Number of people                                             20          20        20*                 20*              9

  Percentage women, %                                          85          60         45                 50              56

  Age, mean                                                    25          26         68                 68              67

  Age range                                               19–30         18–34      60–76           60–77             62–72

  Average number of years holding licence                       5           6         49             47**                46

  Binocular visus                                          1,71           1,67      1,30             1,26              0,66

  Binocular low contrast visus                             1,13           1,18      0,91             0,78              0,43

  UFOV 1, ms                                               13,8           14,8      15,8             24,5              21,2

  UFOV 2, ms                                               19,8           19,1      61,5             65,0              48,3

  UFOV 3, ms                                               46,3           65,0     135,9            176,9             143,8

  UFOV risk 1, number of people                                20          20         14                 15               7

  UFOV risk 2, number of people                                 0           0             6               3               2

  UFOV risk 3, number of people                                 0           0             0               2               0

  Average number of side line crossings                        1,1         1,7       1,5                 1,3            2,6

  Average number of collisions with another vehicle            0,2         0,2       0,3                 0,4            0,0

  Average number of collisions with pedestrians                0,4         0,5       0,3                 0,6            0,7

  Average number of exceeding the speed limit                  3,8         4,2       3,7                 4,1            3,9

The values measured for visus (visual acuity) and low contrast visus were not different within age
groups, but there were significant differences between age groups. The group with eye disease were
significantly different to all other groups. Older participants with reduced vision had a longer UFOV-1
result than both the younger groups and the older group with good vision. The performance of the

VTI PM 2021:8                                                                                                           13
participants with eye disease was at the same level as the older participants with reduced vision, but there were no significant differences when compared to the other groups. The results for UFOV-2 were about three times longer for the older versus the younger groups. There were no significant differences for UFOV-2 within the groups, younger groups compared with each other and older groups compared with each other. UFOV-2 was not significantly different when comparing the participants with eye disease to the other groups. Both the older groups and the eye disease group had significantly longer UFOV-3 times than the younger participants, but the differences between the older groups and the eye disease groups were not significantly different from one another. There was not a significant difference in the UFOV-3 result between the younger groups when compared to one another. The participants with a higher UFOV risk than 1 were in the older age group and amongst those with eye disease. There were no signifiant differences between groups with regards to the number of “side line crossings” (ie when the driver drove over the middle line in the road or the line at the edge of the road), collisions with vehicles or pedestrians as well as the incidence of speeding. The younger participants droves less frequently than the older groups, see Figure 1. Figure 1. How often participants drove. And finally participants were able to describe how well they thought they saw driving in daylight and in the dark. Only one person, who had eye disease, said that their sight was not satisfactory driving in daylight. With regards to driving in the dark, mostly those with eye disease, but even the older groups were not satisfied with their sight in dark conditions, see Figure 2. 14 VTI PM 2021:8
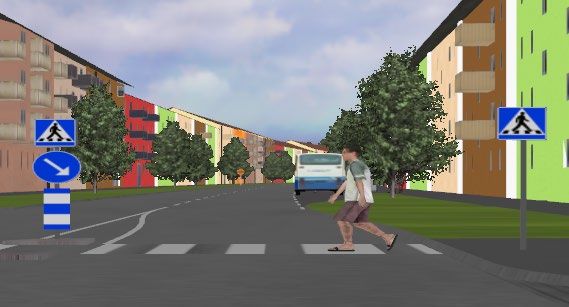
Figure 2. Answer distribution for the question “How is your vision when driving in the dark?”.

3.2.      Driving in the simulator
The scenario in the simulator included a number of events and behaviour during these events has been
analysed in this section. The measurements that were compared between groups were: distance, TTC
(Time To Collision), reaction time, reaction distance, speed, if the brake was pressed and if way was
given to pedestrians. All these measurements have not been relevant in all situations. TTC means the
time it takes until the driver crashes into an object (car or pedestrian) if they continue in the same
direction at the same speed.
Before analysis of the simulator data, values that were as a result of participants reacting in a way that
doesn’t give useable data were excluded. For example, if the driver has let a pedestrian pass at a
crossing before values were able to be registered. For several events, the dropout rate becomes large
due to this and these events are excluded. Thus, 12 events remain in this report.

3.2.1.    Event 1. Pedestrian approaches from the right

VTI PM 2021:8                                                                                           15
Young people with good vision reacted at a significantly greater distance from the pedestrian than
young people with impaired vision. Those with the impaired vision were closer to the pedestrian
before they reacted, see Figure 3. There were no significant differences for the other measurements.

Figure 3. Driving behaviour in the situation “Pedestrian approaches from the right” in the two
younger groups (*= p < 0,05; t-test).
The two older groups and the group with eye disease performed at around the same level in this event,
there were no significant differences, see Figure 4.

Figure 4. Driving behaviour in the situation “Pedestrian approaches from the right” in the two older
groups and the group with eye disease.

16                                                                                     VTI PM 2021:8
3.2.2.   Event 2: A parked green car merges

When the parked car began to merge, young people with good vision had a TTC that was a second
longer than the young people with impaired vision, which means that those with good vision reacted
significantly earlier, see Figure 5. There was no significant difference for the other measurements, but
data from half of the cases is missing regarding reaction time because the drivers did not react.

Figure 5. Driving behaviour in the situation “A green car merges” in the two younger groups (*= p <
0,05; t-test).
Both TTC and speed were significantly different in the three other groups. Older people with good
vision noticed the vehicle sooner, which means that they had a better reaction capacity and safer
driving behaviour, as made evident by their lower speed in this event, see Figure 6.

VTI PM 2021:8                                                                                         17
Figure 6. Driving behaviour in the situation “A green car merges” in the two older groups plus the
group with eye disease (*= p < 0,05; ANOVA).

3.2.3.   Event 3: Traffic light controlled intersection

In this situation, the speed that drivers used and whether they braked or not was investigated. The
average speed did not differ between the younger groups, nor between the other three groups (see
Figure 7).

18                                                                                      VTI PM 2021:8
Figure 7. Average speed at the intersection with traffic lights.

Braking behaviour was not significantly different between the two younger groups, nor between the
three other groups, see Figure 8.

Figure 8. Proportion that braked in the crossing with traffic lights.

VTI PM 2021:8                                                                                       19
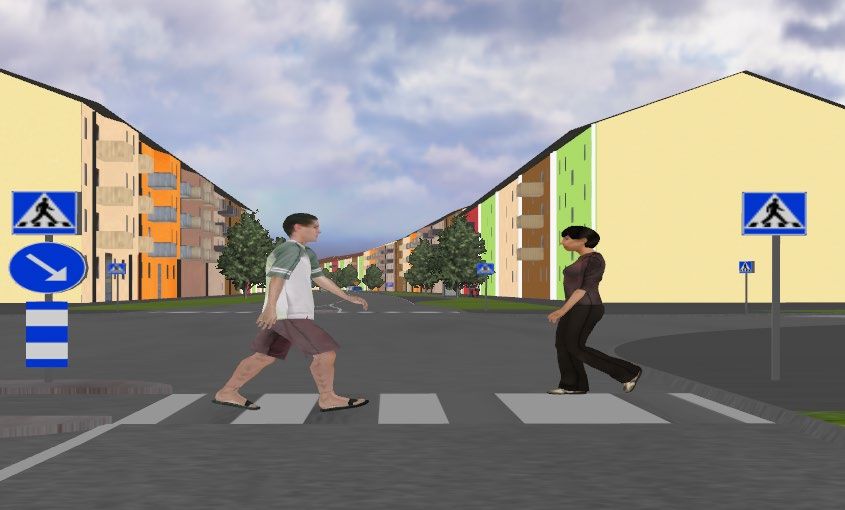
3.2.4.   Event 4: Pedestrian appears from the left at a pedestrian crossing

There was no significant difference in behaviour between the younger groups in this situation.
Distance, TTC and speed were about the same, see Figure 9. All of the younger people gave way to
the pedestrian.

Figure 9. Driving behaviour when a pedestrian crosses at a traffic light regulated crossing, younger
groups.
With regards to the three other groups, TTC was significantly different, see Figure 10. Further testing
showed that the two older groups were the ones who had significantly different TTC values. The older
participants saw the pedestrian ands topped, but the older participants with good vision reacted earlier.
All participants in these three groups gave way to the pedestrian.

20                                                                                       VTI PM 2021:8
Figure 10. Driving behaviour when a pedestrian crosses at a traffic light regulated crossing, the two
older groups and the group with eye disease (*= p < 0,05; ANOVA).

3.2.5.   Event 5: Green car at an intersection

The distance between the driver and the car in front was the only comparison made in this situation,
see Figure 11. The two younger groups kept pretty much the same distance, whereas the older groups
and the group with eye disease left more room between them and the car in front, but there were no
significant differences between the five groups.

VTI PM 2021:8                                                                                       21
Figure 11. Average distance to a green car that is stationary at an intersection, all groups.

3.2.6.    Event 6: A parked bus after an intersection

It was only relevant to investigate speed in this situation, see Figure 12.

22                                                                                       VTI PM 2021:8
Figure 12. Average speed when passing a bus which is parked after an intersection, all groups.
The two younger groups had very similar behaviour here too. There were no significant differences in
speed between any of the groups.

3.2.7.   Event 7: Pedestrians approaching from both right and left

Young participants with good vision kept a greater distance to pedestrians and therefore TTC was also
longer, see Figure 13. This means that they reacted earlier and had a safer driving behaviour. These
differences were significant, but average speed was more or less the same. Both groups gave way to
pedestrians at the same rate, that is to say 75% of drivers.

VTI PM 2021:8                                                                                      23
Figure 13. Driving behaviour when two pedestrians stand at a crossing on each side of the road, the
two younger groups (*= p < 0,05; t-test).
The only significant difference for the three other groups was the distance. Older participants with
good vision reacted earlier, see Figure 14. Further analysis demonstrated that it was the group with eye
disease that were different from the two older groups.

Figure 14. Driving behaviour when two pedestrians stand at a crossing on each side of the road, the
two older groups and the group with eye disease (*= p < 0,05; ANOVA).
The participants with eye disease tended to give way more often to pedestrians (78% of drivers)
compared with the two older groups (42% each), it was not a significant difference however.

24                                                                                      VTI PM 2021:8
3.2.8.   Event 8: Pedestrian on the right hand side of a crossing

Seven participants did not give way to the pedestrian, but went past the pedestrian a little to the side
(whether participants collided with the pedestrian is not ascertainable from the available data). This
happened for one person in each of the younger groups, two people in the older group with good
vision, and three people in the older group with impaired vision. The average speed for these seven
people was over 45km/h. All participants with eye disease gave way to the pedestrian. The following
figures are based on the participants who gave way see Figure 15.

Figure 15. Driving behaviour when pedestrian stands on the right side at a crossing, the two younger
groups, way was given to pedestrians.

No significant differences were detected between the two younger groups or between the three other
groups, see Figure 16.

VTI PM 2021:8                                                                                          25
Figure 16. Driving behaviour when a pedestrian stands on the right hand side of a crossing, the two
older groups and the group with eye disease, way was given to the pedestrian.

3.2.9.   Event 9: A girl runs out from in front of a parked bus

Over 40%, 36 out of 87 participants, did not brake in the situation when a girl ran out from in front of
a bus at a busstop. Young participants with good vision braked most often (70%) and the participants
with eye disease braked almost as often (67%). Young participants with impaired vision braked about
half of the time (55%) and the two older groups braked a little less often than that (53%).
The following Figure 17 show the TTC value for the participants who braked. There were no
significant differences between groups.

26                                                                                       VTI PM 2021:8
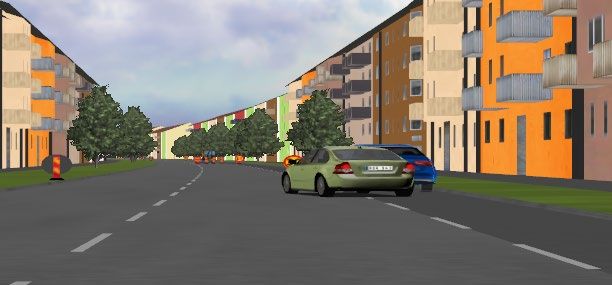
Figure 17. Average TTC when a girl stands by a bus, all groups.

3.2.10. Event 10: Car reversing in a residential area

There were no significant differences between the two younger groups with regards to the proportion
that braked when the car was backing out of a driveway. TTC and reaction distance are reported in
Figure 18.

Figure 18. Driving behaviour when a car reverses in a residential area, the two younger groups.
Nor could any significant differences be noted with regards to reaction times, see Figure 19.

VTI PM 2021:8                                                                                     27
Figure 19. Reaction time when a car reverses in a residential area, all groups.
No significant differences could be seen between the two older groups and the group with eye disease
either with regards to the proportion that braked in the situation, TTC and reaction distance, see Figure
20.

Figure 20. Driving behaviour when a car reverses in a residential area, the two older groups plus the
group with eye disease.

28                                                                                       VTI PM 2021:8
3.2.11. Event 11: Car approaching from the right at an intersection in a residential
        area

Younger participants with impaired vision drove at a significantly higher speed than those with good
vision which resulted in a shorter distance and TTC, see Figure 21. The younger participants with
impaired vision reacted when they were much closer to the vehicle.

Figure 21. Driving behaviour when a car approaches from the right in a residential area, the two
younger groups(*= p < 0,05; t-test).
No significant differences were found between the three other groups in this situation, see Figure 22.

VTI PM 2021:8                                                                                        29
Figure 22. Driving behaviour when a car approaches from the right in a residential area, the two older groups plus the group with eye disease. 3.2.12. Event 12: Parked bus The speed at which participants passed the bus was investigated in this situation, see Figure 23. Young participants with impaired vision drove significantly faster than young participants with good vision. The differences between the three other groups were not significant. 30 VTI PM 2021:8
Figure 23. Average speed when passing a parked bus, all groups.

VTI PM 2021:8                                                     31
4.        Discussion
Because it is common that vision deteriorates as we age (and as a result of eye disease/s), many studies
around vision and driving suitability has focused on adults ≥ 50 years old (13). This study was
performed with the aim of investigating the impact of visual acuity on driving ability, regardless of
age. The results showed that there were no differences in the number of collisions between the groups,
but that there were significant differences between them during other events that occurred during
simulated driving. There were significant differences in 5 of 12 events for the two younger groups.
Those who had impaired vision saw pedestrians or vehicles later than those with better vision. This
resulted in risky driving behaviour because they reacted to the object (braking or stopping) later or
were driving faster than was appropriate. There were significant differences in 3 of 12 events for the
older participant groups. The older drivers with good vision were able to see vehicles and pedestrians
sooner, which means that they had a greater reaction ability and consequently had safer driving
behaviour.
Because it has been said that there isn’t sufficient scientific evidence that visual acuity has an impact
on safe driving ability, the results were quite surprising. A criticism that could be made against the
study is that the participants who had impaired vision were given that impairment right before the
testing began, and were therefore unused to this sudden impairment in their vision. An other
alternative that was discussed before the study began was to find people with a driver’s licence that
already were visually impaired (that can’t be corrected), but this is more or less impossible. The group
with people with eye disease had fewer participants than the other two groups. This was because it was
difficult to recruit people with eye disease who also had a driver’s licence. Despite the fact that
participating in the study would not affect their ability to retain their licence, there were several people
who were not brave enough to participate.
A Swedish winter means a long and dark period of time that can be demanding to drive in, with
variations in road condition, precipitation and light conditions. The frequency of accidents is higher
when driving in the dark, a situation that requires contrast sensitivity, adaptation, glare resistance and
recovery after glare. All people see worse in twilight and darkness, but older drivers see even worse
and therefore often avoid driving in the dark (18). We were unfortunately not able to test driving in the
dark in this project. The light conditions in the driving simulator were good and the driving scenarios
were not adapted to be able to test drivers in twilight and the dark. Despite this there were still several
negative driving behaviours or risk behaviours that are not compatible with safe driving. It might be
considered obvious that people with better visual acuity are more easily able to see details in a
simulator program. But driving with impaired vision should also result in difficulties in real traffic
situations. Impaired vision is even worse during the dark part of the day, despite street lighting or
headlights. All in all, impaired vision should probably affect driving even in real traffic, through,
among other things, impaired supervision of fellow road users and delayed ability to react, which
increases the risk of traffic accidents.
This study showed that a driving simulator is a useful tool to be able to assess driving ability and that
visual ability plays an important role in safe driving. However, this needs to be studied further to
increase our understanding of exactly the degree of impairment associated with each type of visual
impairment that impairs driving behaviour and leads to reduced road safety.

32                                                                                         VTI PM 2021:8
References
1. Transportstyrelsen. Transportstyrelsens författningssamling TSFS 2013:22013.
2. Andréasson R. Människan och trafiken : ett bidrag till trafikmedicinens historia: Stockholm :
Fischer; 1994.
3. Bro T, Lindblom B. Strain out a gnat and swallow a camel? – vision and driving in the Nordic
countries. Acta Ophthalmologica. 2018;96(6):623-30.
4. Transportstyrelsen. Samband mellan sjukdomar och äldre bilförares inblandning i trafikolyckor.
TSV 2018-4875; 2018.
5. Bal T, Coeckelbergh T, Van Looveren J, Rozema JJ, Tassignon M-J. Influence of Cataract
Morphology on Straylight and Contrast Sensitivity and Its Relevance to Fitness to Drive.
Ophthalmologica. 2011;225(2):105-11.
6. Owsley C, Stalvey B, Wells J, Sloane ME. Older Drivers and Cataract: Driving Habits and Crash
Risk. Journals of Gerontology Series A: Biomedical Sciences and Medical Sciences.
1999;54(4):M203-M11.
7. Wood JM, Stalvey B, Wells J, Sloane ME. Standard measures of visual acuity do not predict
drivers’ recognition performance under day or night conditions. Optometry and vision science.
2005;82(8):698-705.
8. Bowers A, Peli E, Elgin J, McGwin G, Owsley C. On-Road Driving with Moderate Visual Field
Loss. Optometry and Vision Science. 2005;82(8):657-67.
9. Freeman EE, Muños B, Turano K, West SK. Measures of visual function and their association with
driving modification in older adults. Investigative Ophthalmology & Visual Science. 2006;47(2):514-
20.
10. Puell MC, Palomo C, Sánchez-Ramos C, Villena C. Mesopic contrast sensitivity in the presence of
glare in a large driver population. Graefe’s Arch Clin Exp Ophthalmol. 2004;242:755-61.
11. Negishi K, Masui S, Mimura M, Fujita Y, Tsubota K, Antal A. Relationship between Functional
Visual Acuity and Useful Field of View in Elderly Drivers. PLoS ONE. 2016;11(1).
12. Charman WN. Vision and driving--a literature review and commentary. Ophthalmic &
physiological optics : the journal of the British College of Ophthalmic Opticians (Optometrists).
1997;17(5):371.
13. Owsley C, McGwin G, Jr. Vision and driving. Vision Res. 2010;50(23):2348-61.
14. Thorslund B, Strand N. Vision measurability and its impact on safe driving: a literature review.
Scandinavian Journal of Optometry and Visual Science. 2016;9(1):1-9.
15. Edwards JD, Vance DE, Wadley VG, Cissell GM, Roenker DL, Ball KK. Reliability and validity
of useful field of view test scores as administered by personal computer. J Clin Exp Neuropsychol.
2005;27(5):529-43.
16. Edwards JD, Ross LA, Wadley VG, Clay OJ, Crowe M, Roenker DL, et al. The useful field of
view test: normative data for older adults. Arch Clin Neuropsychol. 2006;21(4):275-86.
17. Andersson J, Peters B. Simulatorbaserad testmetod. Bedömning av körförmåga hos individer med
synfältsbortfall. VTI notat 33-2016; 2016.
18. Zur A, Shinar D. Older people's driving habits, visual abilities, and subjective assessment of daily
visual functioning. Work (Reading, Mass). 1998;11(3):339.

VTI PM 2021:8                                                                                          33
ABOUT VTI

T
        he Swedish National Road and Transport Research Institute (VTI), is an
        independent and internationally prominent research institute in the
        transport sector. Our principal task is to conduct research and develop-
ment related to infrastructure, traffic and transport. We are dedicated to the con-
tinuous development of knowledge pertaining to the transport sector, and in this
way contribute actively to the attainment of the goals of Swedish transport policy.

Our operations cover all modes of transport, and the subjects of pavement
technology, infrastructure maintenance, vehicle technology, traffic safety, traffic
analysis, users of the transport system, the environment, the planning and deci-
sion making processes, transport economics and transport systems. Knowledge
that the institute develops provides a basis for decisions made by stakeholders in
the transport sector. In many cases our findings lead to direct applications in both
national and international transport policies.

VTI conducts commissioned research in an interdisciplinary organisation. Employ-
ees also conduct investigations, provide counseling and perform various services
in measurement and testing. The institute has a wide range of advanced research
equipment and world-class driving simulators. There are also laboratories for
road material testing and crash safety testing.

In Sweden VTI cooperates with universities engaged in related research and
education. We also participate continuously in international research projects,
networks and alliances.

The Institute is an assignment-based authority under the Ministry of Infrastruc-
ture. The Institute holds the quality management systems certificate ISO 9001
and the environmental management systems certificate ISO 14001. Certain test
methods used in our labs for crash safety testing and road materials testing are
also certified by Swedac.

     Swedish National Road and Transport Research Institute • www.vti.se • vti@vti.se • +46 (0)13–20 40 00
You can also read