Greater Center City Housing: 2021 - Building on Resiliency - Center City District
←
→
Page content transcription
If your browser does not render page correctly, please read the page content below
Housing Report 2021 | 1

                                                                                                                               BeauMonde Originals

CENTER CITY REPORTS | MARCH 2021

Greater Center City Housing: 2021
Building on Resiliency
Greater Center City housing markets showed extraordinary resil-          were commandeered for work, or as places to accommodate or
ience in the last year. While the pandemic impaired many parts of        supervise virtual schooling. As travel, entertainment and dining
Philadelphia’s economy, the housing sector recovered quickly city-       options contracted those with stable retirement or investment income
wide, buoyed by historically low interest rates and continued interest   found that home was the best place to shelter from the storm.
in city living. From March to June 2020, construction, sales and
                                                                         While some decamped for second homes at the beach, the moun-
leasing plummeted. However, after the first wave of the pandemic
                                                                         tains or in warmer climates, there is little evidence of wholesale
abated in late spring, local government permitted construction to
                                                                         flight of the middle class from Philadelphia. To be sure, long-term
resume. Leasing and sales quickly rebounded, facilitated by much
                                                                         patterns of movement to suburbs continued. However, even with
greater use of digital technology for virtual open houses. In Greater
                                                                         international immigration closed down, Philadelphia continued to
Center City and immediately adjacent areas, there were more new
                                                                         experience both local population growth and net migration from
units under construction at the end of 2020 than the end of 2019,
                                                                         other East Coast cities. Philadelphia is emerging as an attractive
driven by local population growth and the movement of people from
                                                                         alternative to other higher-priced cities in the Northeast corridor.
other metro areas into Philadelphia.
                                                                         As a result, housing prices and rents in Greater Center City and
While many workplaces were empty, the stay-at-home order inten-          adjacent areas rose in 2020. However, for those whose incomes
sified the use of homes, especially for those with multiple adults       were limited or lost in the pandemic, housing challenges were
working remotely. Dining rooms, kitchens and spare bedrooms              compounded, as documented in the final section of this report.

Center City District & Central Philadelphia Development Corporation                                                       CENTERCITYPHILA.ORG
2 | Housing Report 2021

  KEY FINDINGS
  1. By summer 2020, housing construction, sales and leasing quickly              3. Despite concerns about people moving to the suburbs, there is little
  rebounded from the March stay-at-home order. There were 9,400 units             evidence of any accelerated flight from the city. The shutdown of foreign
  under construction in Greater Center City and the adjacent ZIP codes at         immigration in 2020 did reduce the number of new people moving into
  the end of 2020, a 39% increase from 6,762 units underway at the end            the city, but Philadelphia continues to attract more people from Boston,
  of 2019, as the development zone around the downtown continued                  New York and Washington than those moving the other way. The neigh-
  to expand.                                                                      borhoods of Philadelphia that are attracting new residents are in close
                                                                                  proximity to the center of the city, where 53% of all jobs are located.
  2. Due to the absence of workers, visitors and many cultural amenities,
  prices in the core declined slightly in 2020 but rose throughout extended       4. Low-income renters and homeowners continue to struggle to pay
  Center City and citywide. The rate at which listed houses sold accelerat-       housing costs. What distinguishes Philadelphia from other cities with
  ed even as most prices rose. Initially, rents dipped in the core but rose in    significant housing cost burdens, however, is not that local housing costs
  both the extended neighborhoods and the neighborhoods immediately               are so high, but rather that incomes are so low. Expanded support for
  north of Girard Avenue and south of Tasker Street. Revitalized commer-          affordable housing is essential. The most effective means to enable all
  cial corridors in these areas benefited from the presence of many people        Philadelphians to afford quality housing is for the city to add more fami-
  working from home; in turn, this reinforced the attractiveness of these         ly-sustaining jobs. Ultimately, the most important thing local government
  communities. The return of office workers to the downtown is essential          can do is promote expanding job opportunities through investments in
  to restore the animation and appeal of the core.                                economic development and public policies that make Philadelphia more
                                                                                  competitive for business growth.

  NEW SUPPLY: UNITS COMPLETED                                                     As in 2019, the volume of units completed in 2020 in the ZIP codes
                                                                                  just north of Greater Center City exceeded the volume completed
  The mandated pause in construction reduced residential completions
                                                                                  within Greater Center City.
  citywide during the spring and summer months. In Greater Center
  City, 1,126 units of housing were completed in 2020, just 52% of                Within Greater Center City, completed units were concentrated
  what was completed in 2019 (Figure 1). Still, Greater Center City,              in Point Breeze and Grays Ferry (ZIP code 19146), an area where
  which constitutes just 6% of Philadelphia’s land area, was the                  development consisted primarily of single-family homes and duplexes.
  setting for 27% of the citywide total of new units.                             Single-family developments were also concentrated in the adjacent
                                                                                  ZIP codes to the north of Greater Center City in Fairmount, North
  An additional 1,498 units were completed in the five ZIP codes
                                                                                  Philadelphia, Kensington and Fishtown. Within the core of Center
  immediately north and south of Greater Center City, bringing the
                                                                                  City, development was largely concentrated in mid-rise and high-
  total at the core of the city to 2,624 units, nearly two-thirds of all
                                                                                  rise apartments, with 223 units east of Broad Street, including 216
  completed units in Philadelphia for the year (Figures 2 & 3).
                                                                                  new units in The View at Old City and a few units west of Broad.
                                                                                  Overall, 57.5% of new units in Greater Center City were apartments
                                                                                  and 42.5% were homes for sale.

  FIGURE 1: GREATER CENTER CITY HOUSING COMPLETIONS, 2000-2020

                                                                                                                      Apartment               Condo                Single Family

   3,000

                                                                                                                                                         353
   2,500
                                                                                                                                                          180

   2,000                                                                                                                                                            327
                                                                                                                                                                    118
   1,500

                                                                                                                                                        2,277
   1,000
                                                                                                                                                                    1,697      478

    500
                                                                                                                                                                               648
      0
           2000   2001    2002   2003   2004   2005   2006   2007   2008   2009   2010   2011   2012   2013    2014     2015       2016       2017       2018       2019       2020
                                                                                                                      Source: City of Philadelphia Department of Licenses and Inspections

  CENTERCITYPHILA.ORG                                                                              Center City District & Central Philadelphia Development Corporation
Housing Report 2021 | 3

     FIGURE 2:
     HOUSING UNITS
     COMPLETED BY
     AREA 2020                                  19121
                                                                                         19122
                Under 5
                6-10

                11-25
                                                                                                                                 19125
                26-50

                51-100

                101-200
                                               19130                                    19123

                Over 200

               Single Family
               Apartments

                ZIP Code                                                 19103            19107
                Boundary
     Source: City of Philadelphia,
     Department of License
     and Inspections                                                          19102                          19106

                                                                                        19109

                                     19146

                                                                                                                19147

                                     19145
                                                                                                               19148

FIGURE 3: HOUSING COMPLETIONS BY AREA OF CENTER CITY, 2020

 AREA (ZIP CODE)                                       COMPLETED UNITS                % OF COMPLETED UNITS      Adjacent ZIP Code Total

                                                                                                                1,498
  Core West (19102, 19103)                                                4                             0%
  Core East (19106, 19107)                                              223                             5%
  Core Center City Total                                                227                             6%
  Extended Northwest (19130)                                            108                             3%
                                                                                                                Greater Center City and
  Extended Northeast (19123)                                            186                             5%
                                                                                                                Adjacent ZIP Codes
  Extended Southwest (19146)                                            519                            13%
  Extended Southeast (19147)
  Extended Center City Total
                                                                         86
                                                                        899
                                                                                                        2%
                                                                                                       22%
                                                                                                                2,624
  Greater Center City Total                                           1,126                            27%
 Adjacent Northwest (19121)                                             385                             9%      Citywide Total
 Adjacent North (19122)
 Adjacent Northeast (19125)
 Adjacent North Total
                                                                        628
                                                                        321
                                                                      1,334
                                                                                                       15%
                                                                                                        8%
                                                                                                       32%
                                                                                                                4,112
 Adjacent Southwest (19145)                                              66                             2%
 Adjacent Southeast (19148)                                              98                             2%
 Adjacent South Total                                                   164                             4%
 Adjacent Zip Code Total                                              1,498                            36%
  Greater Center City and Adjacent Zip Codes                          2,624                           64%
  Citywide Total                                                      4,112                           100%

Center City District & Central Philadelphia Development Corporation                                                              CENTERCITYPHILA.ORG
4 | Housing Report 2021

  NEW SUPPLY: UNDER CONSTRUCTION
  Following the lull in early spring, the volume of new projects
  rebounded quickly once construction could resume. Low interest
  rates and concerns about the possible year-end sunset of the
  10-year tax abatement, led developers to secure permits for 3,842
  new housing units in Philadelphia in 2020, the third highest total
  of the past 30 years (Figure 4).

  The combined effect of the second quarter pause in construction
  activity and the third and fourth quarter surge meant that the level
  of construction underway at the end of 2020 exceeded the previous
  year’s total. There were 9,643 units under construction in Greater
  Center City and the adjacent ZIP codes at the end of 2020, a 43%
  increase from 6,762 units underway at the end of 2019. The most
  significant increases in activity were north of the core, in extended
  Center City (ZIP codes 19130 and 19123), an area that includes
  Fairmount and Northern Liberties, and in the three northern ZIP
  codes adjacent to Greater Center City, including parts of North
  Philadelphia, Kensington, and Fishtown (Figures 5 & 6).

  Within core Center City, 1,386 residential units are under construc-
  tion, concentrated in large projects. The Arthaus on South Broad
  Street includes 107 condominiums. The Laurel on Rittenhouse
  Square includes 189 luxury apartment units and 60 condominiums.                      Developments in Kensington                                         BeauMonde Originals

  Riverwalk at Arch Street and the Schuylkill River includes two rental
  buildings; the first holds 331 units and a Giant supermarket. The
  adjacent tower at 60 North 23rd street contains 380 units. There are               The largest development in progress is at 1104 North Hancock
  also two smaller projects at 312 North 2nd street and 229                          Street in Northern Liberties. This project, spanning a four-acre lot,
  Arch Street.                                                                       will create 861 new units in three buildings. The second-largest
                                                                                     multifamily project now underway is located at 510 North Broad
  In extended Center City, there are 3,966 units in progress, concen-
                                                                                     Street in Spring Garden with 410 units.
  trated mostly to the north of the core. For example, 1300 Fairmount
  is nearly complete, bringing 478 units to the market, along with an                Farther north, in the adjacent ZIP codes, Brewerytown, Fishtown,
  Aldi grocery store that opened in the fall of 2020.                                Kensington, and Port Richmond continue to boom, with 3,990 units
                                                                                     in progress. Development is occurring in multifamily projects and
                                                                                     townhomes spread throughout the area. In Fishtown (ZIP code
                                                                                     19125), 322 single-family units are in progress, the largest for any
                                                                                     ZIP code. In Point Breeze (ZIP code 19146), south of the core, there
                                                                                     are 120 single-family units underway.

   FIGURE 4: NEW RESIDENTIAL UNITS RECEIVING PERMITS CITYWIDE, 1990-2020

  5,000

                                                                                                                                                                             3,842
  4,000

  3,000

  2,000

  1,000   747

      0
          1990 1991 1992 1993 1994 1995 1996 1997 1998 1999 2000 2001 2002 2003 2004 2005 2006 2007 2008 2009 2010 2011 2012 2013 2014 2015 2016 2017 2018 2019 2020
                                                                                                                                  Source: U.S. Census Bureau, Building Permits Survey

  CENTERCITYPHILA.ORG                                                                                  Center City District & Central Philadelphia Development Corporation
Housing Report 2021 | 5

     FIGURE 5:
     HOUSING UNITS
     IN PROGRESS
     BY AREA 2020                                              19121                    19122
                 Under 5
                 6-10

                 11-25
                                                                                                                                19125
                 26-50

                 51-100

                 101-200
                                               19130                                    19123

                 Over 200

               Single Family
               Apartments

                ZIP Code
                Boundary                                                                 19107

     Source: City of Philadelphia,
     Department of License                                       19103
     and Inspections                                                            19102                       19106

                                                                                        19109

                                                                                                             19147

                                     19146

                                     19145
                                                                                                              19148

FIGURE 6: HOUSING UNITS IN PROGRESS BY AREA OF CENTER CITY, 2020
                                                           UNITS UNDER                   % OF UNITS UNDER
 AREA (ZIP CODE)
                                                         CONSTRUCTION                       CONSTRUCTION       Adjacent ZIP Code Total
  Core West (19102, 19103)
  Core East (19106, 19107)
  Core Center City Total
                                                                        1,192
                                                                         194
                                                                        1,386
                                                                                                      8%
                                                                                                      1%
                                                                                                      10%
                                                                                                               4,291
  Extended Northwest (19130)                                            1,331                         9%       Greater Center City and
  Extended Northeast (19123)                                            2,030                         14%      Adjacent ZIP Codes
  Extended Southwest (19146)                                             519                          4%
  Extended Southeast (19147)
  Extended Center City Total
                                                                          86
                                                                        3,966
                                                                                                      1%
                                                                                                      28%
                                                                                                               9,643
  Greater Center City Total                                            5,352                          37%
 Adjacent Northwest (19121)                                              715                          6%
                                                                                                               Citywide Total

                                                                                                               14,415
 Adjacent North (19122)                                                 1,814                         13%
 Adjacent Northeast (19125)                                             1,461                         10%
 Adjacent North Total                                                   3,990                         28%
  Adjacent Southwest (19145)                                             226                          2%
 Adjacent Southeast (19148)                                               75                          1%
 Adjacent South Total                                                    301                          2%
 Adjacent Zip Code Total                                               4,291                         30%
  Greater Center City and Adjacent Zip Codes                           9,643                          67%
  Citywide Total                                                       14,415                        100%

Center City District & Central Philadelphia Development Corporation                                                             CENTERCITYPHILA.ORG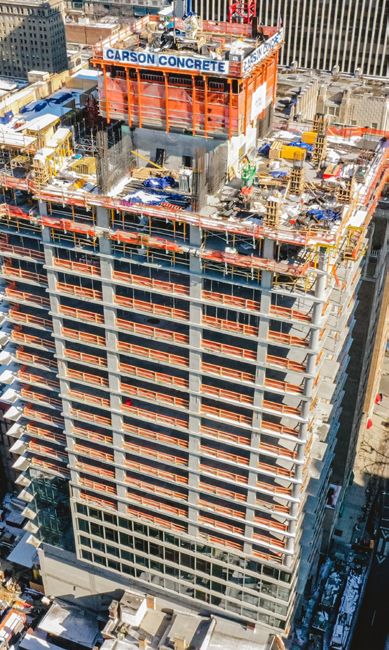
6 | Housing Report 2021

                                                                                                  BeauMonde Originals

    Riverwalk, 60 North 23rd Street

    1300 Fairmont Avenue              BeauMonde Originals    The Laurel, 1907 Walnut Street       BeauMonde Originals

  CENTERCITYPHILA.ORG                               Center City District & Central Philadelphia Development Corporation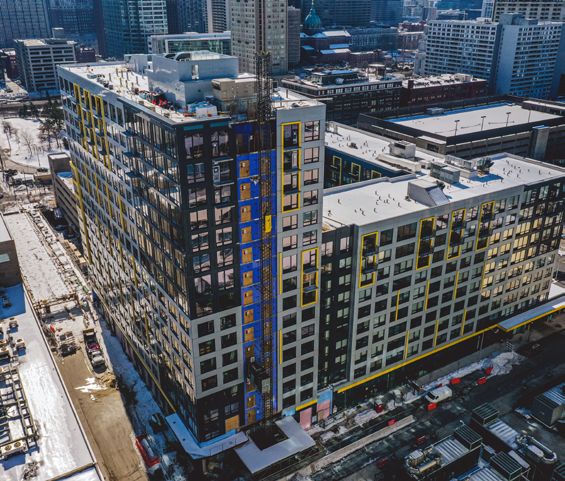
Housing Report 2021 | 7
.MEASURES OF DEMAND In Greater Center City, there was an overall dip in market activity for
all types of home sales in the second quarter, the high point for the
In Philadelphia, a persistent question remains: can we absorb so first wave of new COVID-19 cases and for social unrest. Prices then
much new supply? Real estate markets can occasionally overbuild declined in the third quarter, but rebounded in the fourth quarter
and deliver a surplus. However, Philadelphia is also a city that was (Figures 9 & 10).
so long accustomed to a declining population that it takes a while to
adjust to the realities of growth. By separating the sale of all single-family homes from condominium
sales in the core of downtown and in the extended neighborhoods,
it is possible to see how different geographic subsets of the market
FOR-SALE VOLUME, PRICE & VELOCITY:
responded. Based on Department of Records data analyzed by Kevin
The pandemic momentarily depressed Greater Center City sin- Gillen of Drexel University, the volume of all condominium sales in
gle-family home and condominium sales in the second quarter of the core dropped in the second quarter of 2020 to 50% below the
2020. The market rebounded in the third and fourth quarters as the volume of sales in the second quarter of 2019, after sales had sur-
volume of transactions on a monthly basis surpassed 2019 levels passed 2019 levels in the first quarter.1 The average sale price for
from August to December. The same trend held for citywide sales condominiums in the core then declined, year-over-year by 34% in
volumes (Figure 7). third quarter and by 17% in the fourth quarter. This clearly reflects
At the same time, prices citywide in 2020 exceeded 2019 numbers the uncertain conditions in the downtown, where office workers and
every month from February through December (Figure 8). hotel guests were absent, performing arts institutions were closed
and social unrest left stores vandalized and boarded up. The volume
of condominium sales in the core rebounded in the fourth quarter as
conditions stabilized, plywood was removed and restaurants, retailers
and cultural institutions began to reopen.
FIGURE 7: HOMES SOLD IN GREATER CENTER CITY
2019 2020
400
350
300
250
200
150
100
50
260
309
220
294
230
346
302
270
324
368
368
289
222
235
227
327
277
182
215
231
152
315
331
177
0
January February March April May June July August September October November December
Source: Multiple Listing Service (MLS)
FIGURE 8: MONTHLY MEDIAN MEDIAN SALE PRICE, PHILADELPHIA
2019 2020
$300,000
$250,000
$200,000
$150,000
$100,000
$200K
$240K
$240K
$209K
$205K
$250K
$220K
$220K
$220K
$230K
$246K
$245K
$248K
$248K
$245K
$242K
$225K
$232K
$210K
$210K
$185K
$215K
$215K
$213K
$50,000
$0
January February March April May June July August September October November December
Source: Multiple Listing Service (MLS)
1: Many sales by developers of condominium units do not use a traditional broker and therefore do not show up in the Multiple Listing Service (MLS). However, the
Department of Records tracks all transactions and deed changes.
Center City District & Central Philadelphia Development Corporation CENTERCITYPHILA.ORG8 | Housing Report 2021
FIGURE 9: RESIDENTIAL SALES IN FIGURE 10: MEDIAN RESIDENTIAL SALE PRICE IN
GREATER CENTER CITY GREATER CENTER CITY
Single Family Condominiums Single Family Condominiums
$ in Thousands
1,200
$500
900 $400
357 363 $300
358 295
600 286
271
283 $200
218
300
$100
460K
420K
449K
390K
442K
350K
350K
425K
384K
435K
384K
343K
398K
395K
359K
375K
475 591 627 536 431 386 589 626
0 0
2019 Q1 2019 Q2 2019 Q3 2019 Q4 2020 Q1 2020 Q2 2020 Q3 2020 Q4 2019 Q1 2019 Q2 2019 Q3 2019 Q4 2020 Q1 2020 Q2 2020 Q3 2020 Q4
Source: Kevin Gillen, Lindy Institute - Drexel University Source: Kevin Gillen, Lindy Institute - Drexel University
The volume of home sales in Greater Center City
declined in the 2nd quarter of 2020, but steadily
rebounded in the summer and fall.
FIGURE 11: MLS BROKERED RESIDENTIAL SALES IN GREATER CENTER CITY AND ADJACENT ZIP CODES IN 2020
%CHANGE AVERAGE %CHANGE DAYS ON %CHANGE
AREA SALES
FROM 2019 PRICE FROM 2019 MARKET FROM 2019
CORE CENTER CITY 732 -9% $621,657 -4% 89 -23%
East 353 -7% $528,279 -5% 80 -25%
West 379 -11% $708,629 -3% 97 -20%
EXTENDED CENTER CITY 2,485 12% $481,248 +8% 53 -30%
North 764 8% $466,150 +6% 53 -30%
East 286 26% $494,654 +1% 61 -28%
West 478 -1% $449,095 +8% 48 -28%
South 1,721 14% $487,950 +9% 53 -29%
East 689 21% $516,257 +5% 54 -33%
West 1,032 10% $469,052 +11% 52 -24%
GREATER CENTER CITY TOTAL 3,217 6% $513,197 +3% 61 -28%
Source: MLS
CENTERCITYPHILA.ORG Center City District & Central Philadelphia Development CorporationHousing Report 2021 | 9
FIGURE 12: AVERAGE HOME SALE PRICE, GREATER CENTER CITY AND ADJACENT ZIP CODES, 2010-2020
Core Center City Extended Center City Adjacent ZIP Codes
$800,000
$700,000
$621,657
$600,000
$482,374 $481,248
$500,000
$400,000
$302,381 $318,229
$300,000
$200,000 $146,806
$100,000
2010 2011 2012 2013 2014 2015 2016 2017 2018 2019 2020
Source: MLS
By contrast, both average condominium sale prices and average FIGURE 13: DAYS ON MARKET, GREATER CENTER CITY,
single-family home prices in the extended neighborhoods, most 2010-2020
with their own vibrant retail corridors, rose year-over-year in
250
every quarter of 2020. In the fourth quarter, average condominium
sale prices in the extended neighborhoods were up 6.2%, while
200
single-family home prices were up 17%. Overall, MLS data for
brokered, single-family and condominium sales show prices
declined by 4% from 2019 to 2020 in the core but increased by 150
8% in the extended neighborhoods (Figure 11).
100
One other factor probably affected housing prices in core Center
City: the substantial new supply brought to market in the adjacent
neighborhoods in the last decade. Figure 12 shows how prices in ex- 50
tended neighborhoods have continued to rise, even as a substantial
160 203 163 141 115 127 105 93 103 85 61
new supply of more competitively priced houses has come to market 0
in the five ZIP codes that surround Greater Center City. By contrast, 2010 2011 2012 2013 2014 2015 2016 2017 2018 2019 2020
Source: MLS
in the face of so much new supply, prices in the core have moderated
since 2017.
Another indicator of market vitality is velocity. The average num-
ber of days on market for MLS listed homes in Greater Center City Finally, because average prices tracked by MLS are not quality
continued a decade-long trend, declining from 203 days in 2011 to controlled for specific home characteristics nor for home size, they
just 61 days on the market between listing and closing in 2020 (Fig- are not a precise measure of the market. Econsult Solutions calcu-
ure 13). During this time, prices have also been steadily increasing lates a Philadelphia Housing Index (PHI) for the city as a whole and
across most of the neighborhoods that surround downtown. for select neighborhoods. PHI controls for changes in the type of
housing sold each year. The index shows an adjusted 13% increase
The year 2020 was extraordinarily challenging for most major cities,
in housing prices for Greater Center City in 2020, and appreciation
so it is helpful to compare Philadelphia’s housing market to other
in all but three of the past 20 years (Figure 14).
places. According to Redfin, Philadelphia’s median home sale price
increased 15% from December 2019 to December 2020, compared
to a decrease of 1% in Boston, and a 5% increase in New York.2
Research by Drexel University’s Kevin Gillen also finds that average
home values in Philadelphia increased 12.8% in 2020, more rapidly
than the 9.8% increase in the Case-Shiller housing index, which
tracks home values in 10 U.S. cities.3
2: Data provided by Redfin, a national real estate brokerage.
3: Kevin Gillen, Lindy Institute - Drexel University, Philadelphia Housing Report Q4 2020
Center City District & Central Philadelphia Development Corporation CENTERCITYPHILA.ORG10 | Housing Report 2021
THE RENTAL MARKET:
Based on asking price data assembled by Zillow, average rents
increased from $1,785 to $1,815 between 2019 and 2020 in the
extended ZIP codes of Greater Center City and from $1,380 to
$1,397 in the adjacent ZIP codes, while asking rents decreased
slightly by 1% from $1,902 to $1,883 in the core (Figure 15).
However, since some developers of new projects are offering
inducements of one or more months of free rent, actual rents
received were lower.
Delta Associates' fourth quarter 2020 report, which focuses on
larger scale apartment buildings with a broad range of amenities,
showed the vacancy rate among existing buildings in Philadelphia
rising from 4.7%% in December of 2019 to 9.5% in December 2020.
Factoring in new buildings still in the lease-up phase, the vacancy
rate rose from 6.6% in December 2019 to 11.9% in December 2020.4
Conditions vary significantly by location, building type and customer
Hamilton Tower (400 N 15th Street) BeauMonde Originals
profile. Some buildings are 100% leased. Others that depend on
FIGURE 14: ECONSULT HOUSING PRICE INDEX, GREATER CENTER CITY, 2001-2020
20%
15.0% 15.0%
15%
13.1% 13.6% 13.1%
9.4% 9.3% 10.0%
10% 8.7%
7.2% 7.0%
6.3%
5% 4.4%
0.7%
2.4% 2.1%
1.1%
0%
-5%
-4.5%
-5.3% -5.7%
-10%
2001 2002 2003 2004 2005 2006 2007 2008 2009 2010 2011 2012 2013 2014 2015 2016 2017 2018 2019 2020
Source: Econsult Solutions Inc, Phialdelphia Housing Index
FIGURE 15: AVERAGE MONTHLY RENT, CENTER CITY AND ADJACENT ZIP CODES, 2014-2020
Core Center City Extended Center City Adjacent ZIP Codes
$2,000
$1,883
$1,815
$1,750 $1,772
$1,577
$1,500
$1,397
$1,250 $1,259
$1,000
2014 2015 2016 2017 2018 2019 2020
Source: Zillow
4: Delta Associates' Fourth Quarter 2020 Philadelphia Class A Apartment Market Report
CENTERCITYPHILA.ORG Center City District & Central Philadelphia Development CorporationHousing Report 2021 | 11
foreign graduate students, for example, are half-empty. One owner FIGURE 16: MONTHLY APARTMENT RENT INDEX,
of a significant inventory, reports occupancy rates at 92% with rents MAJOR CITIES, 2020-21
down 5% year over year. A second developer of two recently com-
pleted residential towers in Center City enjoyed occupancy levels of
(January 2020 = 100)
88% and 96% in the first quarter of 2020. Occupancy levels dropped 105
to a low of 65% in one tower and 75% in the second tower heading
into winter. But by March 2021, occupancy levels had rebounded to
100
85% and 90% respectively and leasing demand remained robust.
The overall context for all apartment owners is that significant
95
new supply of more affordable apartments has come online in the
extended and adjacent neighborhoods simultaneous with the loss
90
of vitality and social unrest in the core. Office workers for example,
usually constitute as much as 50% of the pedestrian traffic in the
core. Performing arts institutions are closed. Most hotels have been 85
operating at 10% occupancy rates.
80
Delta Associates offers this prognosis: “These conditions are
temporary – once the COVID-19 vaccines have been widely distrib-
75
uted and the economy begins to improve, we expect the apartment
market to recover. It will take some time for rents to bounce back to
70
previous levels, but absorption and vacancy will likely be the first
0
0
0
20
20
20
20
20
21
20
21
20
20
20
-2
-2
-2
to show some signs of recovery, perhaps by the second half of
g-
c-
p-
n-
b-
b-
n-
n-
r-
t-
l-
ay
ar
ov
Oc
Ju
Ap
De
Au
Se
Fe
Fe
Ju
Ja
Ja
M
M
N
2021. Significant rent growth may not return to the market until Source: Apartment List
at least 2022.”5 Baltimore Philadelphia Washington Boston Seattle
While all major cities face similar challenges, a comparative look New York San Francisco
at asking rents by Apartment List shows that Philadelphia fared
better than five other major markets with more modest declines in
citywide rent levels (Figure 16).6
FIGURE 17: POPULATION AND HOUSING CHARACTERISTICS OF CENTER CITY, PHILADELPHIA, AND REGION
CORE EXTENDED GREATER PHILADELPHIA
PHILADELPHIA
CENTER CITY CENTER CITY CENTER CITY METRO
TOTAL POPULATION 60,978 127,497 190,000 1,559,579 6,191,755
Area (Square Miles) 2.6 6.1 8.7 142.7 4,870.0
Population Density (per Square Mile) 23,453 20,765 21,565 10,929 1,271
Average Household Size 1.65 2.13 1.89 2.60 2.60
Percent of Households Owner Occupied 33% 56% 47% 53% 67%
Percent of Households with Children 6% 12% 12% 22% 27%
Percent Bachelor's or more 78% 61% 67% 30% 38%
Median Household Income $86,482 $76,778 $81,157 $46,991 $56,639
Non-Auto Commuting Mode Share 96% 59% 69% 42% 20%
Percent No vehicle Households 48% 29% 36% 30% 13%
AGE DISTRIBUTION
Percent under 5 3% 6% 5% 7% 6%
Percent 5 to 19 5% 9% 8% 18% 19%
Percent 20-34 44% 38% 40% 26% 21%
Percent 35-54 21% 26% 24% 24% 26%
Percent 55 - 64 9% 10% 10% 12% 14%
Percent 65 and over 18% 12% 14% 13% 16%
Source: Census Bureau, American Community Survey 2019 five-year estimates, ESRI.
5: Delta Associates, Q4 2020 Philadelphia Class A Apartment Market Report, p. 18.
6: Data provided by Apartment List
Center City District & Central Philadelphia Development Corporation CENTERCITYPHILA.ORG12 | Housing Report 2021
FIGURE 18: PHILADELPHIA TOTAL EMPLOYMENT BY MONTH 2019 VS. 2020 (IN THOUSANDS)
2019 2020
780
740
700
660
620 646.8
692.0
656.9
679.9
748.0
739.4
736.6
736.6
685.3
744.2
675.6
753.4
734.3
749.9
745.9
735.6
742.6
736.2
732.2
739.7
687.5
691.2
731.9
692.1
580
January February March April May June July August September October November December
Source: Bureau of Labor Statistics, Current Employment Statistics, seasonnally adjusted
DRIVERS OF DEMAND lower-wage jobs dependent on face-to-face interaction, where
as many as 45% of jobs were lost. Professional, business and
What are the sources of demand for Philadelphia existing and new
financial services, education and higher skilled health care jobs –
homes and apartments? Center City remains an attractive residen-
the employment base for many of the residents of Greater Center
tial location due to multiple strengths that have temporarily been
City – have been able to rely far more on telework. Job losses in
interrupted, but not fundamentally disrupted by the pandemic. Very
these sectors have also been less severe – in the 5% to 10% range.
few downtowns can match the extraordinary range and affordability
Between 35% and 40% of residents of Greater Center City are
of diverse neighborhoods, architecture styles and housing types
employed in Greater Center City. Another 10% to 12% have jobs in
located in Greater Center City. Downtown provides proximity to job
University City.
opportunities, cultural offerings aand thousands of retail establish-
ments and restaurants. Walkable and bikeable neighborhoods have
POPULATION GROWTH:
unparalleled connectivity via transit and automobile to locations
throughout the region and the Northeast. In the last 20 years, According to the U. S. Census Bureau, Philadelphia gained popu-
most of the pre-automobile commercial corridors in the extended lation every year from 2006 to 2019, adding 94,400 residents during
neighborhoods, derelict in the 1970s and 1980s, now offer a broad that period, a citywide increase of 6.4%. In recent years, the most
range of services and amenities provided by many local proprietors. significant population growth has occurred in Greater Center City
National and regional supermarkets and many big box retailers and in adjacent ZIP codes to the north. Citywide, population growth
have created new urban formats. has been driven by natural increase (births exceeding deaths)
and international migration. These factors were offset by regional
In 2020, Greater Center City was home to 190,000 residents and
domestic out-migration exceeding in-migration. The longstanding
98,800 households. Nearly half of all households were homeown-
pattern of working class and middle income households moving
ers; 12% had children. Two-thirds of adults possessed a bachelor's
to the suburbs exceeds the number of empty nesters and young
degree and median household income exceeded $81,000. Forty
professionals moving in (Figure 19). However, while most of those
percent of the population was between the ages of 20 and 34.
leaving depart from working class and middle income neighbor-
Compared to the Philadelphia region, Greater Center City residents
hoods across the city, most of those arriving move to Greater Center
are more likely to possess a college degree, have higher median
City or University City (Figure 20).
income, and are far less likely to rely on an automobile to commute
to work (Figure 17). From 2010 to 2019, births exceeded deaths in Philadelphia by
72,700, while international migration brought 77,700 new residents
The pandemic resulted in loss of almost 100,000 jobs citywide
to the city. Outmigration to other parts of the country exceeded
between March and April, but Philadelphia had recovered 38,500 of
new domestic arrivals by 91,300. The result was overall population
those jobs by December 2020 (Figure 18). The biggest losses were
growth of 58,100.7
in leisure, hospitality, and restaurant and food service, largely
7: U.S. Census Bureau, Population Estimates Program. The most recent migration estimates from the Census Bureau’s American Community Survey, the 2014-
2018 five-year estimate, indicates that average annual domestic in-migration to Philadelphia was 65,941, while average annual domestic out-migration from
Philadelphia was 75,147, for net out-migration from the city to other points in the U.S. of 9,206. Average international migration to the city over this period was
12,710. International migration to Philadelphia thus exceeded net domestic migration from the city by 3,504.
CENTERCITYPHILA.ORG Center City District & Central Philadelphia Development CorporationHousing Report 2021 | 13
FIGURE 19: MIGRATION BETWEEN PHILADELPHIA FIGURE 20: PERCENT OF POPULATION WHO MOVED
AND SUBURBS, 2011-2018 INTO ZIP CODE WITHIN PAST YEAR
Suburb Migration Out Suburb Migration In
25,000
20,000
15,000
10,000
5,000
160 203 163 141 115 127 105 93 103 85 74
0
2011 2012 2013 2014 2015 2016 2017 2018
Source: IRS
PERCENT MOVED
0.7% –2.5%
2.51% - 3.9%
0.7 - 2.5
3.91% - 5.3%
2.51 - 3.9
5.31
3.91-- 10.3%
5.3
10.31
5.31 --10.3
15.5%
Those moving to Philadelphia 10.31 - 15.5
15.51 - 23.8%
15.51 - 23.8
choose the neighborhoods that NoNoData
Data
Source: U.S. Census Bureau, American
surround downtown in close Community Survey, 2019 five-year estimates
proximity to jobs and academic
institutions.
The pandemic may have altered these trends, at least temporarily. FIGURE 21: PHILADELPHIA MIGRATION TO AND FROM
Research by the Federal Reserve Bank of Cleveland suggests that SUBURBS, OTHER NORTHEAST CITIES, 2017 TO 2018
net migration from cities, including Philadelphia, increased sub-
stantially in 2020.8 However, the loss was not a result of increased Outflow Inflow
departures but rather of decreased arrivals, particularly resulting 25,000
from curtailment of foreign immigration by a federal government
that was explicitly discouraging it. It remains to be seen what 20,000
18,296
happens with immigration as the pandemic recedes and policies
change with a new administration.
15,000 13,600 12,914 12,551
Figure 20 depicts those ZIP codes with high percentages of new
residents arriving each year between 2015 and 2019. The impor-
10,000
tance of job concentration (53% of all Philadelphia employment
6,709
is in Center City and University City), and the presence of college
5,000 4,771
campuses that draw more than 100,000 students each year, are
readily apparent.9
0
Philadelphia Suburbs Northeast Corridor Other Areas
Metropolitan Areas
Source: IRS
8: Federal Reserve Bank Cleveland, Did the COVID-19 Pandemic Cause an Urban Exodus?, 2021
9: U.S. Census Bureau, Longitudinal Employment Household Dynamics LEHD
Center City District & Central Philadelphia Development Corporation CENTERCITYPHILA.ORG14 | Housing Report 2021
View of Center City from North Broad Street BeauMonde Originals
IRS data also indicates that between 2017 and 2018, 6,709 FIGURE 22: REGIONAL COST OF LIVING INDEX (REGIONAL
households moved to Philadelphia from other major Northeast PRICE PARITY) FOR ALL ITEMS AND HOUSING RENTS, 2019
regions – including Washington, Baltimore, New York and Boston.
This number exceeded the number of households moving from Housing Rent All Items
Philadelphia to these destinations by nearly 2,000 (Figure 21).
This suggests Philadelphia’s growing competitiveness relative to San Francisco
200
135
other large Northeast cities.10
Los Angeles 170
In addition to the presence of jobs, colleges, universities and 119
teaching hospitals, Philadelphia offers both a high quality of life Washington
162
117
and housing affordability. Housing prices in the Philadelphia
region, according to the Bureau of Economic Analysis, are close New York 152
126
to the national average, but well below prices in Washington,
148
New York and Boston (Figure 22). Seattle
115
Boston
144
116
Chicago 112
103
Philadelphia
109
105
Houston 105
102
Phoenix
103
99
0 50 100 150 200
Source: Bureau of Economic Analysis
10: Internal Revenue Service, Migration Data 2017-2018
CENTERCITYPHILA.ORG Center City District & Central Philadelphia Development CorporationHousing Report 2021 | 15
FIGURE 23: PERCENT OF COST-BURDENED HOUSEHOLDS, HOMEOWNERS AND RENTERS, 2019
Los Angeles 50.10%
New York 44.71%
San Diego 42.19%
Boston 41.32%
Detroit 40.86%
Chicago 38.98%
Memphis 38.47%
Philadelphia 37.95%
San Jose 37.84%
Houston 36.73%
Dallas 36.59%
Austin 35.32%
Washington 34.99%
Denver 34.64%
Seattle 34.28%
Jacksonville 33.51%
Indianapolis 33.46%
San Antonio 33.28%
Phoenix 33.27%
San Francisco 32.97%
El Paso 32.52%
Columbus 32.50%
Fort Worth 32.45%
Nashville 32.23%
Charlotte 32.20%
Source: US Census Bureau, American Community Survey, 2019 five-year estimate
FIGURE 24: MEDIAN HOUSEHOLD INCOME, 2019 FIGURE 25: HOUSING WITH ACTIVE
SUBSIDIES CITYWIDE
San Francisco $112,449
San Jose $109,593
Seattle $92,263
Washington $86,420
San Diego $79,673
Austin $71,576
Boston $71,115
Denver $68,592
New York $63,998
Charlotte $62,817
Fort Worth $62,187
Los Angeles $62,142
Nashville $59,828
Chicago $58,247
Phoenix $57,459
Jacksonville $54,701
Columbus $53,745
Dallas $52,580 AFFORDABLE HOUSING
San Antonio $52,455 IN PHILADELPHIA
Houston $52,338
Subsidized Units
Indianapolis $47,873 ≤42
El Paso $47,568 ≤108
Philadelphia $45,927 ≤209
≤353
Detroit $30,894
≤727
Source: U.S. Census Bureau, American Community Survey, 2019 five-year estimate
Source: National Housing
Preservation Database
Center City District & Central Philadelphia Development Corporation CENTERCITYPHILA.ORG16 | Housing Report 2021
FIGURE 26: PHILADELPHIA HOUSING COST BURDENS BY INCOME CATEGORY, 2019
OWNER PERCENT COST
OWNER OCCUPIED HOUSEHOLDS OCCUPIED HOUSEHOLDS COST BURDENED BURDENED
Total Households with Income 318,872 87,153 27%
Less than $20,000 46,991 37,664 80%
$20,000 to $34,999 44,666 20,958 47%
$35,000 to $49,999 38,875 13,355 34%
$50,000 to $74,999 54,083 10,306 19%
$75,000 or more 128,066 4,870 4%
Zero or Negative Income 6,191 6,191 100%
No Cash Rent NA NA NA
RENTER PERCENT COST
RENTER OCCUPIED HOUSEHOLDS OCCUPIED HOUSEHOLDS COST BURDENED BURDENED
Total Households with Income 282,465 141,074 50%
Less than $20,000 80,334 70,829 88%
$20,000 to $34,999 47,306 40,043 85%
$35,000 to $49,999 36,305 19,283 53%
$50,000 to $74,999 39,722 8,476 21%
$75,000 or more 56,174 2,443 4%
Zero or Negative Income 11,722 11,722 100%
No Cash Rent 10,902 0 0
PERCENT COST
TOTAL HOUSEHOLDS TOTAL HOUSEHOLDS COST BURDENED BURDENED
Total Households with Income 601,337 228,227 38%
Less than $20,000 127,325 108,493 85%
$20,000 to $34,999 91,972 61,001 66%
$35,000 to $49,999 75,180 32,638 43%
$50,000 to $74,999 93,805 18,782 20%
$75,000 or more 184,240 7,313 4%
Zero or Negative Income 17,913 17,913 100%
No Cash Rent 10,902 0 0%
Source: US Census Bureau, American Community Survey, 2019 five-year estimate
What distinguishes Philadelphia from other cities with
significant housing cost burdens is not that local housing
costs are so high, but rather that incomes are so low.
CENTERCITYPHILA.ORG Center City District & Central Philadelphia Development CorporationHousing Report 2021 | 17
FIGURE 27: BUSINESSES PER 1,000 RESIDENTS, CITY FIGURE 28: TOTAL BUSINESSES AND BLACK-OWNED
AND REGION, 2017 BUSINESSES PER 1,000 RESIDENTS, MAJOR CITIES 2017
Region City Total Businesses Black-Owned Businesses
24.6
30.0 25.0
22.4
25.0 24.6
22.8 22.4 20.0 18.6
17.1
20.0 19.2 18.6
17.5 17.3
16.4 17.1
15.0
15.0 12.1
12.1
10.0
10.0
4.7 5.0
5.0
5.0 3.4
2.5
1.8
0.0 0.0
New York Boston Atlanta Philadelphia Washington Atlanta New York Boston Washington Philadelphia
Source: U.S. Census Bureau, Annual Business Survey and American Source: U.S. Census Bureau, Annual Business Survey and American
Community Survey 2017 one-year estimates. Community Survey 2017 one-year estimates.
THE AFFORDABILITY CHALLENGE Among five major East Coast cities, Philadelphia has the lowest
number of businesses per resident, the lowest number of
Philadelphia’s renewed economic strength and attractiveness
Black- and brown-owned businesses per resident and the greatest
pre-pandemic fueled demand for new market-rate housing devel-
disparity between Black-owned businesses and all businesses
opment in relatively limited portions of the city. The ability for all
(Figures 27 and 28).
Philadelphians to afford quality housing will improve when the city
adds more family-sustaining jobs and incomes rise. The economic downturn caused by COVID-19 has exacerbated the
challenges faced by many Philadelphia households because so
In 2019, 38% of Philadelphia households paid at least 30% of their
many hourly service jobs have been lost. Lower income homeowners
income for housing, the threshold typically used to determine
are falling behind in mortgage payments, while renters struggle
whether households face a housing cost burden. The proportion of
to meet obligations. State and local rental assistance programs,
cost-burdened households places Philadelphia well below high-
eviction moratoria, and federal economic relief packages can help.
priced markets like Los Angeles, New York and Boston (Figure 23).
However, the long-term challenge, present before 2020, remains
Among renters, 50% of Philadelphia households are cost burdened, unchanged: too few Philadelphia households have income sufficient
fourth highest of the 25 largest cities. What distinguishes Philadel- to afford housing available in their communities. The city cannot
phia from other cities with significant housing cost burdens however address this problem alone, but it can advocate for more robust
is not that local housing costs are so high, but rather that incomes ongoing federal and state housing assistance programs, and
are so low. In 2019, Philadelphia’s median household income was find creative ways to support production of affordable housing.
$45,927, ranking 24th among the 25 largest cities. (Figure 24). Ultimately, however, the most important thing local government
Almost 220,000 households, 36% of all city households, make less can do is promote greater job opportunities through investments
than $35,000 per year (Figure 26). in economic development and public policies to make Philadelphia
more competitive.
Philadelphia currently has 33,667 units of subsidized housing and
while that number represents an increase of 612 units from 2019, it
is hardly enough to meet current demand (Figure 25). Households
may qualify for housing assistance based on their income, but the
number of units and vouchers available is insufficient to serve all
families that qualify. While one-time funding from the American
Rescue Plan will help low-income residents with this year’s housing
costs, the bigger problem is the low density of accessible jobs in
Philadelphia, compounded by the city’s dearth of family-sustaining jobs.
Center City District & Central Philadelphia Development Corporation CENTERCITYPHILA.ORGYou can also read


