Reduction of Volatile Organic Compounds (VOCs) Emissions from Laundry Dry-Cleaning by an Integrated Treatment Process of Condensation and Adsorption
←
→
Page content transcription
If your browser does not render page correctly, please read the page content below
processes
Article
Reduction of Volatile Organic Compounds (VOCs) Emissions
from Laundry Dry-Cleaning by an Integrated Treatment Process
of Condensation and Adsorption
Mugeun Song † , Kyunghoon Kim † , Changmin Cho and Daekeun Kim *

                                          Department of Environmental Engineering, Seoul National University of Science and Technology,
                                          Seoul 01811, Korea; qmfel14@naver.com (M.S.); kyunghoon.kim@seoultech.ac.kr (K.K.);
                                          ckdals6284@naver.com (C.C.)
                                          * Correspondence: kimd@seoultech.ac.kr; Tel.: +82-2-970-6606
                                          † These authors contributed equally to this work.

                                          Abstract: Volatile organic compounds (VOCs) are intermittently emitted at high concentrations (tens
                                          of thousands of ppmv) from small-scale laundry shops in urban areas, affecting the urban atmo-
                                          spheric environment. In this study, we suggested integrating VOC treatment processes incorporating
                                          condensation and adsorption in series to remove VOCs released from small-scale laundry dryers
                                          (laundry weighing less than 30 kg). We designed two different processes depending on regeneration
                                          modes for adsorber beds; an open-circuit flow process and a closed-loop flow process in regeneration
                                          mode. Our VOC treatment processes enable sustainable operation via the regeneration of adsorbers
                                          on a regular basis. Before applying the VOC treatment processes, average concentration of total
                                volatile organic compounds (TVOCs) was 4099 ppmv (12,000 ppmv of the peak concentration) during

                                          the drying operation. After applying our closed-loop flow process, TVOC concentration decreased
Citation: Song, M.; Kim, K.; Cho, C.;
                                          to 58 ppmv, leading to 98.5% removal efficiency. We also verified the robustness of our process
Kim, D. Reduction of Volatile Organic
                                          performance in a continuous operation (30 cycles) by using a process simulation program. Lastly, we
Compounds (VOCs) Emissions from
                                          observed that our integrated treatment process can contribute to reductions in ozone and secondary
Laundry Dry-Cleaning by an
Integrated Treatment Process of
                                          organic aerosol generation by 90.4% and 95.9%, respectively. We concluded that our integrated VOC
Condensation and Adsorption.              treatment processes are applicable to small-scale laundry shops releasing high-concentration VOCs
Processes 2021, 9, 1658. https://         intermittently, and are beneficial to the atmospheric environment.
doi.org/10.3390/pr9091658
                                          Keywords: VOC reduction; laundry dry-cleaning; condensation; adsorption; regeneration
Academic Editor: Yifan Li

Received: 12 August 2021
Accepted: 8 September 2021                1. Introduction
Published: 14 September 2021
                                                Volatile organic compounds (VOCs) originate from natural and/or anthropogenic
                                          emission sources, affecting atmospheric environment [1–3]. The anthropogenic emission
Publisher’s Note: MDPI stays neutral
                                          sources of VOCs include internal combustion engine vehicles, large-scale industrial com-
with regard to jurisdictional claims in
                                          plexes, residential combustion, and solvent use [4–6]. Once VOCs are released from their
published maps and institutional affil-
                                          original sources, they have adverse effects on tropospheric chemistry. To be specific, VOCs
iations.
                                          with high reactivity are known to behave as major precursors to produce ozone (O3 ) and
                                          secondary organic aerosols (SOA) via photochemical chemical reactions [7–9]. Moreover,
                                          parts of the VOCs have adverse health effects [10,11] and thus were included in the 187 toxic
                                          air pollutants designated by the United States Environmental Protection Agency [12].
Copyright: © 2021 by the authors.
                                                Among the various anthropogenic emission sources of VOCs, half of VOC emissions are
Licensee MDPI, Basel, Switzerland.
                                          produced by the use of volatile chemical products in industrialized cities in the United States,
This article is an open access article
                                          while the contribution of vehicle emissions has decreased at the same time [5]. McDonald
distributed under the terms and
                                          et al. also found that VOC emission factors (defined as the emitted amount of VOC per
conditions of the Creative Commons
                                          unit product use) of volatile chemical products are one to two orders of magnitude higher
Attribution (CC BY) license (https://
creativecommons.org/licenses/by/
                                          than those of transportation (vehicle emissions). As people in developed countries spend
4.0/).
                                          more than 80% of their time indoors [13], human exposure to VOCs in indoor environments,

Processes 2021, 9, 1658. https://doi.org/10.3390/pr9091658                                               https://www.mdpi.com/journal/processes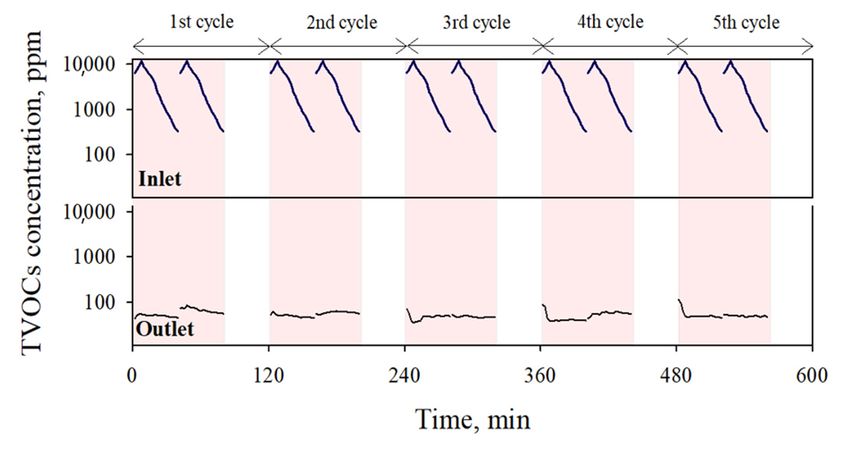
Processes 2021, 9, 1658                                                                                           2 of 12

                          primarily caused by the indoor use of volatile chemical products, can receive increased public
                          attention. Volatile chemical products mainly include pesticides, inks, adhesives, coatings,
                          household cleaning agents, detergents, and personal care products [5,14].
                                Laundry facilities are equipped in the laundry shops and most households, and they
                          use detergents that are composed of various VOCs. In general, laundry processes consist
                          of washing to remove stains and drying to remove water and residual detergents. Our
                          previous study found that 36 VOCs were detected from the exhaust gas of laundry drying
                          machines, and the mass of these VOCs emitted from one cycle of drying operation for 3 kg
                          of cotton fiber was approximately 9 g [15]. It was also found that workers in laundry shops
                          in Republic of Korea might have an increased risk of liver malfunctions [16]. Furthermore,
                          compared to other VOC emission sources (e.g., wastewater treatment, industry), laundry
                          facilities are close to urban residential areas, where NOx and SOx ambient concentrations
                          are higher than in suburban areas [17,18], which may lead to larger production of ozone
                          and SOA with the same amount of VOCs in urban areas. Thus, efforts to reduce VOC
                          emission during laundry processes are necessary to protect indoor air quality, to reduce
                          the health risks of laundry workers; and outdoor air quality, to decrease the production of
                          ozone and SOA in urban areas.
                                Reduction processes of VOCs in the air phase include condensation [19,20] and ad-
                          sorption [21,22]. Condensation has been widely used for recovering VOCs because it
                          requires simple equipment to remove a wide range of VOCs in the air phase and operates
                          at low temperature with lower risk of fire and higher level of operation safety [23]. The
                          condensation process is also useful to remove VOCs in the air phase at high composi-
                          tion (≥1%) [24]. However, the operating cost of condensation can be increased for VOCs
                          at relatively low concentrations because the condensation process for low-concentration
                          VOCs should be operated in cryogenic conditions. Adsorption is another popular method
                          for gas-phase VOC reduction because of its various advantages, including selection of
                          adsorbents according to target VOCs and reusability of adsorbents via regeneration [22,25].
                          Despite these advantages, adsorption is not useful for removing high-concentration VOCs
                          because of the increased time and cost for regenerating adsorbers or replacing them with
                          new ones [23], which may make adsorption unsuitable for the laundry-drying process,
                          which emits high-concentration VOCs intermittently. Therefore, further studies are needed
                          to develop a VOC-reduction process integrating condensation and adsorption into a new
                          configuration, useful for laundry drying.
                                The objectives of the current study were to develop integrated VOC-reduction pro-
                          cesses consisting of adsorption and condensation for small-scale laundry dryers (less
                          than 30 kg of laundry) and evaluate the performance of our processes in multiple ways.
                          Specifically, our integrated VOC-reduction processes were carried out by low-temperature
                          condensation and adsorption/desorption in continuous operation. We prepared two dif-
                          ferent regeneration modes for adsorber beds; open-circuit flow mode and closed-loop
                          flow mode. We also conducted the process simulation to ensure the performance of
                          our integrated VOC-reduction process in a long-term operation. Lastly, to evaluate our
                          VOC-reduction process designed for small-scale dryers, we assessed the reduction in total
                          volatile organic compound (TVOCs) concentration and the contribution of ozone and SOA
                          production after the VOC-reduction process.

                          2. Materials and Methods
                          2.1. Dry-Cleaning Process
                               To simulate dry-cleaning process in laundry shops, we set up the actual size of the
                          washer and dryer in our laboratory and operated the dry-cleaning process according to our
                          survey results of laundry shops (i.e., amount of water used in the cleaning process, amount
                          of detergent, drying temperature, drying time) [26]. For the simulation of the dry-cleaning
                          process, we used two separate processes; a cleaning process followed by a drying process
                          using hot air vented off to the atmosphere. We used a 13 kg washing machine (ESE-7313,
                          Eunsung Engineering, Daegu, Korea), a 15 kg dryer (SR-7615, Ensung Engineering, Daegu,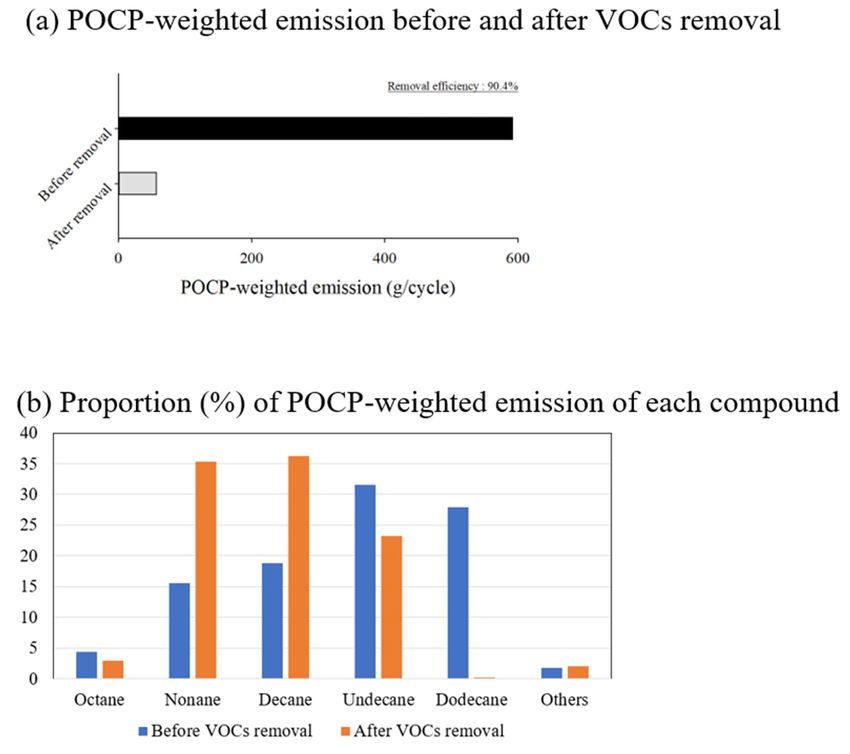
Processes 2021, 9, 1658                                                                                            3 of 12

                          Korea), and an 8 kg/hour electric steam boiler (PHE-5, Pyeonghwa-boiler, Daegu, Korea) to
                          heat the drying air. As a detergent for the cleaning process, we used a petroleum-based
                          organic solvent (KS M 2611DML) that was found to be the most widely used in our previous
                          survey [26]. Primary ingredients of the solvents include n-undecane (43%), decane (34%),
                          n-dodecane (9%), nonane (8%), octane (1%), ethylbenzene (0.87%), meta and para-xylene
                          (0.84%), styrene (0.71%), isopentane (0.66%), and ortho-xylene (0.56%) [15]. For the cleaning
                          and drying processes, we used 3 kg of 100% cotton fiber as laundry. The cleaning process
                          lasted for 23 min and the drying process was operated at 40 ◦ C for 40 min using hot air
                          supplied from the electric steam boiler. More details on the cleaning and drying processes
                          are available elsewhere [15].

                          2.2. VOC-Reduction Process
                               Conceptual layouts of our integrated treatment processes for VOC reduction are
                          shown in Figure S1. The integrated treatment processes included condensation and adsorp-
                          tion in series. We designed two different processes depending on methods of adsorption
                          bed regeneration: (1) a process with open-circuit flow in regeneration mode and (2) a
                          process with closed-loop flow in regeneration mode. For the open-circuit flow process
                          (Figure S1a), we prepared two individual sets of condensation/adsorption (condenser A →
                          adsorption bed A → adsorption bed B → condenser B, or vice versa). The open-circuit flow
                          process with two individual sets aimed to allow each adsorption bed to adsorb or desorb
                          in turn by reversing the process flow. For the closed-loop flow process (Figure S1b), we
                          prepared one condensation/adsorption set only (condenser → adsorption bed). During the
                          regeneration mode of the adsorption bed in the open-circuit flow process, the condenser
                          reduces the partial pressure of VOCs and then the downstream flow from the condenser
                          desorbs VOCs from the adsorption bed for the regeneration. Both the open-circuit flow
                          process and closed-loop flow process have the two-step cycle including the feeding phase
                          (adsorption) and the purging phase (regeneration).
                               To be more specific, Figure 1 shows the full-scale schematic layouts of two inte-
                          grated treatment processes. Firstly, a process with open-circuit flow in regeneration mode
                          (Figure 1a) recovers VOCs existing in the 30–50 ◦ C exhaust gas of a laundry dryer using a
                          condenser. Then, uncondensed VOCs are further introduced into an adsorption bed with
                          a temperature below 0 ◦ C for better adsorption. For the desorption process, feed gas at
                          a temperature of 40 ◦ C is introduced from the upstream condenser/adsorber set to the
                          adsorber of downstream set. Secondly, a process with closed-loop flow in regeneration
                          mode (Figure 1b) enables the internal circulation (2 s per one circulation) of exhaust gas
                          with one set of condenser/adsorber only. The closed-loop flow process aimed to reduce the
                          area needed for the process (area for open-circuit flow process: 1.26 m3 , area for closed-loop
                          flow process: 0.66 m3 ) and further increase the efficiency of VOC reduction from exhaust
                          gas. We regarded 2 adsorptions and 1 desorption as one daily operating cycle with con-
                          sideration for the daily average number of dry-cleaning operations of laundry shops [26].
                          Detailed design parameters for the open-circuit flow process and the closed-loop flow
                          process are provided in Table 1.
                               The condenser employed in our processes used chlorodifluoromethane (CHClF2 ) as
                          a refrigerant in the indirect evaporative cooling system [27]. We estimated theoretical
                          condensation temperature of total volatile organic compounds (TVOCs) using the Antoine
                          equation (National Institute of Standards and Technology, http://webbook.nist.gov, ac-
                          cessed 25 August 2020) and further tuned the condensation temperature considering the
                          TVOC concentration obtained via our measurement.
                               The adsorption process was designed to fill adsorbents inside a cylindrical reactor
                          made of aluminum. We prepared the adsorbent by mixing one commercial adsorbent (i.e.,
                          activated alumina) [28] and two other adsorbents (i.e., porous clay heterostructures, metal
                          organic frameworks) produced in our laboratory [29,30]. More details on the adsorbents
                          are presented in Table 1.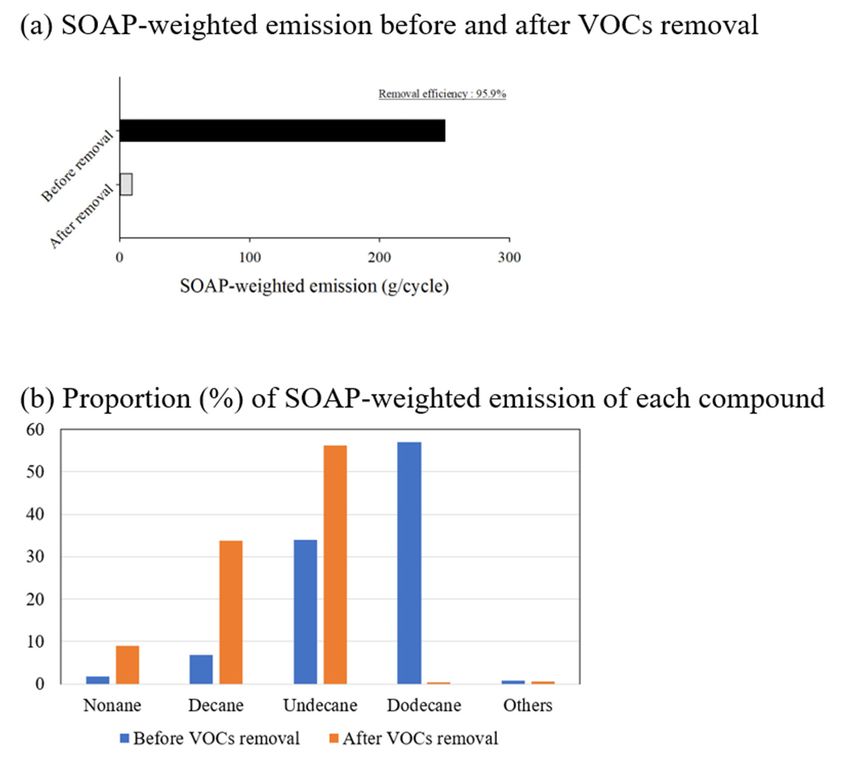
Processes 2021, 9, 1658                                                                                                           4 of 12
Processes 2021, 9, x FOR PEER REVIEW                                                                                            4 of 12

                                  Figure
                                   Figure1.1.Schematic
                                              Schematiclayouts of of
                                                         layouts  two  different
                                                                     two         integrated
                                                                          different         treatment
                                                                                    integrated        processes
                                                                                                treatment       employing
                                                                                                          processes       different
                                                                                                                    employing       gas
                                                                                                                               different
                                  flows and regeneration scheme: (a) open-circuit flow in regeneration mode and (b) closed-loop flow
                                   gas flows and regeneration scheme: (a) open-circuit flow in regeneration mode and (b) closed-loop
                                  in regeneration mode. System configuration of both integrated treatment processes enables sustain-
                                   flow in regeneration mode. System configuration of both integrated treatment processes enables
                                  able operation via regeneration of adsorbent beds.
                                   sustainable operation via regeneration of adsorbent beds.

                                   2.3. The
                                        VOCs condenser
                                               Sampling employed   in our processes used chlorodifluoromethane (CHClF2) as
                                                         and Analysis
                                  a refrigerant in the indirect evaporative cooling system [27]. We estimated theoretical con-
                                         To investigate the VOC-reduction efficiency of our processes, we sampled the ex-
                                  densation temperature of total volatile organic compounds (TVOCs) using the Antoine
                                   haust gas before and after the operation of the VOC-reduction processes. We measured
                                  equation (National Institute of Standards and Technology, http://webbook.nist.gov, ac-
                                   the gas flow rate and its temperature using a flowmeter (TSI-9535, TSI, Shoreview, MN,
                                  cessed
                                   USA). 25WeAugust   2020) and
                                               also measured     further
                                                               the TVOCtuned   the condensation
                                                                          concentration              temperature
                                                                                            in the exhaust          considering
                                                                                                             gas flow            the
                                                                                                                       with a photo-
                                  TVOC    concentration
                                   ionization             obtained
                                               gas detector (NEO MPvia182,
                                                                       our mPower
                                                                           measurement.
                                                                                    Electronics, Santa Clara, CA, USA) that pro-
                                        The  adsorption   process was  designed
                                   duces isobutylene-based TVOCs concentration   to fill adsorbents
                                                                                      with             insideconcentration
                                                                                             the analytical    a cylindricalrange
                                                                                                                             reactor
                                                                                                                                   of
                                  made
                                   0.01–15,000 ppmv. Then, we converted the isobutylene-based TVOCs concentration(i.e.,
                                         of aluminum.   We   prepared the adsorbent  by   mixing   one commercial    adsorbent  into
                                  activated  alumina)
                                   toluene-based       [28] concentration
                                                   TVOCs    and two other using
                                                                           adsorbents   (i.e., porous
                                                                                a calibration    curveclay  heterostructures,
                                                                                                        of toluene            metal
                                                                                                                    standard gas.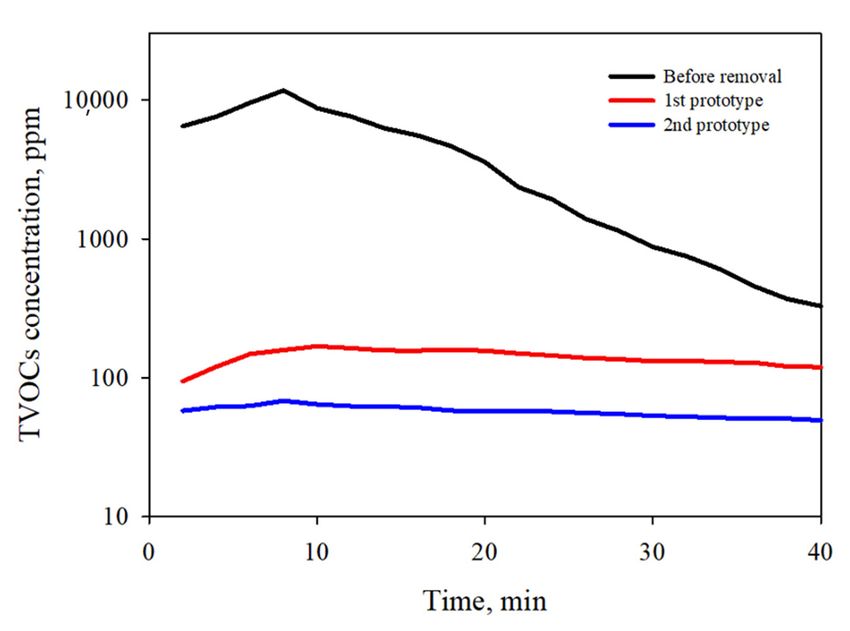
Processes 2021, 9, 1658                                                                                                                         5 of 12

                          Table 1. Design parameters of the two integrated treatment systems suggested in this study.

                                                           Open-Circuit Flow Process                          Closed-Loop Flow Process
                                                                (1st Prototype)                                    (2nd Prototype)
              Total system volume                       1.26 m3 (850 × 1100 × 1350 mm)                     0.66 m3 (500 × 800 × 1650 mm)
                                                                     Condenser
               Maximum power                                         3 kW                                              1.5 kW
              Number of columns                                        1                                                  3
                                                        2 ◦ C (condensation/adsorption)                  −10 ◦ C (condensation/adsorption)
           Condensation temperature
                                                       −8 ◦ C (desorption/condensation)                  −10 ◦ C (desorption/condensation)
                                                                     Adsorber
                 Packed volume                                      0.008 m3                                          0.008 m3
                                                            Activated alumina a (95.8)                        Activated alumina a (88.9)
                   Adsorbent
                                                                   PCH b (2.3)                                      MOF c (11.1)
          (packing volume composition)
                                                                   MOF c (1.9)
                 Space velocity                                     8694 h−1                                           10,928 h−1
                                                                  Heat exchanger
               Maximum power                                            2 kW                                              1 kW
      a Activated alumina (M&E Tech, Hwasung, Korea): 0.4 g of dry-cleaning solvent/g of adsorption capacity and 0.64 g/cm3 of density.
      b Porous clay heterostructures (fabricated in lab.): 0.123 g of toluene/g of adsorption capacity and 0.55 g/cm3 of density. c Metal organic
      frameworks (fabricated in lab.): 0.467 g of toluene/g of adsorption capacity and 0.17 g/cm3 of density.

                                      2.4. Process Simulation
                                           Among two integrated treatment processes, we conducted the process simulation
                                      with the closed-loop flow process to check the robustness in the performance of the ad-
                                      sorption process with a continuous operation. For the simulation, we used a pore and
                                      surface diffusion model (PSDM), which is embedded in an adsorption design software
                                      (AdDesignSTM , Michigan Technological University, Houghton, MI, USA) [31]. Some input
                                      parameters for the process simulation were based on a previous adsorption isothermal
                                      study [32] and details on the input parameters are available in Supplementary Materials
                                      (Table S1). Among the VOCs included in the exhaust gas of laundry dryers, we selected
                                      decane (C10 H22 ) as a representative compound for the process simulation because de-
                                      cane was known to generate the highest mass from one cycle of drying operation among
                                      detergent ingredients [15].

                                      2.5. Effect of the VOC-Reduction Process on the Atmosphere
                                            To quantitatively examine the effect of our VOC-reduction process on the atmospheric
                                      environment, we calculated photochemical ozone creation potential (POCP) and secondary
                                      organic aerosol potential (SOAP) before and after operating our closed-loop flow process.
                                      The POCP is a compound-specific value representing the relative ozone formation potential
                                      of a specific compound, with the POCP value of ethylene set as 100 (a reference value) [33].
                                      In addition, the SOAP represents the potential of a compound to produce secondary organic
                                      aerosols, with the SOAP value of toluene set as 100 (a reference value) [34]. In this study,
                                      we estimated the POCP-weighted emissions and the SOAP-weighted emissions (g/dry-
                                      cleaning cycle) of each VOC with consideration for the emission amount of individual
                                      VOCs [34]. The POCP-weighted emission and SOAP-weighted emission for species, i, were
                                      calculated using below equations.

                                                                    POCPweighted emission = Ei × POCPspecies,i

                                                                    SOAPweighted emission = Ei × SOAPspecies,i
                                      where Ei represents the emission (g/dry-cleaning cycle) of VOC species i, from a one-
                                      time dry-cleaning cycle. We obtained the POCP and SOAP values of each compound via
                                      literature searches [33,34].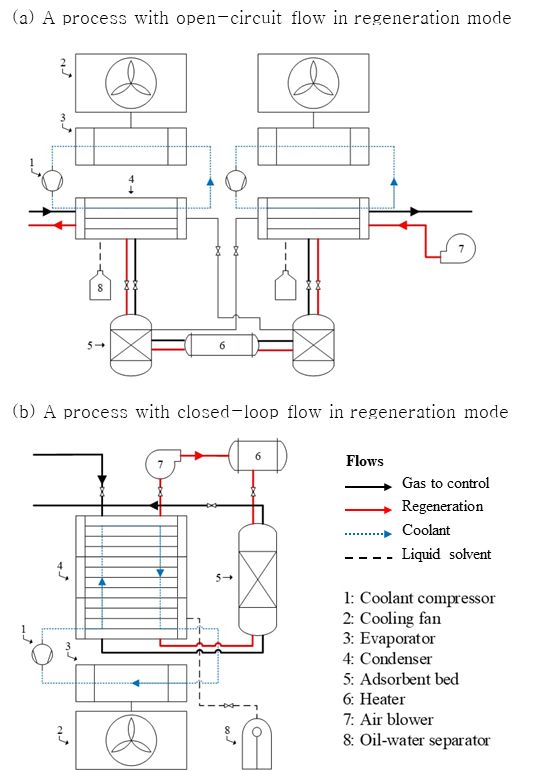
Processes 2021, 9, 1658                                                                                         6 of 12

                               To measure the concentrations of individual compounds, we used Tenax-TA (APK
                          Sorbent Tube, KNR Co., Ltd., Namyangju, Korea) as an adsorbent in adsorbent tubes and
                          analyzed each compound with gas chromatography coupled with mass spectrometry (GC-
                          MS). More details on VOC sampling and analysis are available in our previous study [15].

                          3. Results and Discussion
                          3.1. Determination of VOC-Reduction Process Parameters
                                Firstly, we conducted condensation experiments with different condensation tempera-
                          tures to determine the optimal temperature for VOC removal in our condenser (Figure S2).
                          We found the lower condensation temperature led to higher VOC-removal efficiency, and
                          our experimental results fitted with the theoretical removal efficiency obtained from the
                          Antoine equation (Figure S2a). We also examined the effect of both condensation temper-
                          ature and inlet TVOC concentrations to removal efficiency and found that higher TVOC
                          concentration and lower condensation temperature resulted in higher VOC-removal ef-
                          ficiency in the condenser (maximum 75.1% with 12,000 ppmv and −8 ◦ C) (Figure S2b).
                          Considering these results, we set the optimal condensation temperature of the closed-loop
                          process flow as −10 ◦ C with three condensation columns inside the condenser (Table 1).
                                Secondly, we conducted absorption experiments to examine the effects of space ve-
                          locity and inlet TVOC concentrations on the VOC adsorption capacity of our activated
                          alumina-based adsorber (Figure S3). With toluene as a representative compound, we found
                          that lower space velocity and higher inlet TVOCs concentration led to higher adsorption
                          capacity in the adsorber (maximum 31.7 mg/g with 1800 ppmv and 7000 h−1 ) (Figure S3a).
                          We also conducted adsorption/desorption experiments to obtain the optimal desorption
                          temperature (Figure S3b). We found that 40 ◦ C of desorption temperature resulted in 80.7%
                          desorption of adsorbed toluene. Lastly, we observed that operating temperature (25 ◦ C,
                          40 ◦ C) did not affect the amount of toluene adsorption, but affected desorption.

                          3.2. VOC Reduction
                               Figure 2 shows TVOC concentration in exhaust gas emitted from a laundry dryer
                          before and after applying the integrated treatment processes. TVOC concentration before
                          removal of VOCs started from 7000 ppmv, reached 12,000 ppmv as a maximum concentra-
                          tion after approximately 8 min, and then decreased monotonically down to 300 ppmv at
                          the end of the drying operation (40 min). Average TVOC concentration during the drying
                          operation was 4098.8 ± 3598.3 ppmv before applying the VOC-removal processes, and
                          the total emission amount of TVOCs was estimated as 829.0 ± 15.7 g/cycle. After we
                          removed VOCs using our open-circuit flow process, the average TVOC concentration was
                          140.8 ± 39.0 ppmv and total emission amount was 16.5 ± 5.7 g/cycle, leading to TVOC-
                          removal efficiency of 98.0 ± 0.7%. When we applied the closed-loop flow process, the
                          average TVOC concentration was 57.5 ± 10.6 ppmv, resulting in TVOC-removal efficiency
                          of 98.5 ± 0.3%. Considering the above results, we found that the closed-loop flow process
                          showed the better performance for the VOC removal than the open-circuit flow process.
                          The higher TVOC-removal efficiency of the closed-loop flow process might be caused by
                          the higher number of columns in the condenser (three columns), compared to that in the
                          condenser of the open-circuit flow process (one column) as shown in Table 1.

                          3.3. Long-Term Repetitive Operation of the VOC-Reduction Process
                                To examine the time trend of TVOC-removal efficiency, we repeated five cycles (one cy-
                          cle consisted of two condensation/adsorption processes and one desorption/condensation
                          process) with the closed-loop flow process, which showed the better performance for VOC
                          removal, compared to the open-circuit flow process (Figure 3). During the five cycles
                          of operation for condensation/adsorption, the average TVOCs concentrations for each
                          cycle were as follows: 57.5 ± 10.6 ppmv (first cycle), 53.6 ± 5.8 ppmv (second cycle),
                          46.7 ± 5.6 ppmv (third cycle), 49.6 ± 11.5 ppmv (fourth cycle), and 51.0 ± 12.3 ppmv
                          (fifth cycle). The TVOC-removal efficiency was correspondingly calculated as follows:
Processes 2021, 9, 1658 7 of 12
Processes 2021, 9, x FOR PEER REVIEW 7 of 12
98.5 ± 0.3% (first cycle), 98.2 ± 0.4% (second cycle), 98.6 ± 0.1% (third cycle), 98.4 ± 0.3%
of 98.5 ± cycle),
(fourth and 98.5 ± the
0.3%. Considering 0.0% (fifthresults,
above cycle).we
The TVOC-removal
found efficiency
that the closed-loop was
flow stable
process
across the five cycles, indicating the robustness in the performance of our VOC-removal
showed the better performance for the VOC removal than the open-circuit flow process.
process in the repetitive operation. The time trend of TVOC-removal efficiency using the
The higher TVOC-removal efficiency of the closed-loop flow process might be caused by
open-circuit flow process is available in Supplementary Materials (Figure S4). We found
the higher number of columns in the condenser (three columns), compared to that in the
that the removal efficiency of the closed-loop flow process was higher than that of the
condenser of the open-circuit flow process (one column) as shown in Table 1.
open-circuit flow process throughout the five cycles.
Figure 2. TVOC concentration in the exhaust gas before and after applying the integrated treatment
Figure 2. TVOC concentration in the exhaust gas before and after applying the integrated treatment
processes. Black
processes. Black line
line represents
represents TVOC
TVOCconcentration
concentrationbefore
beforeVOC
VOC removal. The
removal. redred
The lineline
andand
blueblue
line
represent
line the the
represent TVOCTVOCconcentration afterafter
concentration applying the the
applying open-circuit flowflow
open-circuit process andand
process the closed-loop
the closed-
flowflow
loop process, respectively.
process, respectively.
3.4. Process Simulation
3.3. Long-Term Repetitive Operation of the VOC-Reduction Process
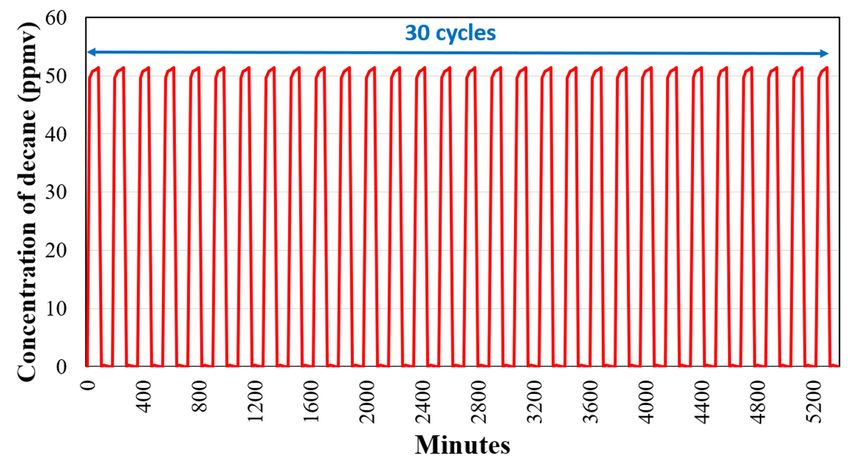
Figure 4 shows the process simulation results using a pore and surface diffusion model
To examine the time trend of TVOC-removal efficiency, we repeated five cycles (one
(PSDM, AdDesignSTM ). With decane as a representative compound, the concentrations at the
cycle consisted of two condensation/adsorption processes and one desorption/condensa-
downstream of the adsorption process ranged between 0 (desorption stage) and 51 (adsorption
tion process) with the closed-loop flow process, which showed the better performance for
stage) ppmv during 30 cycles. The concentration curves in Figure 5 did not increase or diverge
VOC removal, compared to the open-circuit flow process (Figure 3). During the five cycles
across the 30 cycles, indicating that our integrated treatment process showed the most robust
of operation for condensation/adsorption, the average TVOCs concentrations for each cy-
performance in long-term continuous operation for VOC removal. We also observed that
cle were as follows: 57.5 ± 10.6 ppmv (first cycle), 53.6 ± 5.8 ppmv (second cycle), 46.7 ± 5.6
the process simulation results for the adsorption stage (51 ppmv) were consistent with the
ppmv (third cycle), 49.6 ± 11.5 ppmv (fourth cycle), and 51.0 ± 12.3 ppmv (fifth cycle). The
five-cycle real measurement (46.7–57.5 ppmv) shown in Section 3.3.
TVOC-removal efficiency was correspondingly calculated as follows: 98.5 ± 0.3% (first cy-
cle),
3.5. 98.2 ± 0.4%in(second
Reduction cycle), 98.6
POCP-Weighted and± 0.1% (third cycle),
SOAP-Weighted 98.4 ± 0.3% (fourth cycle), and 98.5
Emission
± 0.0% (fifth cycle). The TVOC-removal efficiency was stable across the five cycles, indi-
We found that 56.8 g/cycle of POCP-weighted emissions occurred after applying
cating the robustnessprocess,
the VOC-reduction in the performance
while 591.6 of our VOC-removal
g/cycle process
occurred without theinVOC-reduction
the repetitive
operation. The time trend of TVOC-removal efficiency using the open-circuit
process, leading to a 90.4% reduction in POCP-weighted emission (Figure 5a). flowThe
process
four
isdominant
availablecompounds
in Supplementary Materials
in the exhaust gas(Figure
before S4). We found
applying that the removal
the VOC-reduction efficiency
process were
of the closed-loop
undecane (32.56%),flow process
dodecane was higher
(28.86%), decanethan that ofand
(18.88%), thenonane
open-circuit
(15.50%)flow process
(Figure 5b).
throughout the five cycles.
After applying the VOC-reduction process, the four dominant compounds were decane
(36.24%), nonane (35.27%), undecane (23.24%), and octane (2.98%). VOCs with higher
molecular weight tend to have lower vapor pressure, resulting in higher removal efficiency
in a condenser [35]. This may be the primary reason for the changes in the dominant
compounds and their composition before and after VOC removal.Processes 2021,
Processes 9, x1658
2021, 9, FOR PEER REVIEW 8 8of
of 12
12
Figure 3. TVOCs concentrations of five cycles (one cycle consisted of two condensation/adsorption processes and one
desorption/condensation process) with the closed-loop flow process applied.
3.4. Process Simulation
Figure 4 shows the process simulation results using a pore and surface diffusion
model (PSDM, AdDesignSTM). With decane as a representative compound, the concentra-
tions at the downstream of the adsorption process ranged between 0 (desorption stage)
and 51 (adsorption stage) ppmv during 30 cycles. The concentration curves in Figure 5
did not increase or diverge across the 30 cycles, indicating that our integrated treatment
process showed the most robust performance in long-term continuous operation for VOC
removal. We also observed that the process simulation results for the adsorption stage (51
Figure 3. TVOCs concentrations
ppmv)ofwere
five cycles (one cycle
consistent withconsisted of tworeal
the five-cycle condensation/adsorption processes
measurement (46.7–57.5 ppmv) and one in
shown
Figure 3. TVOCs concentrations of five cycles (one cycle consisted of two condensation/adsorption processes and one
desorption/condensation process) with
Sectionwith the closed-loop flow process applied.
3.3.the closed-loop flow process applied.
desorption/condensation process)
3.4. Process Simulation
Figure 4 shows the process simulation results using a pore and surface diffusion
model (PSDM, AdDesignSTM). With decane as a representative compound, the concentra-
tions at the downstream of the adsorption process ranged between 0 (desorption stage)
and 51 (adsorption stage) ppmv during 30 cycles. The concentration curves in Figure 5
did not increase or diverge across the 30 cycles, indicating that our integrated treatment
process showed the most robust performance in long-term continuous operation for VOC
removal. We also observed that the process simulation results for the adsorption stage (51
ppmv) were consistent with the five-cycle real measurement (46.7–57.5 ppmv) shown in
Section 3.3.
Concentrationofofdecane
Figure 4.4.Concentration
Figure decane (ppmv)
(ppmv) during
during 30 30 cycles
cycles of adsorption/desorption
of adsorption/desorption operations.
operations. One cycle
One cycle (140 con-
(140 min) min)
sisted of two
consisted adsorption
of two processes
adsorption (2 × (2
processes 40×min) and one
40 min) and desorption process
one desorption (60 min).
process (60 min).
We also found that SOAP-weight emission decreased from 250.2 g/cycle (before VOC
removal) to 9.5 g/cycle (after VOC removal), leading to 95.9% reduction in SOAP-weighted
emission (Figure 6a). The dominant compounds and their composition also changed
before and after VOC removal. The four dominant compounds before VOC removal were
dodecane (56.88%), undecane (33.90%), decane (6.75%), and nonane (1.68%) (Figure 6b).
After applying the VOC-reduction process, the four dominant compounds were undecane
(56.28%), decane (33.71%), nonane (8.91%), and dodecane (0.48%). Compounds with higher
molecular weight, such as dodecane, undecane, and decane, had higher reductions in
SOAP-weight emissions after VOC removal: dodecane: 99.9% reduction; undecane: 93.1%
Figure 4. Concentration of decane (ppmv)
reduction; during
and 30 cycles
decane: 79.4%ofreduction.
adsorption/desorption operations. One cycle (140 min) con-
sisted of two adsorption processes (2 × 40 min) and one desorption process (60 min).Processes 2021, 9, 1658 9 of 12
Processes 2021, 9, x FOR PEER REVIEW 9 of 12
Processes 2021, 9, x FOR PEER REVIEW
Figure
Figure5.5.POCP-weighted
POCP-weightedemission andand
emission its proportion of each
its proportion compound
of each beforebefore
compound and after 10 ofapplying
andapplying
after 12
the
theintegrated
integratedtreatment process.
treatment process.
3.5. Reduction in POCP-Weighted and SOAP-Weighted Emission
We found that 56.8 g/cycle of POCP-weighted emissions occurred after applying the
VOC-reduction process, while 591.6 g/cycle occurred without the VOC-reduction process,
leading to a 90.4% reduction in POCP-weighted emission (Figure 5a). The four dominant
compounds in the exhaust gas before applying the VOC-reduction process were undecane
(32.56%), dodecane (28.86%), decane (18.88%), and nonane (15.50%) (Figure 5b). After ap-
plying the VOC-reduction process, the four dominant compounds were decane (36.24%),
nonane (35.27%), undecane (23.24%), and octane (2.98%). VOCs with higher molecular
weight tend to have lower vapor pressure, resulting in higher removal efficiency in a con-
denser [35]. This may be the primary reason for the changes in the dominant compounds
and their composition before and after VOC removal.
We also found that SOAP-weight emission decreased from 250.2 g/cycle (before VOC
removal) to 9.5 g/cycle (after VOC removal), leading to 95.9% reduction in SOAP-
weighted emission (Figure 6a). The dominant compounds and their composition also
changed before and after VOC removal. The four dominant compounds before VOC re-
moval were dodecane (56.88%), undecane (33.90%), decane (6.75%), and nonane (1.68%)
(Figure 6b). After applying the VOC-reduction process, the four dominant compounds
were undecane (56.28%), decane (33.71%), nonane (8.91%), and dodecane (0.48%). Com-
pounds with higher molecular weight, such as dodecane, undecane, and decane, had
higher reductions in SOAP-weight emissions after VOC removal: dodecane: 99.9% reduc-
tion; undecane: 93.1% reduction; and decane: 79.4% reduction.
SOAP-weighted
Figure6.6.SOAP-weighted
Figure emissions
emissions and
and thethe proportion
proportion of each
of each compound
compound before
before and applying
and applying the the
integrated
integratedtreatment
treatmentprocess.
process.
4. Conclusions
In the current study, we suggested integrated treatment processes for removing
VOCs released from laundry dryers. Using the integrated treatment processes, we as-
sessed the VOC-removal efficiency of each process in a continuous repetitive operation
and obtained more than 98% VOC-removal efficiency. The average TVOC concentrationProcesses 2021, 9, 1658 10 of 12
4. Conclusions
In the current study, we suggested integrated treatment processes for removing VOCs
released from laundry dryers. Using the integrated treatment processes, we assessed the
VOC-removal efficiency of each process in a continuous repetitive operation and obtained
more than 98% VOC-removal efficiency. The average TVOC concentration in exhaust gas
decreased from 4100 ppmv (before VOC removal) to 60 ppmv (after VOC removal). We
also examined the robustness of our process in a continuous operation (30 cycles) using
a process simulation model and observed the robust performance of our process during
the continuous operation. We also quantitatively assessed the effect of our VOC-reduction
process on atmospheric environment and obtained 90.4% reduction in POCP-weighted
emissions and 95.9% reduction in SOAP-weighted emissions. Based on our findings in
this study, we concluded that (1) our integrated treatment processes for VOC removal are
applicable to small-scale laundry shops releasing high concentration VOCs intermittently,
and (2) the VOC reduction using our integrated treatment processes is beneficial to the
atmospheric environment with respect to ozone and SOA generation. Further studies are
recommended to investigate VOC emission sources in urban areas besides small-scale
laundry shops (e.g., restaurants, printing shops) and examine the applicability of our
integrated VOC-reduction process.
Supplementary Materials: The following are available online at https://www.mdpi.com/article/
10.3390/pr9091658/s1: Figure S1: Conceptual layouts of two different integrated treatment processes:
(a) a process with open-circuit flow in regeneration mode and (b) a process with closed-loop flow in
regeneration mode; Figure S2: Condensation efficiency of vaporized dry-cleaning solvents from the
dry-cleaning process as a function of applied temperature and inlet TVOC concentration; Figure S3:
The effect of process parameters on adsorption and desorption on activated alumina as an adsorbent;
Figure S4: TVOC concentrations of five cycles (one cycle consisting of two condensation/adsorption
processes and one desorption/condensation process) with the open-circuit flow process applied;
Figure S5: Toluene concentration during an adsorption/desorption experiment in a laboratory scale;
Table S1: Input parameters for adsorption/desorption model simulation.
Author Contributions: Conceptualization, M.S. and C.C.; methodology, M.S. and C.C.; software,
M.S. and K.K.; validation, K.K. and D.K.; formal analysis, M.S.; investigation, M.S.; resources, D.K.;
data curation, M.S.; writing—original draft preparation, M.S. and K.K.; writing—review and editing,
K.K. and D.K.; visualization, M.S. and K.K.; supervision, D.K.; project administration, D.K.; funding
acquisition, D.K. All authors have read and agreed to the published version of the manuscript.
Funding: This work was funded by the Ministry of Science (Sejong-si, Korea), ICT (2017M1A2A2086647).
Institutional Review Board Statement: Not applicable.
Informed Consent Statement: Not applicable.
Data Availability Statement: All data have been included in this manuscript.
Acknowledgments: This work was supported by the Technology Development Program to Solve
Climate Changes of the National Research Foundation (NRF) funded by the Ministry of Science, ICT
(2017M1A2A2086647). K. Kim acknowledges the financial support from Seoul National University of
Science and Technology.
Conflicts of Interest: The authors declare no conflict of interest.
References
1. Goldstein, A.H.; Galbally, I.E. Known and unexplored organic constituents in the earth’s atmosphere. Environ. Sci. Technol.
2007, 41, 1514–1521. [CrossRef]
2. Sahu, L.K.; Saxena, P. High time and mass resolved PTR-TOF-MS measurements of VOCs at an urban site of India during winter:
Role of anthropogenic, biomass burning, biogenic and photochemical sources. Atmos. Res. 2015, 164, 84–94. [CrossRef]
3. Velasco, E.; Lamb, B.; Westberg, H.; Allwine, E.; Sosa, G.; Arriaga-Colina, J.L.; Jobson, B.T.; Alexander, M.L.; Prazeller, P.;
Knighton, W.B.; et al. Distribution, magnitudes, reactivities, ratios and diurnal patterns of volatile organic compounds in the
Valley of Mexico during the MCMA 2002 & 2003 field campaigns. Atmos. Chem. Phys. 2007, 7, 329–353.Processes 2021, 9, 1658 11 of 12
4. Cetin, E.; Odabasi, M.; Seyfioglu, R. Ambient volatile organic compound (VOC) concentrations around a petrochemical complex
and a petroleum refinery. Sci. Total Environ. 2003, 312, 103–112. [CrossRef]
5. McDonald, B.C.; De Gouw, J.A.; Gilman, J.B.; Jathar, S.H.; Akherati, A.; Cappa, C.D.; Jimenez, J.L.; Lee-Taylor, J.; Hayes, P.L.;
McKeen, S.A.; et al. Volatile chemical products emerging as largest petrochemical source of urban organic emissions. Science
2018, 359, 760–764. [CrossRef]
6. Yuan, B.; Shao, M.; Lu, S.; Wang, B. Source profiles of volatile organic compounds associated with solvent use in Beijing, China.
Atmos. Environ. 2010, 44, 1919–1926. [CrossRef]
7. Liu, H.; Liu, S.; Xue, B.; Lv, Z.; Meng, Z.; Yang, X.; Xue, T.; Yu, Q.; He, K. Ground-level ozone pollution and its health impacts in
China. Atmos. Environ. 2018, 173, 223–230. [CrossRef]
8. Liu, Y.; Shao, M.; Fu, L.; Lu, S.; Zeng, L.; Tang, D. Source profiles of volatile organic compounds (VOCs) measured in China: Part
I. Atmos. Environ. 2008, 42, 6247–6260. [CrossRef]
9. Shin, M.H.; McKone, T.E.; Bennett, D.H. Contribution of low vapor pressure-volatile organic compounds (LVP-VOCs) from
consumer products to ozone formation in urban atmospheres. Atmos. Environ. 2015, 108, 98–106. [CrossRef]
10. Huang, B.; Lei, C.; Wei, C.; Zeng, G. Chlorinated volatile organic compounds (Cl-VOCs) in environment—Sources, potential
human health impacts, and current remediation technologies. Environ. Int. 2014, 71, 118–138. [CrossRef]
11. Shuai, J.; Kim, S.; Ryu, H.; Park, J.; Lee, C.K.; Kim, G.B.; Ultra, V.U.; Yang, W. Health risk assessment of volatile organic compounds
exposure near Daegu dyeing industrial complex in South Korea. BMC Public Health 2018, 18, 528. [CrossRef] [PubMed]
12. United States Environmental Protection Agency. Initial List of Hazardous air Pollutants with Modifications. 1990. Available
online: https://www.epa.gov/haps/initial-list-hazardous-air-pollutants-modifications (accessed on 8 July 2021).
13. Klepeis, N.E.; Nelson, W.C.; Ott, W.R.; Robinson, J.P.; Tsang, A.M.; Switzer, P.; Behar, J.V.; Hern, S.C.; Engelmann, W.H. The
National Human Activity Pattern Survey (NHAPS): A resource for assessing exposure to environmental pollutants. J. Expo. Anal.
Environ. Epidemiol. 2001, 11, 231–252. [CrossRef] [PubMed]
14. Stockwell, C.E.; Coggon, M.M.; Gkatzelis, G.I.; Ortega, J.; McDonald, B.C.; Peischl, J.; Aikin, K.; Gilman, J.B.; Trainer, M.;
Warneke, C. Volatile organic compound emissions from solvent- and water-borne coatings—Compositional differences and tracer
compound identifications. Atmos. Chem. Phys. 2021, 21, 6005–6022. [CrossRef]
15. Lee, H.; Kim, K.; Choi, Y.; Kim, D. Emissions of Volatile Organic Compounds (VOCs) from an Open-Circuit Dry Cleaning Machine
Using a Petroleum-Based Organic Solvent: Implications for Impacts on Air Quality. Atmosphere 2021, 12, 637. [CrossRef]
16. Park, O.H.; Lee, K.S.; Min, K.W.; Cho, G.W.; Yoon, K.J.; Jeong, W.S.; Cho, Y.G.; Kim, E.S.; Yang, J.S. Generating characteristics
of VOCs in a commercial laundry shop and the effects on the health of workers. J. Korean Soc. Occup. Environ. Hyg. 2016, 26,
159–169. [CrossRef]
17. Huang, D.; Li, Q.; Wang, X.; Li, G.; Sun, L.; He, B.; Zhang, L.; Zhang, C. Characteristics and Trends of Ambient Ozone and
Nitrogen Oxides at Urban, Suburban, and Rural Sites from 2011 to 2017 in Shenzhen, China. Sustainability 2018, 10, 4530.
[CrossRef]
18. Ryu, J.; Park, C.; Jeon, S.W. Mapping and Statistical Analysis of NO2 Concentration for Local Government Air Quality Regulation.
Sustainability 2019, 11, 3809. [CrossRef]
19. Ding, Y. Volatile Organic Compound Liquid Recovery by the Dead End Gas Separation Membrane Process: Theory and Process
Simulation. Ind. Eng. Chem. Res. 2019, 58, 5008–5017. [CrossRef]
20. Rinner, M.; Kind, M.; Schlünder, E.U. Separated solvent recovery from waste gas with cryo-condensation. Sep. Purif. Technol.
2002, 29, 95–104. [CrossRef]
21. Lillo-Ródenas, M.A.; Cazorla-Amorós, D.; Linares-Solano, A. Behaviour of activated carbons with different pore size distributions
and surface oxygen groups for benzene and toluene adsorption at low concentrations. Carbon 2005, 43, 1758–1767. [CrossRef]
22. Sui, H.; Liu, H.; An, P.; He, L.; Li, X.; Cong, S. Application of silica gel in removing high concentrations toluene vapor by
adsorption and desorption process. J. Taiwan Inst. Chem. Eng. 2017, 74, 218–224. [CrossRef]
23. Li, X.; Ma, J.; Ling, X. Design and dynamic behaviour investigation of a novel VOC recovery system based on a deep condensation
process. Cryogenics 2020, 107, 103060. [CrossRef]
24. Gupta, V.K.; Verma, N. Removal of volatile organic compounds by cryogenic condensation followed by adsorption. Chem. Eng.
Sci. 2002, 57, 2679–2696. [CrossRef]
25. Vellingiri, K.; Kumar, P.; Deep, A.; Kim, K.H. Metal-organic frameworks for the adsorption of gaseous toluene under ambient
temperature and pressure. Chem. Eng. J. 2017, 307, 1116–1126. [CrossRef]
26. Lee, H.J.; Song, M.G.; Kim, D.K. Estimation of emissions and emission factor of volatile organic compounds from small-scale dry
cleaning operations using organic solvents. J. Korean Soc. Atmos. Environ. 2019, 35, 413–422. [CrossRef]
27. Buker, M.S.; Mempouo, B.; Riffat, S.B. Experimental investigation of a building integrated photovoltaic/thermal roof collector
combined with a liquid desiccant enhanced indirect evaporative cooling system. Energy Convers. Manag. 2015, 101, 239–254.
[CrossRef]
28. Kim, D.; Park, J.M.; Lee, S.S. Evaluation of Non-Carbon Adsorbents for the Removal of Volatile Organic Compounds Emitted
from Laundry Facilities. J. Korean Soc. Atmos. Environ. 2021, 37, 91–101. [CrossRef]
29. Yang, P.; Song, M.; Kim, D.; Jung, S.P.; Hwang, Y. Synthesis conditions of porous clay heterostructure (PCH) optimized for volatile
organic compounds (VOC) adsorption. Korean J. Chem. Eng. 2019, 36, 1806–1813. [CrossRef]Processes 2021, 9, 1658 12 of 12
30. Vo, T.K.; Quang, D.T.; Song, M.; Kim, D.; Kim, J. Rapid defect engineering of UiO-67 (Zr) via microwave-assisted continuous-flow
synthesis: Effects of modulator species and concentration on the toluene adsorption. Microporous Mesoporous Mater. 2020, 306, 110405.
[CrossRef]
31. Mertz, K.A.; Gobin, F.; Hand, D.W.; Hokanson, D.R.; Crittenden, J.C. Adsorption Design Software for Windows; Elf Aquitaine, Inc.:
Houghton, MI, USA, 1994.
32. Kim, D.; Sorial, G.A. Comparative study of gas phase adsorption of volatile organic compounds on two types of activated carbon.
Abstr. Pap. Am. Chem. Soc. 2004, 227, U811.
33. Wu, W.; Zhao, B.; Wang, S.; Hao, J. Ozone and secondary organic aerosol formation potential from anthropogenic volatile organic
compounds emissions in China. J. Environ. Sci. 2017, 53, 224–237. [CrossRef] [PubMed]
34. Derwent, R.G.; Jenkin, M.E.; Utembe, S.R.; Shallcross, D.E.; Murrells, T.P.; Passant, N.R. Secondary organic aerosol formation
from a large number of reactive man-made organic compounds. Sci. Total Environ. 2010, 408, 3374–3381. [CrossRef] [PubMed]
35. Lin, Y.C.; Chang, F.T.; Bai, H.; Pei, B.S. Control of VOCs emissions by condenser pre-treatment in a semiconductor fab. J. Hazard.
Mater. 2005, 120, 9–14. [CrossRef] [PubMed]You can also read


