Visual exploration of intracranial aneurysm blood flow adapted to the clinical researcher
←
→
Page content transcription
If your browser does not render page correctly, please read the page content below
EUROGRAPHICS 2021/ S. Oeltze-Jafra and R.G. Raidou Dirk Bartz Prize
Visual exploration of intracranial aneurysm blood flow adapted to
the clinical researcher
B. Behrendt1 , W. Engelke2 , P. Berg3,4 , O. Beuing5 , I. Hotz2 , B. Preim1 and S. Saalfeld1,4
1Department of Simulation and Graphics, University of Magdeburg, Germany
2 Department of Science and Technology, Linköping University, Sweden
3 Department of Fluid Dynamics and Technical Flows, University of Magdeburg, Germany
4 Research Campus STIMULATE
5 Institute of Neuroradiology, University Hospital Magdeburg, Germany
Visual Exploration of Intracranial
a) PCD & Glass Lighting [BBPS17, BBB∗ 18] Intracranial Aneurysm Blood Flow b) Surface Patch Selection [BBB∗ 18]
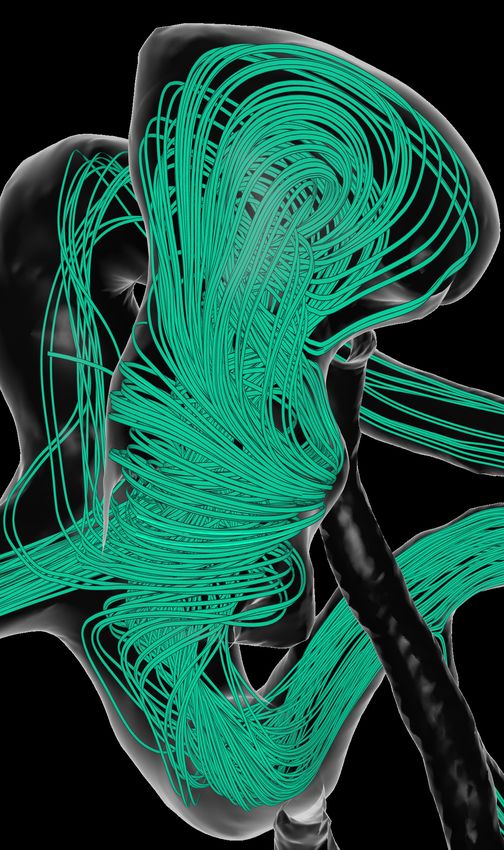
c) Color-Coded Pathline Bundles [BBB∗ 18] d) Evolutionary Seeding [BEB∗ 19]
Figure 1: Components of our visual exploration framework
Abstract
Rupture risk assessment is a key to devise patient-specific treatment plans of cerebral aneurysms. To understand and predict
the development of aneurysms and other vascular diseases over time, both hemodynamic flow patterns and their effect on the
vessel surface need to be analyzed. Flow structures close to the vessel wall often correlate directly with local changes in surface
parameters, such as pressure or wall shear stress. However, especially for the identification of specific blood flow characteristics
that cause local startling parameters on the vessel surface, like elevated pressure values, an interactive analysis tool is missing.
In order to find meaningful structures in the entirety of the flow, the data has to be filtered based on the respective explorative
aim. Thus, we present a combination of visualization, filtering and interaction techniques for explorative analysis of blood flow
with a focus on the relation of local surface parameters and underlying flow structures. In combination with a filtering-based
approach, we propose the usage of evolutionary algorithms to reduce the overhead of computing pathlines that do not contribute
to the analysis, while simultaneously reducing the undersampling artifacts. We present clinical cases to demonstrate the benefits
of both our filter-based and evolutionary approach and showcase its potential for patient-specific treatment plans.
CCS Concepts
• Human-centered computing → Scientific visualization;
© 2021 The Author(s)
Eurographics Proceedings © 2021 The Eurographics Association.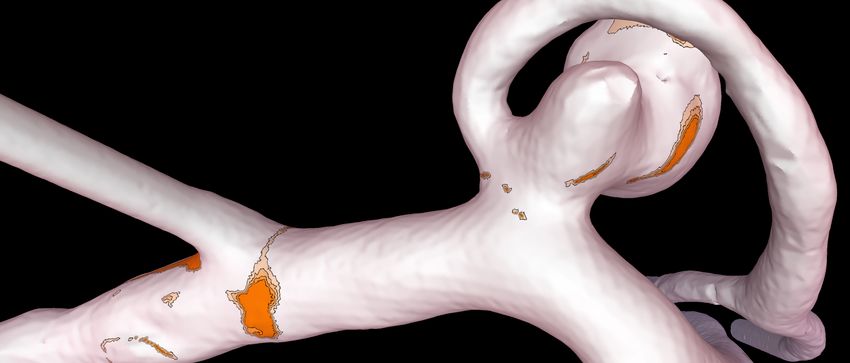
B. Behrendt & W. Engelke & P. Berg & O. Beuing & I. Hotz & B. Preim & S. Saalfeld / Visual exploration of intracranial aneurysm blood flow

1. Introduction                                                                namica parameter values. Additional visualization tools, such as a
                                                                               perception-oriented pseudo-chromadepth color overlay [BBPS17],
Intracranial aneurysms are pathologic dilatations of the intracra-
                                                                               support this approach.
nial vessel wall that bear the risk of rupture with fatal conse-
quences for the patient. Since treatment of complex cases might
cause a rupture as well, treatment or a monitoring strategy have               3.1. Surface-based Pathline Filtering
to be carefully evaluated. Thus, aneurysm rupture risk remains an              Our work [BBB∗ 18] was designed in cooperation with an expe-
active research area. Various scores (e.g. PHASES [GWBJ∗ 14],                  rienced neuroradiologist to identify complex interactions between
UIATS [EBB∗ 15]) have been developed and postulated to assist                  hemodynamic parameters in general, and combines the tasks of pa-
interventional neuroradiologists, most of which have pitfalls or               rameter visualization and pathline selection to create an intuitive
do not satisfactorily incorporate hemodynamic analyses. However,               and robust tool for explorative pathline filtering.
quantitative parameters have a large potential for aneurysm analy-
sis [CMWP11] and have been successfully employed to built up an                Vessel Visualization and Surface Patch Selection
intracranial aneurysm rupture risk prediction model [DCM∗ 18].
                                                                               Initially, the user is presented with an empty visualization of the
   Nowadays, there is a large gap between the state of the art in              vessel surface. To prevent the surface from occluding the inner flow
flow visualization with very complex techniques, which are often               that the user will eventually add, we implemented a glass lighting
impractical or simply too overloaded with information for our clin-            approach to facilitate a transparent visualization (Fig. 1a). Sim-
ical cooperation partners in daily clinical practice, and the patient-         ilar to the approach by Gasteiger et al. [GNKP10], the lighting
specific analysis of aneurysms at risk. Apart from solely rupture              intensity is multiplied with the vessel opacity for each vertex, al-
risk assessment, physicians are also interested in the complex in-             though we consider both the traditional Phong lighting as well as
teraction between hemodynamics and wall properties. Simply dis-                an additional Fresnel mask for this. To support depth perception a
playing pathlines inside of the vessel anatomy using established               psuedo-chromedepth color overlay can be enabled, tinting the ves-
smart visibility techniques would therefore likely produce unsat-              sel edges using a depth-based color gradient ranging from red to
isfactory results. Filtering pathlines based on parameters such as             blue (Fig. 1a) [BBPS17].
velocity magnitude or vorticity reduces occlusion of the vessel sur-              To add pathlines to the visualization, the user has to select at
face, thus allowing both to be displayed in the same view. However,            least one area ("patch") on the vessel surface based on surface pa-
in an explorative scenario where the physician wants to figure out             rameters. For this task the surface is rendered fully opaque with
what kind of flow causes a specific phenomenon on the vessel sur-              parameters mapped using a color scale. In order to highlight inter-
face, the use of such filters can be obstructive.                              esting hotspots, which are characterized by local extrema of sur-
                                                                               face parameter values, we employ discretized color scales with
2. Related Work                                                                black boundaries between the shades (Fig. 1b). The user can freely
                                                                               choose from a set of predefined color scales and configure the
Various methods have been developed explicitly for the explorative             amount of discrete shades. A surface region can be selected from
visualization of medical flow data [OJMN∗ 18]. Geometry-based                  this visualization by clicking on the vessel. The application will
techniques, such as streamlines or pathlines, are the most frequently          determine the closest surface vertex to the curser and, based on the
used methods for flow analysis [MLP∗ 10]. The biggest challenge                users’ preference, select all adjacent vertices with the same shade
of these methods is to avoid clutter and occlusion without miss-               or within a fixed distance, i. e. a circular patch.
ing important features in the data, as interesting structures, such
as vortices, are often hidden within more laminar flow. Born et al.            Pathline Visualization
adapted line predicates to support the exploration of cardiac blood
flow by designing a set of predefined predicates [BPM∗ 13]. Gün-               After the user completes the selection of interesting surface regions,
ther et al. [GRT13] presented an implicit filtering approach which             the surface visualization reverts to glass lighting. Users can now
modulates the line transparency with respect to view-dependent oc-             choose a distance to extract pathlines from. Only pathlines where
clusion and an importance criterion. A common issue with filtering             at least one vertex is within the selected distance to the surface
approaches is the dismissal of a high percentage of the calculated             patch is included in the line bundle associated with that patch. If
lines, which is unfavorable in cases where the line integration is             the user has selected multiple patches on the surface, the distance
expensive. Van Pelt et al. [vBB∗ 11] include dynamic seeding capa-             threshold can be configured individually for each patch and the re-
bilities in their explorative framework to overcome this issue. Sim-           sulting pathline bundles are colored according to the patches they
ilarly, de Hoon et al. [dHLJ∗ 19] use particles to simulate injecting          belong to (Fig. 1c).
ink into a vessel at a specific location. To automatically determine              To further refine the previously selected lines, pathline bundles
potentially interesting seeding locations in a flow field, Broos et al.        can be filtered based on their parameters, such as pressure or veloc-
employ user-defined transfer functions [BHK∗ 16].                              ity. One way of filtering the bundles is to map their hemodynamic
                                                                               parameters to line thickness or opacity, effectively reducing the vis-
                                                                               ibility of lines with certain high or low parameter values. Instead of
3. Visual Exploration Techniques
                                                                               implicitly filtering pathlines using thickness or opacity, the user can
We present a set of techniques to interactively find flow structures           explicitly select parameter ranges in a scatterplot, parallel coordi-
based on desired properties or their effect on the vessel wall. Re-            nates view or line chart of the current pathline bundle by drawing a
gions on the wall can be directly selected based on their hemody-              selection rectangle.

                                                                                                                                               © 2021 The Author(s)
                                                                                                        Eurographics Proceedings © 2021 The Eurographics Association.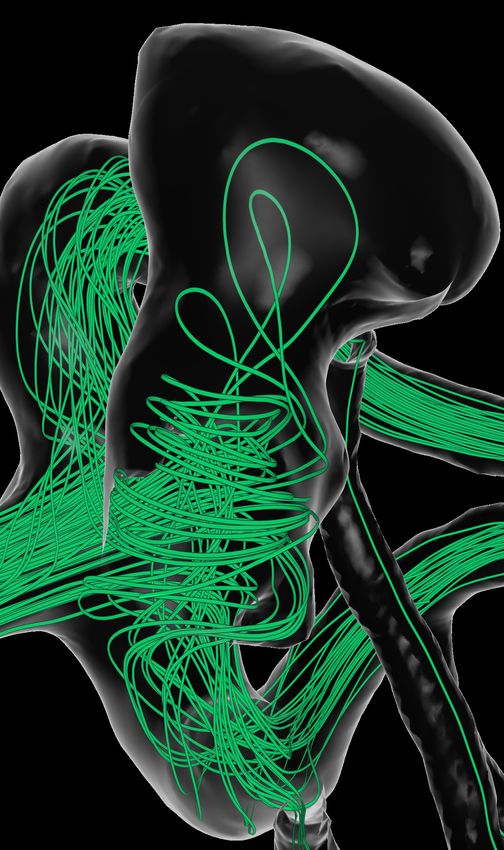
B. Behrendt & W. Engelke & P. Berg & O. Beuing & I. Hotz & B. Preim & S. Saalfeld / Visual exploration of intracranial aneurysm blood flow

Flow Statistics Calculation and Report Generation                               the vessel surface close to the pathlines (such as pressure or wall
                                                                                shear stress). Both length and curvature of a pathline can indicate
Based on feedback from our collaborating physicians, we added the
                                                                                the presence of vortex structures, as a pathline is often longer and
option to calculate various quantitative measures concerning both
                                                                                has higher curvature when passing through a vortex. Additionally,
the selected patches and associated pathline bundles, and export
                                                                                all indicator values for pathline vertices outside the aneurysm can
them in a standardized manner. For patches, we calculate the sur-
                                                                                be disregarded, effectively preventing surface attributes outside of
face area and average values for all available hemodynamic param-
                                                                                the aneurysm from contributing to the fitness of a line. Each local
eters over the entire patch. For pathline bundles associated to the
                                                                                pathline property f p (Ii ) is assembled from the per-vertex fitness in-
patches, we calculate the average flow velocity over all pathlines
                                                                                dicators vi j . The final fitness value for a pathline is the weighted
of the bundle. As the physicians are often specifically interested
                                                                                combination of all its pathline properties.
in the flow velocity within the aneurysm, we additionally compute
the average flow velocity of the pathline sections between entering
and leaving the aneurysm. The average velocity of pathline bun-                 4. Evaluation
dle sections close to the respective surface patch are also displayed
                                                                                To evaluate our surface selection method, we asked two experi-
based on default distances which can be freely configured. These
                                                                                enced neuroradiologists (Physician A, who was involved in the de-
values are calculated individually for each surface patch and ex-
                                                                                sign process of our framework, and Physician B) and an expert in
ported either as a CSV file or together with an automatically gen-
                                                                                flow simulation to apply it to nine aneurysms and recorded their
erated screenshot of the patch and pathlines as a PDF report.
                                                                                findings. All three experts described our method as an advance-
                                                                                ment in the field of explorative flow visualization. All experts de-
3.2. Evolutionary Pathline Generation                                           scribed our method as an advancement in the field of explorative
                                                                                flow visualization. They were able to quickly find interesting sur-
Many existing approaches rely on filtering pre-integrated pathlines.
                                                                                face regions that almost always yielded interesting flow patterns
Especially for instationary flow, the seed points for interesting path-
                                                                                such as vortices when selected. The color-coding proved especially
lines are often sparsely distributed in the seeding domain and can
                                                                                useful for assessing which adjacent vessels a particular flow pattern
therefore easily be missed, even when seeding a high amount of
                                                                                drains into. According to the experts, a precise selection of specific
pathlines. Thus, high computational costs are required for path-
                                                                                flow patterns based on their relation to surface features has previ-
lines that will never be shown, while still having no guarantee to
                                                                                ously not been possible. They highly appreciated the visualization
find the features of interest. Recently, Engelke et al. [EH18] in-
                                                                                of splitting flow. Overall, our combination of interaction, visualiza-
troduced evolutionary streamlines for the analysis of steady flows.
                                                                                tion and filtering techniques allows for systematic exploration and
This approach is extended and adapted for the integration in our ex-
                                                                                qualitative assessment of flow structures.
ploration framework to generate evolutionary pathlines [BEB∗ 19].
A set of predefined fitness functions supports the automatic extrac-               Physician A was primarily interested in patches with either high
tion of a set of representative pathlines for flow patterns of patient          or low normalized wall shear stress or high OSI. To facilitate com-
groups with high anatomical variations, including aneurysm blebs                parability between datasets, the expert used similar or identical pa-
or strongly lobulated shapes. The input to the evolutionary algo-               rameter ranges for the placement of surface patches and the extrac-
rithm is the aneurysm geometry and the simulated blood flow. For                tion of pathlines. The expert also used the line chart to determine if
each iteration ("generation"), the evolutionary algorithm generates             a pathline bundle contains more than one actual vortex structure by
a set of pathlines and evaluates each line based on user-defined fit-           plotting the residence time over flow distance. Since settings, such
ness criteria. This set consists of the best lines from the previous            as mapped surface parameter, number of color scale shades or cus-
generation ("elite"), modified variations of good lines from the pre-           tom parameter ranges were reset to a default value when switching
vious generation ("mutation") and newly generated random lines                  between datasets, he wished for a way to change the default val-
("insertion"). This cycle continues for a set number of iterations, or          ues or create custom presets to accelerate the process of placing
until a specific average fitness of the current pathline generation is          patches. Physician B was primarily interested in visualizing split-
reached.                                                                        ting flow in aneurysms for the purpose of optimal flow diverter
                                                                                placement. While experienced neuroradiologists are often able to
   A plane is automatically fitted in the vessel inlet, which serves
                                                                                infer this information from the wall geometry alone, visualizing
as seeding plane for the pathline generation. The genome of the in-
                                                                                the splitting flow could be a valuable help to less experienced neu-
dividuals encodes a single seed point Ii = (xi , yi ) in the local coor-
                                                                                roradiologists. Since the expert had limited interest in correlating
dinate system of the seeding plane, which uniquely defines a path-
                                                                                flow structures with surface parameters, she mostly placed patches
line with respect to the integration settings. New individuals are
                                                                                based on geometric features, such as blebs or the aneurysm dome.
always initialized with random values in their genome, i.e. spawn
from a random position on the seed plane. Mutation is facilitated                  All experts expressed their interest in being able to further quan-
by a weighted displacement vector d~ ∈ [−1.0, 1.0]d to the indi-                tify various aspects of their exploration results, such as measuring
vidual’s genome; here, d is the dimension of the search space. To               the size and extent of detected structures. More complex measures,
evaluate the fitness of an individual, the entire pathline has to be            such as the amount of flow that passes through a certain structure
integrated from its seed point. The fitness function f (Ii ) is assem-          or directly underneath a surface patch, would be desirable as well.
bled from a set of local properties f1 .. fn . The properties are com-          Another requested feature was the ability to place a plane into the
prised of fitness information based on pathline geometry (such as               parent vessel of an aneurysm and map the attributes and spatial po-
length or curvature) and fitness information based on attributes of             sitions of pathlines passing through it to generate a flow profile.

© 2021 The Author(s)
Eurographics Proceedings © 2021 The Eurographics Association.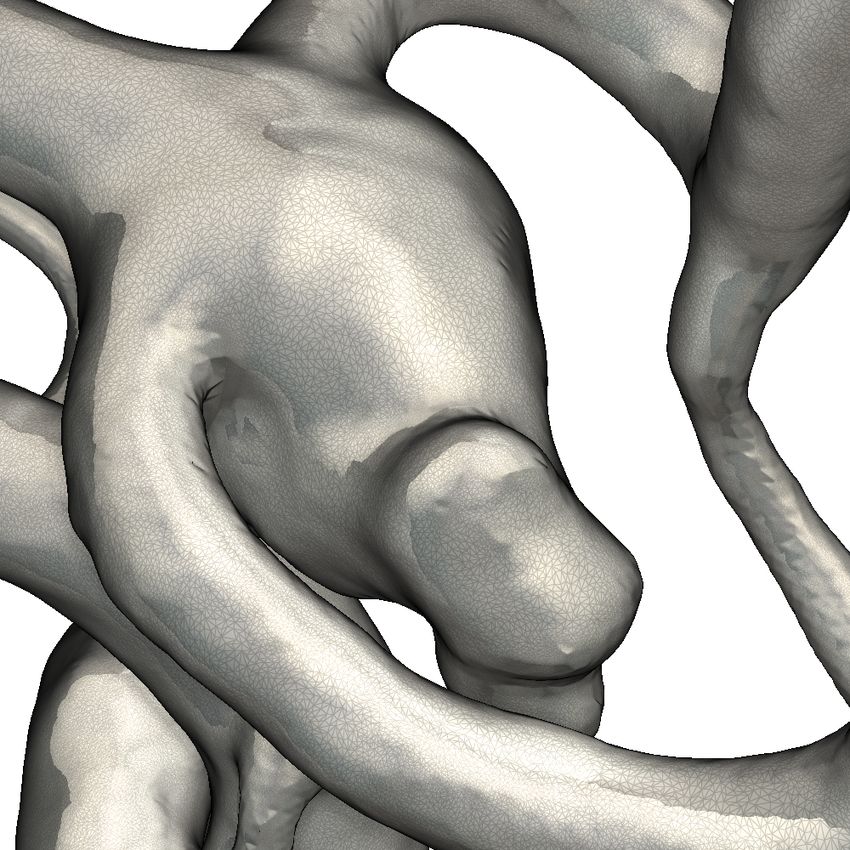
B. Behrendt & W. Engelke & P. Berg & O. Beuing & I. Hotz & B. Preim & S. Saalfeld / Visual exploration of intracranial aneurysm blood flow
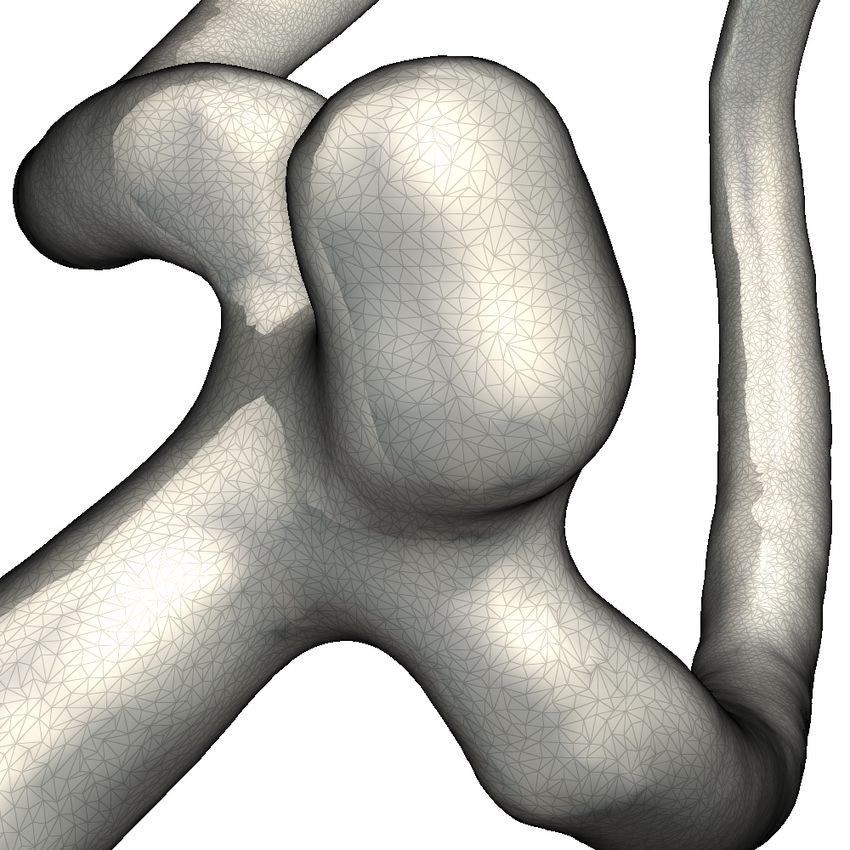
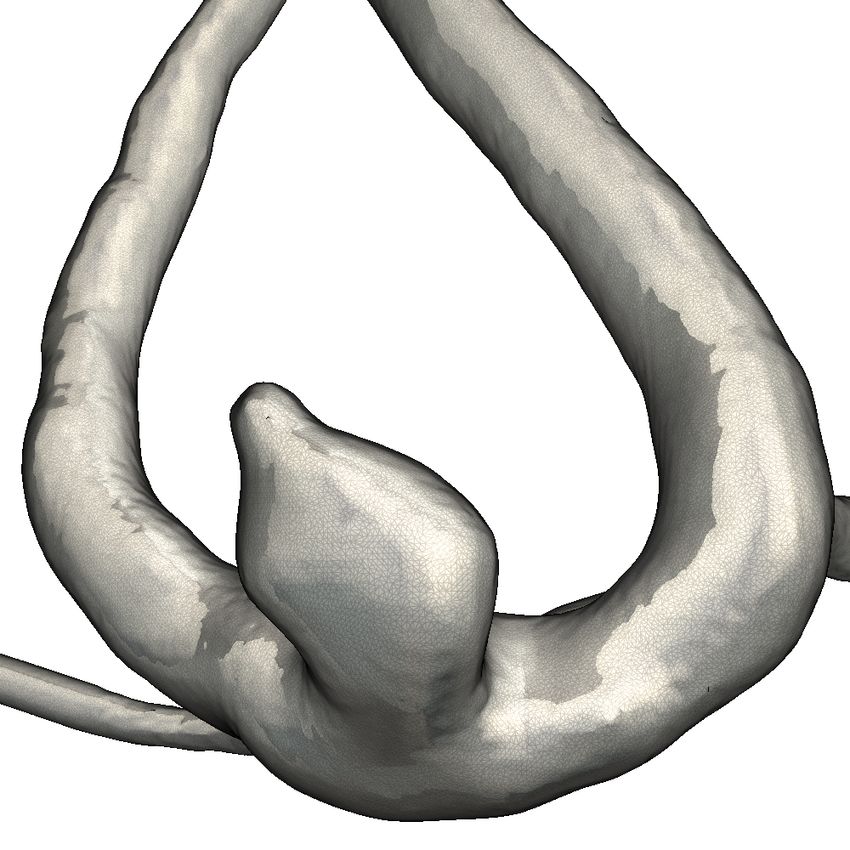
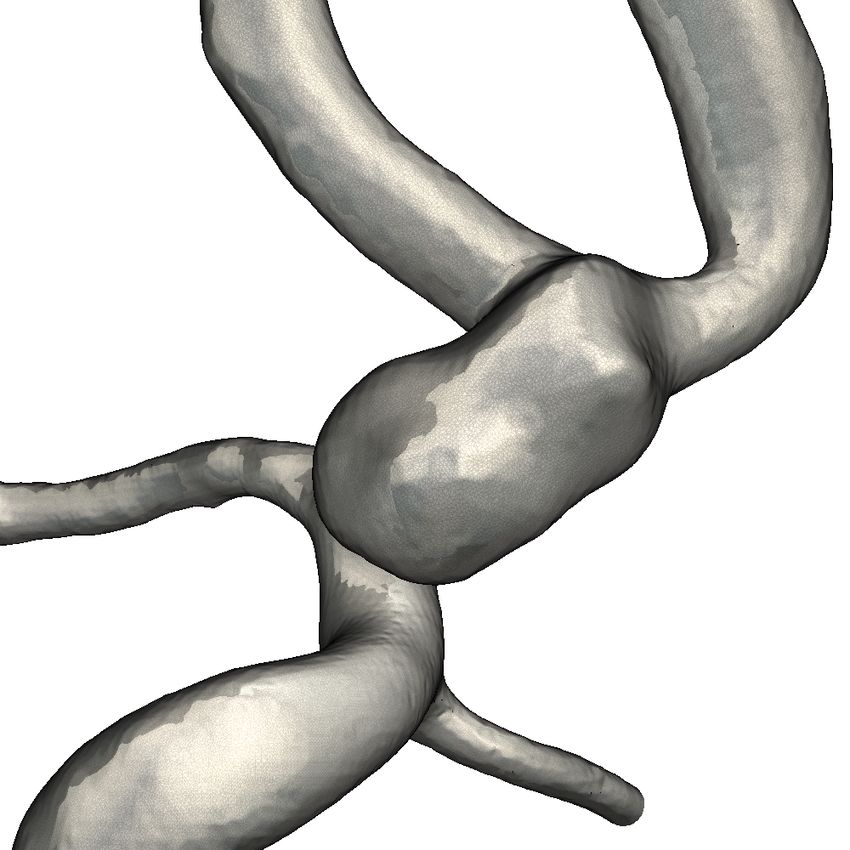
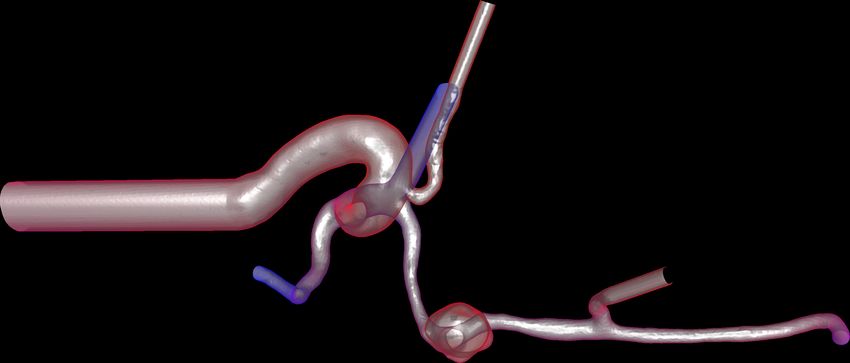
Figure 2: Selected cases for our evaluation.
Physician C Physician D Physician E The first visualization only depicted the vessel surface without
Case 1 - before C&S C&S Y–S any hemodynamic information. The physicians were asked about
Case 1 - after C&S C&S C&S their treatment decision based on the given visualization. After-
Case 2 - before Y–S C&S Y–S wards, we presented them with the same dataset, including path-
Case 2 - after Y–S C&S Y–S lines extracted by the evolutionary algorithm, and asked whether
Case 3 - before C C&S Y–S they would revise their decision. For this evaluation, we chose a
Case 3 - after C Y–S C&S fitness function based on both line length and residence time of the
Case 4 - before Y–S C&S Y–S flow inside the aneurysm, as it achieves a pathline coverage supe-
Case 4 - after Y–S Y–S Y–S rior to uniform seeding approaches and covers the whole aneurysm.
Case 5 - before Y–S C&S Y–S In four of five cases, at least one physician changed his or her
Case 5 - after Y–S Y–S Y–S treatment decision after exploring our evolutionary pathlines (Ta-
ble 1). These changes were motivated by an improved understand-
Table 1: Results of our evaluation for physicians C, D and E, ing of the intra-aneurysmal flow and its splitting into the outlets,
when only seeing anatomical information (before) and after see- including flow patterns. In three cases, these changes lead to more
ing our pathline visualization (after). Treatment decisions were: consistency in the final decision between the physicians. The third
stent-assisted coiling (C & S), y-stenting (Y–S), and coiling with- aneurysm was the most challenging one, as two physicians changed
out stenting (C). Changes in treatment decisions are highlighted. their minds and the final decisions are not consistent between them.
On the one hand, their initial decisions were similarly inconsistent,
but on the other hand, we selected challenging cases. Interestingly,
the most experienced physician never changed his mind.
For the evolutionary line seeding approach, we performed a gen-
eral evaluation with Physician A. Afterwards, we conducted a more
specific evaluation with three additional neuroradiologists (Physi-
cian C, Physician D and Physician E), who were not familiar with 5. Conclusions
our tool, to validate its clinical usefulness with respect to treatment
planning. Our goal was to evaluate We have presented a set of intuitive techniques to allow for an in-
teractive exploration of local blood flow based on surface features.
1. which fitness function configuration produces the most satisfac- The clinical experts appreciated the local selection techniques to
tory line bundles for this purpose. analyze blood flow characteristics in combination with surface pa-
2. whether the visualization of hemodynamic information using rameters. The use of evolutionary algorithms offers significant im-
evolutionary pathlines influences the treatment decision. provements over existing seeding strategies, both in terms of com-
To answer question 1, we asked Physician A to compare the putational effort and quality of results, such as better coverage of
resulting lines of different fitness functions. The comparison con- hemodynamically interesting regions (aneurysm domes or blebs).
sisted of pathlines optimized for length and to pass by surface areas If the users feel that a certain interesting area is under-detailed due
in the aneurysm with high and low WSS as well as high and low to a lack of pathlines, they may dynamically add pathlines specifi-
OSI. The physician was able to easily identify differences between cally tailored to their needs.
line bundles optimized with respect to high or low OSI and even in-
At the moment, our toolset is only focused on the exploration of
fer the location of high and low OSI or WSS values on the surface.
a single dataset. To better support comparisons, further quantitative
To evaluate the blood flow for treatment decisions, he preferred the
values in addition to the existing ones should be extracted, for ex-
length-based fitness function, as it ensured that the entire aneurysm
ample about the flow directly underneath a patch or the patch itself.
was filled with pathlines (Fig. 1d).
Instead of simply showing multiple datasets side-by-side in isolated
To answer question 2, we presented the other experts (Physician views, an integrated visualization would be desirable. Due to the
C-E) with five challenging cases (Fig. 2), which were selected from complex geometry structure of intracranial vessels and flow struc-
a database containing more than 100 cerebral aneurysms with the tures, the visualization could additionally benefit from the emersion
help of Physician A. provided by virtual reality [BPS∗ 20].
© 2021 The Author(s)
Eurographics Proceedings © 2021 The Eurographics Association.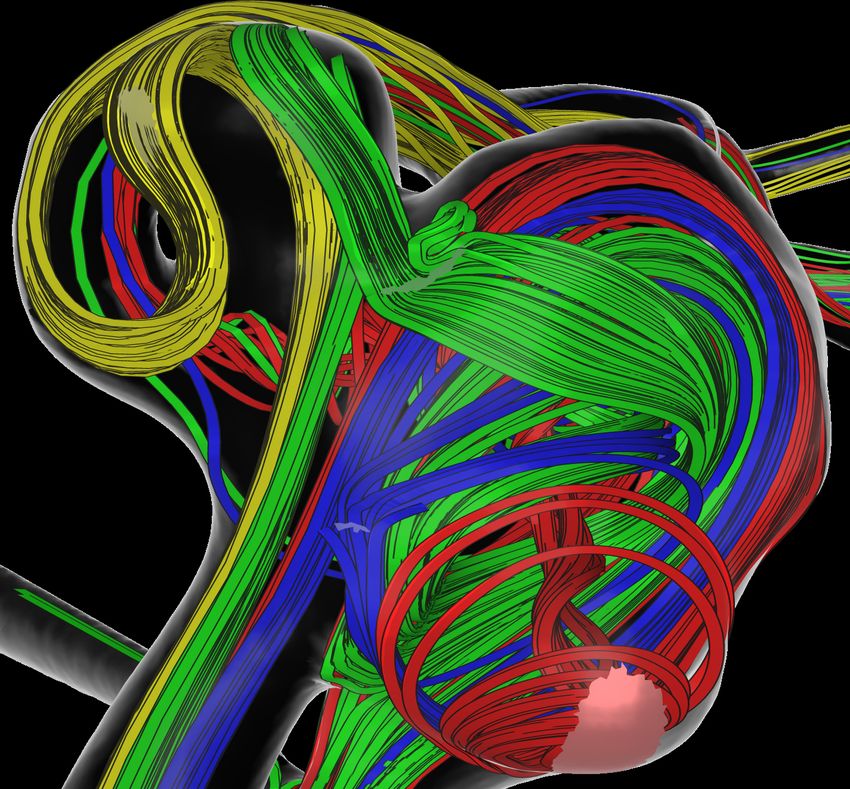
B. Behrendt & W. Engelke & P. Berg & O. Beuing & I. Hotz & B. Preim & S. Saalfeld / Visual exploration of intracranial aneurysm blood flow

References                                                                      [OJMN∗ 18] O ELTZE -JAFRA S., M EUSCHKE M., N EUGEBAUER M.,
                                                                                  S AALFELD S., L AWONN K., JANIGA G., H EGE H.-C., Z ACHOW S.,
[BBB∗ 18]     B EHRENDT B., B ERG P., B EUING O., P REIM B.,
                                                                                  P REIM B.: Generation and Visual Exploration of Medical Flow Data:
   S AALFELD S.: Explorative blood flow visualization using dynamic line
                                                                                  Survey, Research Trends and Future Challenges. Computer Graphics
   filtering based on surface features. Computer Graphics Forum 37, 3
                                                                                  Forum 40, 4 (2018), 860. 2
   (2018), 183–194. 1, 2
[BBPS17] B EHRENDT B., B ERG P., P REIM B., S AALFELD S.: Com-                  [vBB∗ 11] VAN P ELT R., B ESCÓS J. O., B REEUWER M., C LOUGH
  bining pseudo chroma depth enhancement and parameter mapping for                 R. E., G RÖLLER M. E., ROMENIJ B. T. H., V ILANOVA A.: Interactive
  vascular surface models. In Eurographics Workshop on Visual Comput-             virtual probing of 4d mri blood-flow. IEEE transactions on visualization
  ing for Biology and Medicine (2017), The Eurographics Association. 1,           and computer graphics 17, 12 (2011), 2153–2162. 2
  2
[BEB∗ 19] B EHRENDT B., E NGELKE W., B ERG P., B EUING O., P REIM
  B., H OTZ I., S AALFELD S.: Evolutionary pathlines for blood flow ex-
  ploration in cerebral aneurysms. In Eurographics Workshop on Visual
  Computing for Biology and Medicine (2019), The Eurographics Associ-
  ation. 1, 3
[BHK∗ 16] B ROOS A. J. M., H OON , N IELS H. L. C. DE , KONING ,
  PATRICK J. H. DE , G EEST, ROB J. VAN DER , V ILANOVA A., JALBA
  A. C.: A Framework for Fast Initial Exploration of PC-MRI Cardiac
  Flow. Proceedings of the Eurographics Workshop on Visual Computing
  for Biology and Medicine (2016), 69–78. 2
[BPM∗ 13] B ORN S., P FEIFLE M., M ARKL M., G UTBERLET M.,
  S CHEUERMANN G.: Visual analysis of cardiac 4D MRI blood flow us-
  ing line predicates. IEEE transactions on visualization and computer
  graphics 19, 6 (2013), 900–912. 2
[BPS∗ 20] B EHRENDT B., P IOTROWSKI L., S AALFELD S., P REIM B.,
  S AALFELD P.: The virtual reality flow lens for blood flow exploration. In
  Eurographics Workshop on Visual Computing for Biology and Medicine
  (2020), The Eurographics Association, pp. 37–41. 4
[CMWP11] C EBRAL J. R., M UT F., W EIR J., P UTMAN C.: Quantita-
  tive characterization of the hemodynamic environment in ruptured and
  unruptured brain aneurysms. American Journal of Neuroradiology 32, 1
  (2011), 145–151. 2
[DCM∗ 18] D ETMER F. J., C HUNG B. J., M UT F., S LAWSKI M.,
  H AMZEI -S ICHANI F., P UTMAN C., J IMÉNEZ C., C EBRAL J. R.: De-
  velopment and internal validation of an aneurysm rupture probability
  model based on patient characteristics and aneurysm location, morphol-
  ogy, and hemodynamics. International journal of computer assisted ra-
  diology and surgery 13, 11 (2018), 1767–1779. 2
[dHLJ∗ 19]   DE H OON N., L AWONN K., JALBA A., E ISEMANN E., V I -
   LANOVA  A.: Inkvis: A high-particle-count approach for visualization of
   phase-contrast magnetic resonance imaging data. In Eurographics Work-
   shop on Visual Computing for Biology and Medicine (2019), pp. 177–
   188. 2
[EBB∗ 15] E TMINAN N., B ROWN R. D., B ESEOGLU K., J UVELA S.,
  R AYMOND J., M ORITA A., T ORNER J. C., D ERDEYN C. P., R AABE
  A., M OCCO J., ET AL .: The unruptured intracranial aneurysm treatment
  score: a multidisciplinary consensus. Neurology 85, 10 (2015), 881–889.
  2
[EH18] E NGELKE W., H OTZ I.: Evolutionary Lines for Flow Visualiza-
  tion. In EuroVis - Short Papers (2018), pp. 7–11. 3
[GNKP10] G ASTEIGER R., N EUGEBAUER M., K UBISCH C., P REIM
  B.: Adapted surface visualization of cerebral aneurysms with embed-
  ded blood flow information. In VCBM (2010), pp. 25–32. 2
[GRT13] G ÜNTHER T., R ÖSSL C., T HEISEL H.: Opacity optimization
  for 3d line fields. ACM Transactions on Graphics 32, 4 (2013), 1. 2
[GWBJ∗ 14] G REVING J. P., W ERMER M. J., B ROWN J R R. D.,
  M ORITA A., J UVELA S., YONEKURA M., I SHIBASHI T., T ORNER
  J. C., NAKAYAMA T., R INKEL G. J., ET AL .: Development of the
  phases score for prediction of risk of rupture of intracranial aneurysms:
  a pooled analysis of six prospective cohort studies. The Lancet Neurol-
  ogy 13, 1 (2014), 59–66. 2
[MLP∗ 10] M C L OUGHLIN T., L ARAMEE R. S., P EIKERT R., P OST
  F. H., C HEN M.: Over Two Decades of Integration-Based, Geomet-
  ric Flow Visualization. Computer Graphics Forum 29, 6 (2010), 1807–
  1829. 2

© 2021 The Author(s)
Eurographics Proceedings © 2021 The Eurographics Association.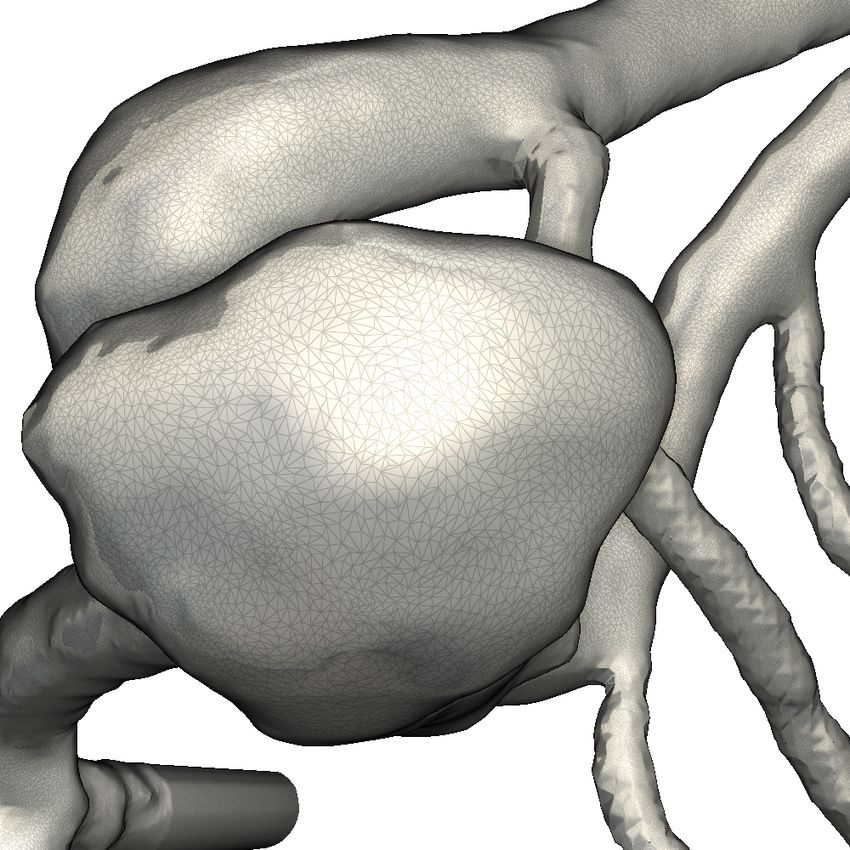
You can also read