Right Whale Management February 2021 Update - Atlantic States Marine Fisheries Commission - Atlantic ...
←
→
Page content transcription
If your browser does not render page correctly, please read the page content below
Right Whale Management
                             February 2021 Update
Greater Atlantic Regional
Fisheries Office            Atlantic States Marine Fisheries Commission

                                                                      Slide 1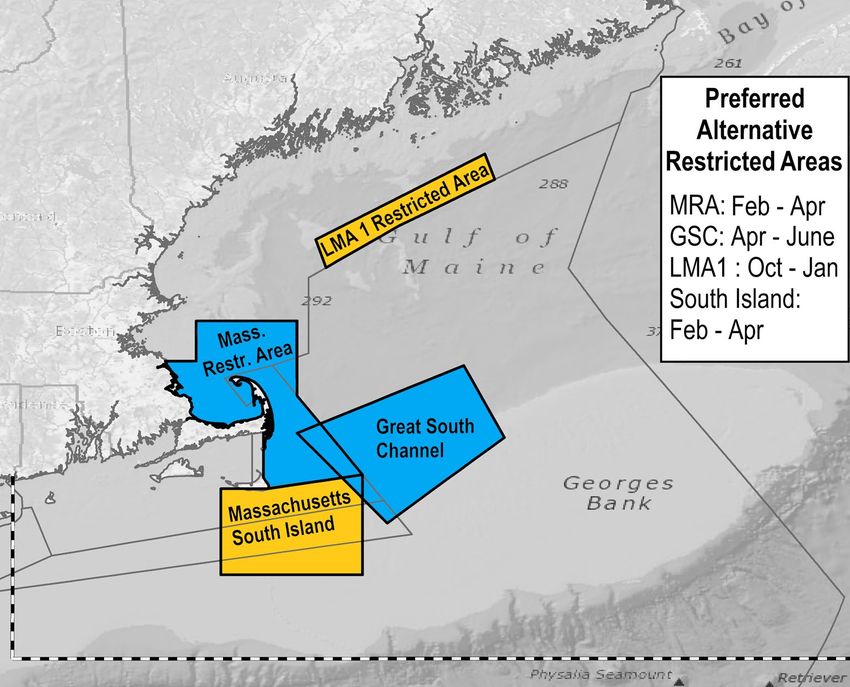
MMPA:
Atlantic Large Whale Take Reduction Plan
● Proposed Rule
● Draft Environmental Impact Statement
ESA:
Section 7 Consultation
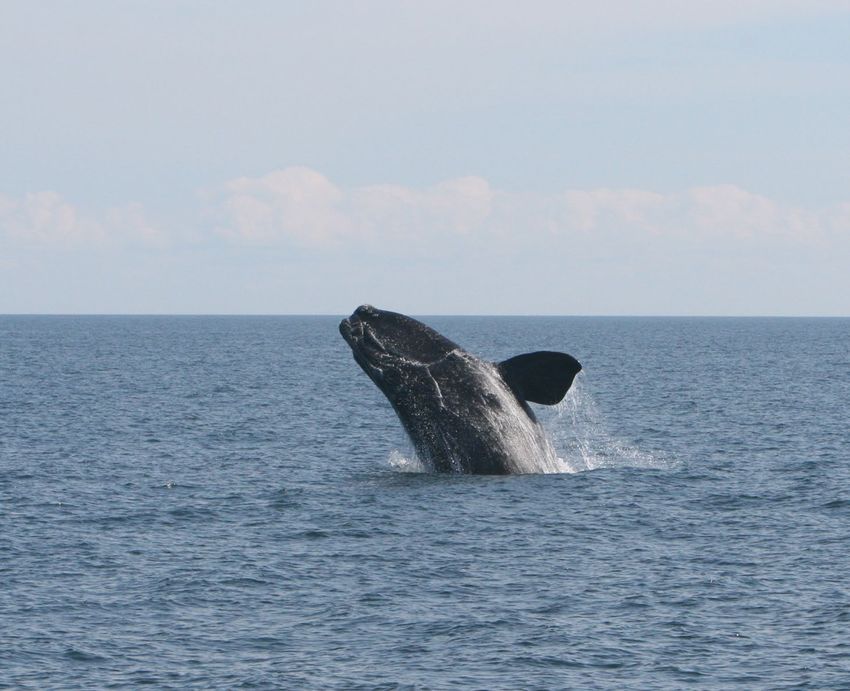
● Batched Fisheries Biological Opinion Photo Credit: GADNR No. 15488
Slide 2
Proposed Rule and Draft
 Environmental Impact
       Statement

                          Slide 3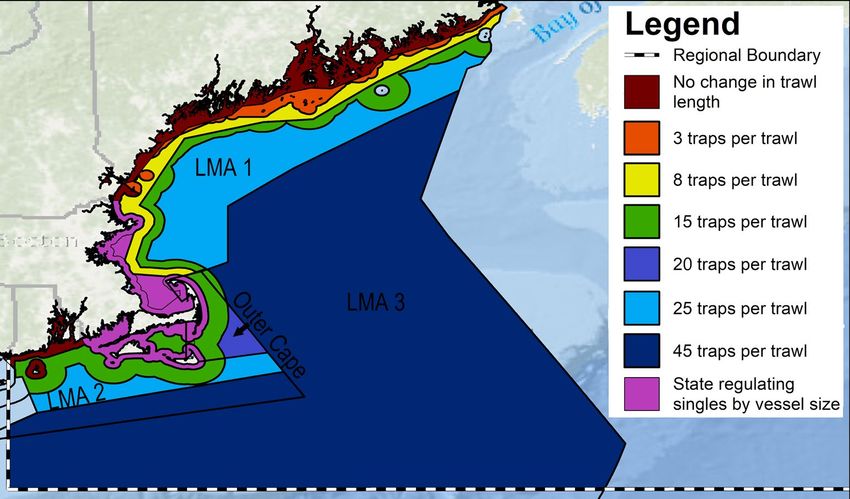
Take Reduction Plan: April 2019 Team Direction

Develop recommendations to reduce mortalities and serious injuries of right whales in U.S.
fisheries by 60% to 80% to below the potential biological removal level
  ●  Assumes mortalities and serious injuries of unknown origin occur equally in U.S. and
     Canada
  ●  Decision Support Tool (DST) used to compare/evaluate measures
       ○   CIE Peer Review late 2019
  ●  Start with northeast lobster and Jonah crab fisheries (93% of vertical lines where right
     whales occur)

              A.Henry, Permit No. 17355

                                                                                        Slide 4
Basic Principles for Alternative Development
Risk reduction of 60% or greater as
assessed with Decision Support Tool
Apply April 2019 TRT Recommendations
  ●   Include broad application of reduced line and weak
      rope across jurisdictions
State and Federal Scoping
NMFS Approach
  ●   Jurisdictional approach: State proposals, American
      Offshore Lobster Association for LMA3
  ●   Direct the most protection to areas of predictable
      high seasonal aggregations
  ●   Substantial risk reduction across areas of co-
      occurrence
  ●   Precautionary measures everywhere

                                                                  Slide 5
April 2019 Take Reduction Team Results

Near-Consensus
Recommendation

●   Approach:
    ○   Achieve at least 60% risk
        reduction (DST)
    ○   Spread risk reduction across
        jurisdictions

●   Results:
    ○   Broad application of reduced
        line and weak rope

                                         Slide 6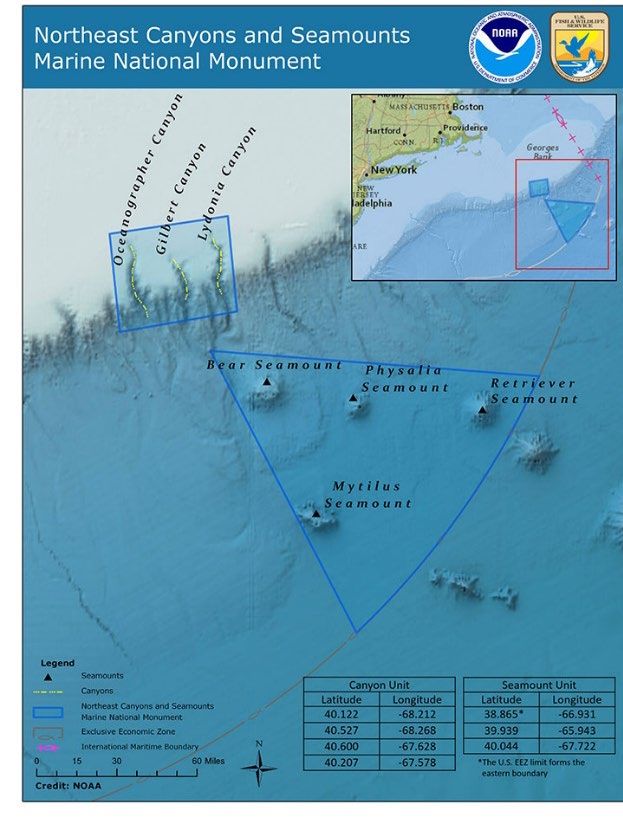
What tools were used: how and why
To select measures and estimate risk                      Baseline Co-occurrence             Preferred Alternative- Change
reduction:
  ●   Decision Support Tool (spring 2020)
      ○ Whales + vertical lines + strength of gear
  ●   CIE Peer Review late 2019

To assess the potential biological
impacts:
  ●   Percent co-occurrence reduction:
      IEC/NMFS co-occurrence model
      ○ Whales + vertical lines                      Darker red cells represent areas of high co-occurrence
  ●   Percent line reduction                         Darker blue cells represent areas with greater decrease in co-occurrence
                                                     White cells represent low to no co-occurrence
  ●   Percent total line weakened                    Grey cells represent area where we have insufficient data for co-occurrence

                                                                                                                    Slide 7
PREFERRED ALTERNATIVE / PROPOSED RULE

ALWTRP Measures
●   Trawl up by distance from shore (outside of exempt or state
    waters)                                                          Other State or Fishery
●   Restricted areas changed from closure to closed to buoy lines    Management Measures
                                                                         Ongoing and planned line
●   Two new restricted areas:                                        ●

                                                                         reduction in LMAs 2 & 3
     ○ South Island Restricted Area Feb -Apr
                                                                     ●   No singles on MA vessels
     ○ LMA 1 Restricted Area                                             larger than 29 ft permitted
         ■ Analyzed: restricted area Oct - Jan                       ●   Credit for the
         ■ Co-proposal 1-A: no restricted area                           Massachusetts Restricted
         ■ Co-proposal 1-B: restricted area Oct-Jan based on             Area (MRA) from Feb - Apr
                                 future determinations               ●   Delayed open of MRA state
                                                                         waters until surveys
●   Region-wide conversion to weaker line                                confirm whales have left
    ○ LMA1, 2 and Outer Cape: Minimum number of Insertions based
      on distance from shore
    ○ LMA3: full weak line or equivalent top 75% of one of the two
      buoy lines
                                                                                          Slide 8
Preferred Alternative/Proposed Rule:
         Line Reduction Measures

                                       Slide 9
Preferred
Alternative:
Seasonal Restricted
Areas
●   Existing restricted areas
    (in blue) modified to
    allow ropeless (with
    Exempted Fishing Permit)
●   State waters of MRA
    would be closed by MA in
    May unless whales leave
    the area
●   Up to two new seasonal
    ropeless areas proposed
    (in yellow)

                     Slide 10
Full weak line Insertion at
Preferred Alternative: Weak Line Measures equivalent 25% and 50%
# of inserts X 40ft
Risk Reduction = X risk reduction for full weak line
depth X scope ratio
Weak
////////
Area Insertion % from the top Source Insertion
////////
50%
40 ft
State waters 1 weak insertion at 50% ME, MA
////////
////////
Maine state waters outside
2 weak insertions at 25%
exemption area and all ME, MA
and 50%
northeast 3 to 12 nm
////////
12 nm to border (all northeast) 1 weak insertion at 33% ME, MA
One full weak line top 75%,
LMA3-weak line (75%) standard line on the other AOLA
end
Slide 11Example: New Hampshire
Preferred Alternative: Gear Marking Federal Water State Water
Marks Marks
● State specific colors (new and existing marks):
Maine = Purple (already implemented through state regs)
New Hampshire = Yellow
Massachusetts = Red
Rhode Island = Silver/gray
LMA3 = Black
● New three-foot long mark within two fathoms of surface
system
● State waters: two one-foot marks, top and bottom half of buoy
line
● Federal waters: six-inch green mark within one foot of long
mark
Slide 12Summary of Risk Affects Analysis
Preferred Alternative Selection:
● Risk reduction estimated by Decision Support Tool . . . . . . . . . . . ~64%
Draft Environmental Impact Statement Analysis:
● Reduction in right whale/buoy line co-occurrence . . . . . . . . . . . . ~69%
● Proportion or rope in buoy lines weakend . . . . . . . . . . . . . . . . . . . . ~30%
fisheries.noaa.gov/ALWTRP Slide 13Summary of Compliance Costs
Proposed Measures
Measures Costs (in millions $)
First Year 6 Years Vessels Affected
Gear marking $2.0 $12.0 3,970
Weak rope $2.2 $2.2 2,855
Trawling up $2.7 - $11.0 $13.2 - $45.0 1,712
Restricted Areas $0.1 - $0.3 $0.6 - $1.9 55
Line cap - - -
Total Cost $6.9 - $15.4 $28.0 - $61.0
Total Value of
> $600 million per year
Fisheries
Data from Chapter 6 of the DEIS
Slide 14Batched Fisheries
Biological Opinion
Slide 15Endangered Species Act, Section 7
ESA section 7(a)(2) requires federal agencies to ensure that any action
by a federal agency is not likely to jeopardize the continued existence
of listed species or destroy or adversely modify critical habitat
A.Henry, Permit No. 17355
Slide 16Definitions
“Jeopardize the continued existence of”: Engage in an action that
reasonably would be expected to reduce appreciably the likelihood of
the survival and recovery of a species in the wild by reducing the
reproduction, numbers, or distribution of that species.
Destruction or adverse modification of critical habitat: direct or
indirect alteration that appreciably diminishes the value of critical
habitat as a whole for the conservation of a listed species
Biological Opinion: Conclusion of formal consultation documenting
the consulting agency’s analyses and determinations
Slide 17The Federal Action
Authorization of the fisheries:
● Lobster ● Bluefish
● Red Crab ● Skates
● Multispecies ● Mackerel/Squid/Butterfish
● Monkfish ● Summer flounder/Scup/Black sea bass
● Dogfish ● Jonah crab (no prior consultation)
NEFMC’s Omnibus Habitat Amendment 2
Right Whale Conservation Framework for Federal Fisheries in the GAR
The Action Area
Maine through Key West, Florida
Slide 18Species Likely to Be Adversely Affected
Large Whales Sea Turtles Fish
● Fin ● Green, North Atlantic DPS ● Atlantic salmon
● North Atlantic right ● Kemp’s ridley ● Atlantic sturgeon
● Sei ● Leatherback ● Giant manta ray
● Sperm ● Loggerhead, Northwest
Atlantic DPS
Slide 19Determination in the Draft Opinion
The proposed action is not likely to jeopardize any listed species
or destroy or adversely modify any critical habitat.
Incidental Take Statement:
● Lethal and non-lethal take: loggerhead, Kemp’s ridley, green,
and leatherback sea turtles; Atlantic sturgeon, Atlantic salmon,
and giant manta rays
● Non-lethal take: fin, sei, sperm, and North Atlantic right
whales
● Zero lethal take of large whales authorized
Slide 20North Atlantic Right Whale Analysis
● Estimated M/SI (overall, assigned to U.S. fisheries)
● Estimated interactions, including non-lethal
● Conservation Framework (need to reduce M/SI further)
● Analysis of the likelihood of jeopardy (population projections and
qualitative analysis)
● Determination in the Draft Opinion
● Other Considerations
NOAA/NEFSC/Lisa Conger
Slide 21Estimated M/SI (Vessel Strikes and
Entanglements) by Country 2010-2019
Average
Annual
Estimated 20.1
M/SI
Estimated 9.05
U.S.
Estimated 11.05
CAN
Slide 22M/SIs Assigned to U.S. Entanglements
Cause of M/SI was Confirmed Assumption Attributed Average Annual
entanglement? to Country? to U.S. M/SI
fisheries?
Yes U.S. Uses observed number 100% 0.2
Yes Unknown Uses 50:50 split with Canada 50% 1.9
Unknown (observed) U.S. Uses observed 74% 0.07
entanglement:vessel strike ratio
Unknown (observed and Unknown Use observed entanglement: 37% 4.55
unobserved) vessel strike ratio; 50:50 split
with Canada
Total 6.7
Slide 23M/SIs (Entanglements) Assigned to U.S. Federal
Waters
Fishey Assumption Average annual
M/SI
Total U.S. 6.72
Federal 73% risk in federal waters (DST) 4.82
Pot/Trap
Federal Gillnet Gillnet takes occurred in federal waters 0.125
Total Federal 4.94
Slide 24Total Estimated Entanglements (Lethal and Non-lethal)
Fishey Assumption % Population
Estimated
Entangled Annually
Total Used scarring rates from Hamilton et al 30.25%
(2019)
U.S. fixed gear Applied 50:50 U.S./Canada split 15.125%
Fixed Gear in U.S. Applied 73% risk in federal waters (DST) 11.04%
federal waters
Photo credit: NEFSC/Christin Khan
Image taken under MMPA research permit #17335
Slide 25Analysis Conducted to Determine Necessary M/SI Reduction
● Additional reductions in M/SI are needed to ensure the fisheries are not likely
to appreciably reduce survival and recovery
● To assess the level needed, projected the female population over 50 years
○ Proposed ALWTRP risk reductions implemented at year 1
○ Additional M/SI reductions of 0, 25, 50, 75, 95, 100% implemented year 10
● Data available at time of assessment
○ M/SI estimates from 2010-2018
○ Population estimate of 412
● 95% reduction at year 10 was needed
Slide 26Conservation Framework - Overview
● What it Is
● What it Includes
● Phased Approach
● Evaluation
● Adaptive Management
Note: The recent population estimate triggered a reevaluation. In this reevaluation,
the overall additional reduction of 95% remained the same, but the timing of
reductions under the Conservation Framework was adjusted
Photo credit: Florida Fish and Wildlife Commission Image
taken under NOAA Research Permit 665-1652.
Slide 27Conservation Framework
What it is
● Outlines NMFS’ commitment to implement measures in federal fixed
gear fisheries necessary for the recovery of right whales
● Provides a phased approach and flexibility to the fishing industry
● Does not specify particular measures, but sets target reductions in M/SI
What it includes
● Four phased approach
● Assumes no reduction in M/SI from vessel strikes or in Canadian
waters
● Adaptively manages through periodic evaluations
○ Measures can be scaled back based on changes in the population or
risk reduction from other sources
Slide 28Conservation Framework - The Details
Phase Year Conservation Framework Action Description Reduce M/SI to
Annually Annual updates, as appropriate, to interested parties
ALWTRP rulemaking in Northeast lobster and Jonah crab
1 2021 2.2
trap/pot fisheries
Rulemaking to reduce M/SI in gillnet and other pot/trap 2.13 (60%
2 2023
(i.e., those not included in Phase 1) fisheries reduction)
Review data on right whale population and threats to assess
Evaluate 2023-2024
progress; assess measures taken by Canada
Rulemaking to further reduce M/SI in fixed gear fisheries in 0.85 (60%
3 2025
federal waters reduction)
Comprehensive evaluation and determination of extent to
Evaluate 2025-2026
which further measures are needed
Goals identified in
Rulemaking to further reduce M/SI in fixed gear fisheries
4 2030 2025-2026 (up to
as determined in the 2025-2026 evaluation
87% or 0.11 M/SI)
Slide 29Conservation Framework - The Evaluations
● After phases 2 and 3, evaluate information on:
○ Population status, distribution, and habitat use
○ Calving and survival rates
○ Entanglements and vessel strikes in U.S. and Canadian waters
○ Changes to the federal fisheries (e.g., changes in co-occurrence due
to shifts in where the fishery operates or changes in
effort/operation)
○ Apportionment of M/SI to country (U.S., Canada) and cause
(entanglement, vessel strike)
● After phase 3, rerun population projections with most recent data
Slide 30Conservation Framework - Adaptive Management
● Will evaluate significant new information (e.g., population status, risk
reduction) when available to determine whether changes to the
Framework are needed
● Includes the scheduled evaluations after phases 2 and 3
● Target reduction will be adjusted if M/SI from other sources is reduced
○ Reduction in one M/SI every two years (i.e., 0.5 M/SIs per year)
would reduce phase 4 from 87% to 28%
○ Reduction in one or more M/SI each year would trigger a
determination of whether measures in phase 4 are needed
Slide 31Assessing the likelihood of jeopardy
Theoretical Population Trajectories
● Scenario without the action: No
federal fishery
● Scenario with the proposed
action: Fisheries under 10 FMPs
with measures implemented under
the Conservation Framework
Slide 32Assessing the Likelihood of Jeopardy
Projection Models
● Compare female population under
two scenarios
● Difference of 5 females at year 10
λ = 0.991011 ● With the exception of 1 year, the
difference in females remains 5-6
λ = 0.990112 for years 11-50
● 96% of the simulations show a
declining trend with no federal
fishery; 97% with the proposed
action
Slide 33Assessing the Likelihood of Jeopardy
Qualitative Analysis
Sublethal Effects
● Confounded by sublethal effects from other sources (e.g., prey
availability, climate variation, vessel strike), but sublethal effects will
be reduced under the Framework
● Would result in improved trajectories under both scenarios
Genetics Analysis
● Not expected to result in a genetic bottleneck
Slide 34Determination in Draft Opinion
Based on our analysis, the proposed action -- which includes the Conservation
Framework -- will not appreciably reduce the likelihood of survival and recovery of
North Atlantic right whales compared to the no action scenario
The proposed action is not likely to jeopardize any listed species or destroy or
adversely modify any critical habitat
GA DNR_NARW 372- and calf_Jan 2021_Permit no. 20556
Slide 35Other Considerations
● Even with a very high level of risk reduction in U.S. fisheries, the
trajectory will not increase if M/SIs continue to occur at current levels
in Canadian waters
● Trajectories projected if Canada were to reduce M/SI at same times and
levels as the United States
● Trajectory turns positive if both countries take actions to reduce M/SI
● Committed to continue to work with Canada through bilateral forums
Slide 36NARW Public Input Opportunities
ALWTRP Proposed Rule and Draft Environmental Impact Statement
● Comments due March 1, 2021
● Use Regulations.gov, search for NOAA-NMFS-2020-0031.
● Four remote public hearings Feb 16, 17, 23, 24; 6:30 pm ET each night
● See fisheries.noaa.gov/ALWTRP for documents and additional information
Draft ”Batched” Biological Opinion
● Feedback due February 19, 2021
● Email feedback to nmfs.gar.fisheriesbiopfeedback@noaa.gov
● See https://www.fisheries.noaa.gov/resource/document/draft-biological-opinion-10-fishery-
management-plans for additional information
● Court-ordered deadline to complete BiOp – May 31, 2021Questions?
Credit: Photo by Sea to Shore Alliance; taken under NOAA research permit #15488
Slide 38Thank you
Slide 39Management Response to
Lobster 2020 Benchmark Stock Assessment
American Lobster Management Board
February 2, 2021Outline 1. Background 2. Review of Assessment Results 3. Assessment and Peer Review Recommendations 4. Potential Actions
Background
• In October 2020, the Board accepted the 2020
  Benchmark Stock Assessment and Peer Review
  for management use
  – GOM/GBK stock is not overfished; not experiencing
    overfishing
  – SNE stock is depleted; not experiencing overfishing
• The Board adopted new reference points as
  recommended in the assessment and peer
  review
• Consideration of management response
  postponed to February 2021
Abundance Reference Points
• Three abundance reference points
– Fishery/industry target
• Stock’s ability to replenish itself not jeopardized; may
indicate a degrading of economic conditions for the lobster
fishery
– Abundance limit
• Stock abundance level below this threshold is considered
depleted; stock’s ability to replenish itself is diminished
– Abundance threshold
• Stock abundance level below this threshold is considered
significantly depleted and in danger of stock collapse
• This is the only reference point established for SNE stockExploitation Reference Points
• Two exploitation reference points
– Exploitation threshold
• stock is considered to be experiencing overfishing if
exploitation exceeds the threshold
– Exploitation target
• 25th percentile of exploitation during the current
abundance regimeStock Status: GOM/GBK
Stock Status: GOM/GBK
Stock Status: SNE
• In the absence of
  mortality, reference
  abundance projected
  to increase with
  recruit abundance
  exceeding the
  maximum abundance
  for the current regime
• Increases in
  abundance are likely
  to be limited due to
  the projected
  continuing decline in
  recruitment
Stock Status: SNE
Stock Status: SNE
• Additional considerations:
  – Recruitment indices indicate stock is not rebuilding and is in
    recruitment failure
  – Contraction of stock distribution has continued, becoming
    apparent in the offshore portion as well as inshore
  – SNE landings have continued to decline to low in 2018
  – Disease remains high in RI and MA, all four temperature
    indicators are negative, environmental stress may have
    lethal and sublethal effects
  – Evidence that environmental influences have resulted in a
    decreasing recruitment rate. Substantive measures needed
    to increase adult abundance to improve recruitment
    success.
Assessment and Peer Review Recommendations
• GOM/GBK
– No recommended management action at this time
– Economic analysis to provide advice on appropriate
action to stabilize fishery when abundance falls below
target
• SNE
– “significant management action to halt the decline of
abundance and increase reproductive capacity and
recruitment to the stock, such as a moratorium, is
recommended if abundance falls below this threshold”
– No specific measures proposedAssessment and Peer Review Recommendations
• Both Stocks
– annual “Data Update” process to monitor changes to
stock abundance
– annual updates of all indicators & development of
science-based rule for conditions triggering an earlier
than scheduled assessment
– continued use and exploration of indicators to
understand the relative merits of indicator-based
management controls
– management strategy evaluation could inform
appropriate management targets or measures to meet
defined objectivesPotential Actions: GOM/GBK
• GOM/GBK: Provide guidance for
development of Addendum XXVII
(GOM/GBK resiliency)
– Standardization of management measures (e.g. V-
Notching, Gauge/Vent Sizes, Trap Tags for Losses)
– Consider a trigger mechanism for management
measures responding abundance falling below
fishery/industry target
– Potential management measures would be identified
through socioeconomic analysis to identify
management measuresPotential Actions: SNE
• Consider initiating management action to
address depleted SNE stock status
• Task TC with analysis of impacts of potential
management options on stock
– Need specific direction on reductions/measures to be
analyzed, e.g. Impact of reducing fishing mortality by X-Y%
– Following 2015 assessment TC analyzed impacts of some
management changes
• Consider impacts of forthcoming changes in
response to Atlantic Large Whale Take
Reduction PlanQuestions?
Lobster Management Strategy
         Evaluation
        February 2, 2021
Background • Management and Science Committee tasked a subcommittee for exploring the development of a management strategy evaluation (MSE) • American lobster identified as an ideal candidate for MSE • Need to identify Board’s interest in pursuing an MSE and priority level given competing management needs
An Introduction to MSE
• MSE is a collaborative process to build a simulation
  tool for evaluating management actions (Deroba)

• Stakeholders and Managers identify goals or desired
  outcomes for a fishery.

• Stakeholders and Managers work with scientists
  (population modelers, ecosystem scientists,
  economists, sociologists) to:
  • Translate management goals into measurable quantities
  • Identify candidate management actions intended to
    achieve management goals.
An Introduction to MSE • Scientists run simulations and evaluate how different management scenarios performed for achieving management goals. • Managers and stakeholders examine the performance of different management actions under different situations and select preferred management actions.
The MSE Road Map

                     Scientists create a virtual
Stakeholders and                                   Stakeholders and      Managers
                     reality (simulation) of
Managers identify:                                 Managers Review       • Select and
                     the system:
• Objectives                                       • Management            implement an
                     • Data collection
• Related metrics                                    action                action or…
                     • Assessment
• Uncertainties                                      performance…        • Have a plan or
                     • Harvest rule
• Management                                       • …via tradeoffs in     suite of plans
                     • Ecosystem dynamics
  actions or                                         metrics               that can be
                     • Human/fleet behavior
  procedures                                                               enacted when
                     • Economic model
                                                                           needed.
                     • Other
                     • Uncertainties
                     • Record metrics                                          (Deroba)
Critical early role of Stakeholders and Managers:
• Identify what they want to achieve: Management goals and
objectives. For example but not constrained to:
• Maximize landings
• More stable or predictable landings
• Maximize profits / profitability
• Maintain fleet diversity and participation
• Performance Metrics (measurements of fishery
performance)
• What is your basis for assessing success of a management
actions?
• Total Landings, value of landings, resource health and resilience, etc.
• Will be the basis for choosing among management actions.
• Will be used to demonstrate tradeoffs among objectives.Critical early role of Stakeholders and Managers:
• Identify possible management actions to evaluate
• What should management do to achieve your objectives?
• Can be conceptual (e.g., minimize interannual variability in
catch)
• Some may not be realistic, and this should be clarified
• Forms foundation for the management procedures/actions
to be simulatedMSE Closed-loop Simulation • Virtual reality (S. Cadrin) • Flight simulator (J. Deroba, et al.) • Play “what if” scenarios with no real world risk (G. Fay) reality simulations
Example of Closed-Loop Simulation Modeling
                            Management Strategy; Adaptive
                            or Static. (Effort Controls,
                            Harvest Controls, etc.)

              Population
              Metrics                   Economic
                                        Metrics
                                                          Fishery SocioEconomic Model.
Stock Assessment Model.
                                                          (Fishing efforts, strategies,
(Stock status and trends)
                                                          expenses, profits, etc.)

                Virtual
                Sampling

                            Fishery Population Model.
                            (Exploitation, recruitment,
                            growth, mortality)
• Simulations run under different proposed
                                                                    Simulated variable
  actions, economic models, population                              population parameters from
  parameters, etc.                                                  changing environment.
• Model structure and complexity are                                (Ecosystem Effects)
  dependent on the needs of the proposed
  management goals.
Managers Select Preferred Actions Based on Results
• Selection of a management action might entail:
• Finding an “optimal” action, but rarely possible.
• Finding a suite of actions that perform similarly.
• Identifying actions that perform better under some
circumstances.
• Eliminating obviously bad options (sometimes easiest)
• Actions may be implemented immediately or held in reserve
for future circumstances.
• Consider how to scale “Strategic” long-term considerations
down to “tactical” short-term realitiesMSE Pros and Cons
PROs
• Forces explicit consideration of objectives (especially long-term)
• Having a management strategy makes decision making easier
• Feedback control allows whole of management cycle to be evaluated
• Explicit focus on uncertainty & robustness – not optimality
• Formal system for comparing management performance among options
• Tradeoffs associated with multiple objectives explicitly addressed
CONs
• Forces explicit consideration of objectives
• Complex, specialized expertise required
• Development can be lengthy (plan accordingly)
• MSEs do not explicitly provide tactical advice (implementation on the
ground)Focal Areas
• Stock productivity resiliency (recommended)
– Performance of management actions in response to changing
productivity indicated by settlement and YOY indicators
• Socio-economic resiliency
– Addresses stock assessment recommendation for socio-
economic analysis to inform management action in response
to abundance declines
• Whale interactions
– Incorporate whale interactions within evaluation of
management strategies
• Climate change impacts
– Explicitly link environmental drivers to population dynamics
within evaluation of management strategiesBenefits of a Lobster MSE
• Direct stakeholder inclusion in the process
– Input used to develop objectives, management
strategies, and performance metrics
• Explicit incorporation of socio-economic
considerations
• Availability of resources and tools to support a
lobster MSE
– Lobster stock assessment model and projection
models
– Canada DFO lobster MSE
– NEFSC socio-economic supportMSE Resource Needs
• Lobster Technical Committee and ASMFC Staff
– Similar to a benchmark stock assessment
• Lobster Board
– Participation in stakeholder workshops and review
progress updates
• Facilitator
• Travel for MSE Workshop participants
• Biological/Environmental Modelers
• Socio-economic ModelersPotential Workload Tradeoffs • Potential 2023 Jonah crab stock assessment • Development of GOM resiliency addendum • Potential work to support management response to 2020 lobster stock assessment • Ongoing and future whale interaction work • 2025 lobster stock assessment
Board Feedback
• Is there Board desire to
  pursue and use a MSE
  for supporting a future
  management
  framework?

• What timeframe would the Board want to pursue a
  MSE?

• Does the Board agree with the recommended focal
  area (stock productivity resiliency)?
Acknowledgments

• Jon Deroba, Gavin Fay, Amanda Hart, Allan
  Hicks, Brian Irwin, Sarah Gaichas
Executive Order on Northeast Canyons
   and Seamounts Marine National
             Monument

          American Lobster Management Board
                   February 2, 2021
Background
• On January 20th, 2021, President Biden issued an
Executive Order (EO) on Protecting Public Health
and the Environment and Restoring Science to
Tackle the Climate Crisis
• Section 3 of the EO requires a review of the 2020
proclamation allowing commercial fishing in the
Northeast Canyons and Seamounts Marine
Monument
– Interior Secretary shall report findings to the
President by March 21, 2021Monument History • Northeast Canyons and Seamounts Marine Monument was established in September 2016 by Presidential Proclamation under the Antiquities Act of 1906 • The Proclamation prohibited commercial fishing with a seven- year exemption for American lobster and red crab fishing • The Commission provided a letter to the Obama Administration stating preference for the NEFMC regulatory process over the establishment of a marine monument (May 9, 2016)
Monument Modification
• On June 5, 2020, President Trump issued a
  Proclamation on Modifying the Northeast
  Canyons and Seamounts Marine National
  Monument.
  – Returned commercial fishery management authority
    to the Magnuson-Stevens Act (and other applicable
    laws)
  – Did not otherwise modify the Monument
Board Action
• Consider if Board wishes to provide
comments during the review period
• No open period for public comment, but a
letter could be sent to the Secretary of the
Interior
– If desired, forward recommendation to ISFMP
Policy BoardQuestions?
You can also read