3 Water Loss fbr, Association for Rainwater Harvesting and Water Utilization - Interreg Central Europe
←
→
Page content transcription
If your browser does not render page correctly, please read the page content below
3) Water Loss
fbr, Association for Rainwater Harvesting and Water Utilization
WATER LOSS REDUCTION
Introduction
What is Non-Revenue Water (NRW)?
The International Water Organisation (IWA) „Water Balance“
IWA leakage management
Performance indicators for water loss
Case studies: Aarhus and Milan
Benefits and barriers to water loss reduction (WLR) programmes
Conclusions & references
TAKING COOPERATION FORWARD 2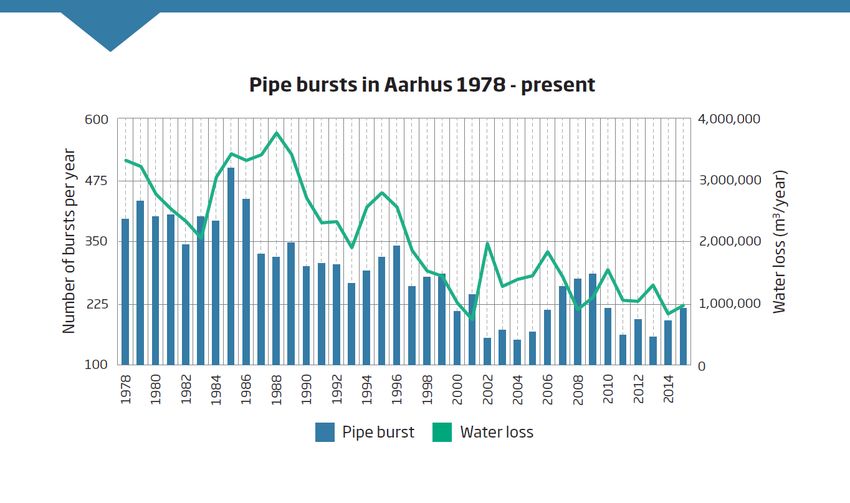
INTRODUCTION
Water loss is defined as the difference between water pumped into system
and billed water
Water loss occurs in every water distribution system during its overall
operational lifetime
It causes not only additional operating costs but also has negative social and
ecological impacts
25-50% of all distributed water globally is lost or never invoiced due to:
o Leakages
o Deteriorating infrastructure
o Incorrect water pressure management
o Inaccurate billing systems
o Inaccurate metering
o Illegal connections
TAKING COOPERATION FORWARD 3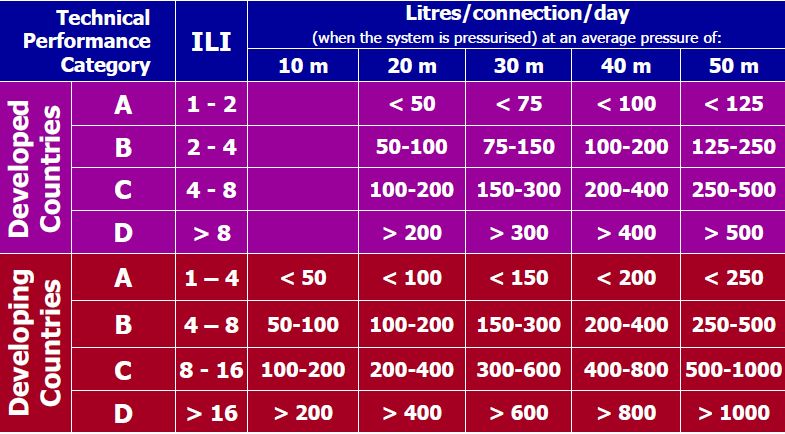
INTRODUCTION
The aim to eliminate water loss completely, despite their environmental
benefits, is economically unprofitable
Therefore, water utilities aim to limit water loss to an economically
reasonable level, since further reduction would generate higher costs than
profits made from water saved
The estimated economically reasonable level of water loss is approx.
8 - 10% or 5 - 6%, depending on the water source
Despite the increase in detection methods to reduce water losses, their
exact evaluation is still impossible
To reduce water losses more effectively, it is best to localise the sources
which generate the biggest losses
An estimated 80% - 100% of real water losses are caused by water leakages
from pipes
TAKING COOPERATION FORWARD 4INTRODUCTION
Water loss reduction (WLR)
Represents an efficient alternative to exploiting new and cost-intensive
resources and measures (dams, deep wells, desalination), thus
contributing to a sustainable and integrated water resources management
Provides a starategic direction for utility managers to determine the best
approach to reducing losses
A sound WLR strategy consists of:
1. An initial situational analysis to assess Non-Revenue Water (NRW)
2. Formulation of clear objectives and targets for the water distribution
network
3. Setting an action plan for the implementation phase
TAKING COOPERATION FORWARD 5INTRODUCTION
Water losses of water supply networks in the EU (%)
(as averages of volume supplied)
(Source: National sources (Country Fiches). This figure
gathers the national data available for different years,
according to availability. * For Romania, Greece, Cyprus
and Poland the figure presents average ranges)
TAKING COOPERATION FORWARD 6INTRODUCTION
Average distribution losses in Europe in percentages
(Mean value for losses = 23%)
(Source: http://www.eureau.org/resources/publications/1460-eureau-data-report-2017-1/file)
TAKING COOPERATION FORWARD 7INTRODUCTION
Average distribution losses in Europe in m3/km/y
(Mean value for losses = 2,171 m3/km/y)
(Source: http://www.eureau.org/resources/publications/1460-eureau-data-report-2017-1/file)
TAKING COOPERATION FORWARD 8INTRODUCTION
Water losses in the public water supply in Germany since 2001
(in percent based on the gross volume of water)
Distribution losses (%)
(Source: German Federal Statistical Office)
TAKING COOPERATION FORWARD 9INTRODUCTION
Water losses in Denmark
Non-Revenue Water, 2011-2016*
Losses (%)
*Simple average (%) based on 52 drinking water companies which have participated in DANVA
Benchmarking for the past 6 years (Source: https://www.danva.dk/media/4662/water-in-figures_2017.pdf)
TAKING COOPERATION FORWARD 10INTRODUCTION
Croatia – very high water losses
Croatia has the largest supply of drinking water in the European Union,
but also the highest losses of water
Up to 80% of the drinking water from the domestic water supply
systems is lost mainly due to leakages from old pipes
https://www.thedubrovniktimes.com/news/croatia/item/6060-largest-drinking-water-supply-in-europe-and-
largest-losses-through-leakage
TAKING COOPERATION FORWARD 12INTRODUCTION
Milan / Italy – Wide range of water losses!
Milan is one of the most virtuous provincial capitals in Italy with a
percentage of network losses of 11.5%, well below the national average
of 39%. This is due to:
o Constant commitment to reducing water losses
o Use of more efficient intervention and management technologies
o Adoption of new instruments for financing the investments
Water losses: 26% in Northern Italy – 46% in Central Italy – 45% in
Southern Italy
The high water losses are mainly due to the poor condition of the water
infrastructure
Sources: Utilitalia – Istat; https://www.mmspa.eu/wps/portal/mmspa/en/home
TAKING COOPERATION FORWARD 13INTRODUCTION
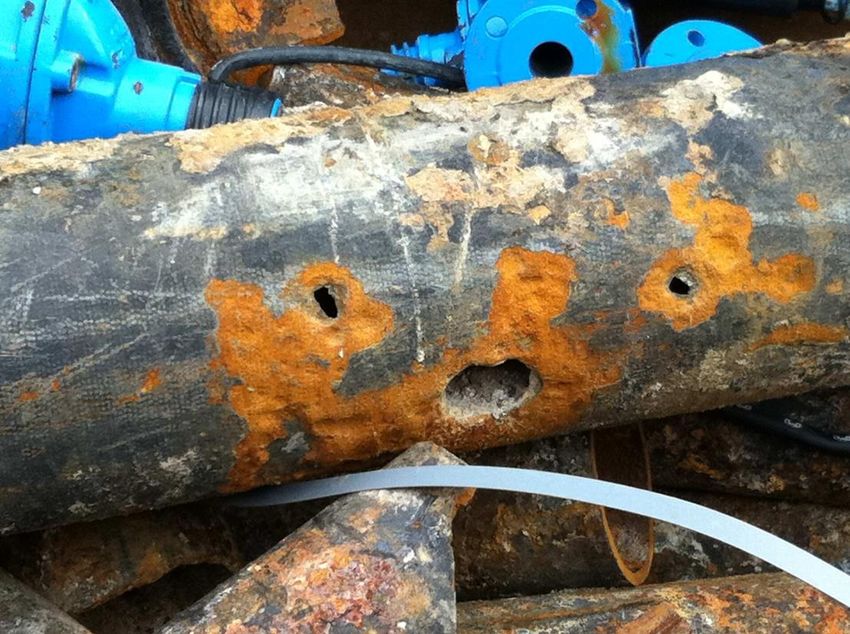
Importance of water loss reduction
Ecological aspects
Hygienic aspects
Economic aspects (water export,
production costs)
Security of supply:
(for example, a 5 mm hole and 5 bar
pressure can induce 32,000 litres of
daily water losses. This corresponds to
a daily drinking water demand for 266
persons at an average consumption of
120 l/P*d)
TAKING COOPERATION FORWARD 14NON-REVENUE WATER
What is Non-Revenue Water (NRW)?
Non-Revenue Water (NRW) is the difference between the amount of water
a water utility pumps into the distribution system and the amount of water
that is billed to its consumers. It includes:
1. Real losses (physical losses): comprise leakage from all parts of the
system and overflows at storage tanks. Real losses are caused by poor
operations and maintenance, lack of ative leakage control and poor
quality of infrastructure
2. Apparent losses (commercial losses): caused by inaccurate metering,
data handling errors and illegal water tapping
3. Unbilled authorised consumption: water used by the utility for
operational purposes, such as water for flushing, firefighting, and
water provided for free to certain consumer groups
TAKING COOPERATION FORWARD 15NON-REVENUE WATER
Non-Revenue Water
(NRW)
Real loss Apparent loss Unbilled authorised
(physical loss) (commercial loss) consumption
Unbilled
Leakages and Inaccurate
metered
pipe breaks metering consumption
Unbilled
Storage Data handling
unmetered
overflows errors
consumption
House
Illegal tapping
connection
leaks
TAKING COOPERATION FORWARD 16IWA WATER BALANCE
IWA Water Loss Specialist Group (IWA-WLSG)
The International Water Organisation (IWA) WLSG has developed a water
audit methodology (“Water Balance”) accounting for all water entering a
water supply system, which has been accepted worldwide
The IWA Water Balance provides a standardised approach using a common
international terminology based on best practice for many countries
An annual water balance is normally used to assess NRW and its components
It is a useful tool to analyse the various components of water production,
storage and distribution processes
This analysis helps identify water loss problems and set priorities
A provision for entering 95% confidence limits for all data entry items also
exists to indicate the reliability of calculated NRW and leakage volumes
TAKING COOPERATION FORWARD 17IWA WATER BALANCE
Internationally recognised best practice approach to calculate
water balance according to IWA
Billed metered consumption
Billed Authorised (including water exported) Revenue
Authorised Consumption QBA Water
Billed unmetered consumption
Consumption
Unbilled metered consumption
QA Unbilled Authorised
Consumption QUA Unilled unmetered consumption
System
Unauthorised consumption
Input
Apparent Losses QAL Customer metering inaccuracies Non-
Volume and data handling errors
Qi Revenue
Water Losses Leakage on transmission and/or Water
QL distribution mains (NRW)
Leakage and overflows at utility‘s
Real Losses QRL storage tanks
Leakage on service connections
up to point of customer metering
(Source: Lambert, A. and W. Hirner, 2000)
TAKING COOPERATION FORWARD 18IWA LEAKAGE MANAGEMENT
Intervention strategies of leakage management
The IWA-WLSG group has also identified four intervention strategies to
reduce real water losses:
1. Pressure management (PM)
2. Active leakage control (ALC)
3. Infrastructure and asset management
4. Speed and quality of repairs
TAKING COOPERATION FORWARD 19IWA LEAKAGE MANAGEMENT
IWA intervention strategies to reduce water losses
Pressure Economic Level of Real
Management Losses
Unavoidable
Annual Real
Speed and Losses (UARL) Active
Quality of Leakage
Repairs Control
Potentially Recoverable
Real Losses
Current Annual Real
Losses (CARL)
Infrastructure
Management
(Source: Adapted from Lambert, A., 2003)
TAKING COOPERATION FORWARD 20IWA LEAKAGE MANAGEMENT
Intervention strategies of leakage management
The four leakage management strategies interact with each other. For
example, pressure management reduces real losses since decreasing pressure
directly diminishes leakage from pipelines and household connections
A single method or a combination of different methods will constitute the
most efficient and economic instrument for water loss reduction depending
on the local situation
The separation of NRW into its components should always be attempted
The components of the water balance should always be calculated and
expressed as volumes (usually in m3) over a given period of time (usually per
year)
NRW expressed as a percentage of system input volume is not very useful
when comparing the water loss performance between utilities. The most
correct figure for NRW is m3/km of pipe/day or litre/service connection/day
TAKING COOPERATION FORWARD 21IWA LEAKAGE MANAGEMENT
Terminology
Real Losses cannot be eliminated totally. The lowest technically
achievable annual volume of Real Losses for well-maintained and well-
managed systems is known as Unavoidable Annual Real Losses (UARL)
UARL is the most reliable predictor yet of „how low could a utility go“
with real losses for a specific system
Each system has a different UARL base level, which varies widely
depending on density of connections, length of connections (main to
meters) and average pressure
Using the four recommended strategies of leakage management, Real
Losses can be controlled but cannot be reduced any further than the
URAL (at the current operational pressure)
The difference between the UARL (small rectangle) and the Current
Annual Real Losses (CARL) is the Potentially Recoverable Real Losses
TAKING COOPERATION FORWARD 22PERFORMANCE INDICATOR
FOR WATER LOSS
The adoption of a sound performance indicator system is essential for
improving a water utility’s performance and quality of service.
The most widely used performance indicator for water loss performance
is the percentage of NRW as calculated by dividing total volume of NRW
by the total system input. Although an obviously important figure, many
practitioners tend to overlook its shortcomings for properly assessing
water losses:
It does not indicate the ratio between physical and commercial losses
It is dependent on utility-specific distribution network characteristics
(e.g. network length, number of connections)
It is highly dependent on supply time (intermittent supply) and
average operating pressure
It is highly dependent on the level of consumption
TAKING COOPERATION FORWARD 23PERFORMANCE INDICATOR
FOR WATER LOSS
Infrastructure Leakage Index (ILI)
The ratio of the Current Annual Real Losses (CARL) to the Unavoidable
Annual Real Losses (UARL) is the Infrastructure Leakage Index (ILI):
ILI = CARL
UARL
The International Water Association (IWA) uses ILI as a performance
indicator for leakage which adjusts the measured loss, taking into
account the service pressure and the length of the network
ILI, is the current annual real losses expressed as a multiple of each
system’s specific UARL
ILI measures how effectively the infrastructure activities such as repairs,
active leakage control and pipeline/assets management are being
managed at current operating pressure
TAKING COOPERATION FORWARD 24PERFORMANCE INDICATOR
FOR WATER LOSS
Physical loss assessment matrix
A simple matrix was published in 2005 which provides insight into typical ILI
values for different situations. This approach can be used to classify the leakage
levels for utilities in developed and developing countries into four categories:
Category A: Further loss reduction may be uneconomic unless there are
shortages; careful analysis needed to identify cost-effective improvement
Category B: Potential for marked improvements; consider pressure
management; better active leakage control practices and better network
maintenance
Category C: Poor leakage record; tolerable only if water is plentiful and cheap;
even then, analyse level and nature of leakage and intensify leakage reduction
efforts
Category D: Highly inefficient; leakage reduction programs imperative and
have high priority
TAKING COOPERATION FORWARD 25PERFORMANCE INDICATOR
FOR WATER LOSS
Physical loss assessment matrix
(Source: R. Liemberger and R. McKenzie, 2005)
TAKING COOPERATION FORWARD 26IWA LEAKAGE MANAGEMENT
1. Pressure management (PM)
Pressure management “is the practice of managing system pressures to the optimum
levels of service ensuring sufficient and efficient supply, while
o reducing unnecessary or excess pressures
o eliminating transients and faulty level controls
o reducing the impact of theft
all of which cause the distribution system to leak unnecessarily” (IWA WLSG definition).
It is widely accepted that pressure management reduces leak flow rates and the
frequency of leaks in older mains and services, which in turn can extend infrastructure
life
Reduction of excess pressure and pressure transients assists all other interventions of
leakage management
Active leakage control without pressure management is often ineffective
Service reservoirs are an excellent way of controlling pressures in the network as well as
providing storage, but they can be a source of water loss from leakage and overflows,
necessitating continuous monitoring
TAKING COOPERATION FORWARD 27IWA LEAKAGE MANAGEMENT
2. Speed and quality of repairs
Repairing known leaks promptly and effectively is one of the simplest and
most cost effective ways of reducing leakage
Known leaks are leaks which have been found by active leakage control.
These have to be repaired at some point in time. However, the aim should
be to avoid excessive repair time
The quality of repairs should be monitored by utility staff to minimize the
risk of a repeat leak. Valve operations to isolate a section of main for
repair should be carried out in a manner that reduces the risk of
introducing pressure transients, which could cause additional leaks
If there are contracts for leakage repairs, there should be a service level
agreement (SLA) which provides an incentive to the contractor to conduct
repairs within a set time period, and/or a penalty for failing to do so
TAKING COOPERATION FORWARD 28IWA LEAKAGE MANAGEMENT
3. Active Leakage Control
Active leakage control (ALC) is the monitoring of network flows on a
regular basis to identify occurrence of new leaks or bursts earlier, so
that they can be repaired as soon as possible
ALC consists of two stages:
o Leak monitoring and localisation
o Leak location and pinpointing
TAKING COOPERATION FORWARD 29IWA LEAKAGE MANAGEMENT
Leak monitoring and localisation
The purpose is to identify the area of the network in which leakage is occurring
in order to prioritise field survey
A popular approach is to divide the network into District Metered Areas (DMAs)
by shutting valves permanently and installing meters equipped with telemetry
data loggers, allowing continuous monitoring of zone consumption from which
an estimate of leakage can be made
Another method, the mobile waste metering, involves valves being shut
temporarily and mobile meters installed in vans and connected via flexible
hoses to permanent connections in the network, being used to measure flows
A hybrid system involves permanently installed meters with the boundary
valves being closed temporarily to measure a night flow
Recent developments in software linked to hydraulic network models or
artificial intelligence routines use flow and pressure data to identify new
leaks and suggest hot spots where field surveys should be carried out
TAKING COOPERATION FORWARD 30IWA LEAKAGE MANAGEMENT
In areas where it is not practical or economic to install DMAs or waste
meter areas, such as in city centres or within larger DMAs, leaks may be
localised using acoustic data loggers which can be installed permanently or
temporarily. There are various systems on the market, some of which
automatically send an alarm when a new leak occurs
Another alternative to DMAs is the use of so-called virtual DMAs (or virtual
zone monitoring) which monitor flow only or combinations of flow and/or
pressure and/or noise at strategic points, with software identifying any
changes from the normal pattern which could indicate a new leak (“multi-
parameter measurement”)
Within a DMA, the leak can be further localised by shutting valves inside
the DMA to isolate sections of main, or by operating valves to move the
boundary of the DMA temporarily, in a process known as step testing. When
the section of network containing the leak is isolated the drop in flow rate
into the DMA will be greater than that which would be expected due to
isolating customer consumption alone
TAKING COOPERATION FORWARD 31IWA LEAKAGE MANAGEMENT
District Metered Areas (DMAs)
A hydraulic model can be used to calculate the optimal design of a DMA.
The optimum size of a DMA depends on a number of factors including:
The operating environment, whether it is urban, sub-urban or rural
The configuration of the distribution network taking into account natural breaks
created by rivers, major roads and open spaces
The balance between a preference for single feed DMAs and the need to include
multiple feeds for added security of supply
The rate of rise of unreported leakage and the required economic frequency of
ALC intervention
The method of data collection and analysis
IWA proposes in its DMA Guidance Notes a zone size of 500 up to 3,000
connections. In large zones, leakage-related flow rate changes are difficult
to detect.
TAKING COOPERATION FORWARD 32IWA LEAKAGE MANAGEMENT
Leak location and pinpointing
Once a leak has been localised it can be located and pinpointed using a
variety of techniques to indicate the general leak location, or to
pinpoint it prior to excavation in order to conduct repairs
As well as being used for un-reported leaks, these techniques are also
used for reported leaks, around where water is present on the surface
Location and pinpointing techniques include acoustic and non-acoustic
techniques
TAKING COOPERATION FORWARD 33IWA LEAKAGE MANAGEMENT
Leak detection methods and their suitability for types of mains
(Source: EU Reference document good practices leakage management WFD CIS WG PoM)
TAKING COOPERATION FORWARD 34IWA LEAKAGE MANAGEMENT
4. Infrastructure management
Infrastructure management includes asset renewal to reduce the rate of
occurrence of new leaks and investment in facilities such as DMAs and
telemetry to improve the efficiency of ALC operations
Good infrastructure management (asset renewal policy and strategy) supports
the leakage management programme and the associated operational activities
In areas with high burst frequencies and/or rates of rise of leakage, an
economic decision can be taken to continue repairing the assets or whether to
replace them
As an option for reducing leakage, asset replacement is an expensive option
compared to active leakage control (ALC) and pressure management (PM).
However, in some systems, the condition of the underground assets is so poor
that ALC and PM are not sustainable solutions
TAKING COOPERATION FORWARD 35CASE STUDY: AARHUS, DENMARK
Measures taken by Aarhus water utility to reduce water loss
Aarhus Water (Aarhus Vand) - the utility in Denmark‘s second largest
city supplies 250,000 customers with water and produces 16 million m3
of drinking water a year
Efforts to reduce water losses have been ongoing since the mid 70‘s
Over the last 10 years, Aarhus Water managed to reduce its NRW to 6%
and the real pipe loss is only 1.4 m3/km/day
The Infrastructure Leakage Index (ILI) is down to 0.83
Adopted methods:
o Infrastructure management
o High quality construction work
o Leakage detection
o Pressure management
o Monitoring DMA night flows
o Intelligent pipe replacement programme
TAKING COOPERATION FORWARD 36CASE STUDY: AARHUS, DENMARK
Water losses in Aarhus
Water loss in %
(Source: http://www.vpu-aarhus.dk/globalassets/filer/om-os/publikationer/profilbrochure_aarhus_water.pdf)
TAKING COOPERATION FORWARD 37CASE STUDY: AARHUS, DENMARK
(Source: https://stateofgreen.com/en/publications/)
TAKING COOPERATION FORWARD 38CASE STUDY: MILAN, ITALY
Measures taken by MM to reduce water losses
Since 2003, MM (Metropolitan Milanese SPA) manages the Water Service of
Milan, handling groundwater withdrawal, purification, distribution,
wastewater collection and treatment and the maintenance and investment
plan of the water supply and wastewater networks (230 million m3 of drinking
water distributed annually).
MM regularly monitors the losses in network and adopts a strategy for reducing
them, which consists of:
Analyses of losses using common methods and terms, recognized and
approved at an international level (IWA – Water Balance)
Corrective actions through field inspections and checks, electroacoustic
measures (correlator, noise logger, geophone, acoustic water leak detector,
etc.), advanced meter management and pressure control
(Source: https://www.mmspa.eu/wps/portal/mmspa/en/home/mm-for-milan/the-water-service/water-losses/)
TAKING COOPERATION FORWARD 39CASE STUDY: MILAN, ITALY
With regard to real (physical) losses, MM carries out the following
activities:
Statistical analysis and georeferencing of hidden and evident losses
Analysis of network pipes subject to several consecutive breakages
Drawing up of water balances using standard methods
Management of leak location and repair campaign (asset management
system)
Pressure management
Leak detection: location of hidden leaks in the distribution system
TAKING COOPERATION FORWARD 40CASE STUDY: MILAN, ITALY
With regard to apparent losses, MM deals with meters management:
Analysis of the age of the meters and user consumption values
Laboratory tests on a sample of meters
Data logging of the user consumption values (recording, transmission and
analysis of the consumption profiles of specific types of user)
The use of a smart metering system ensures an efficient water management
and enables pipes to be replaced and repaired quickly. Customers also profit
from additional services, which include:
Daily communication of the consumption levels and data recorded through
identification of abnormal behaviour (high consumption levels, losses, etc.)
More accurate and regular reading of the user device through a bill based
on actual consumption, reducing the number of disputes
Drawing up of network and area reports through a continuous, synchronous
loss monitoring
TAKING COOPERATION FORWARD 41BENEFITS OF WLR PROGRAMME
Benefits of a water loss reduction (WLR) programme
for consumers and utilites
Reduced water losses and increased revenues
Reduced stress on local water resources
Reduced energy consumption for abstraction, treatment and
distribution
A more stable water supply
Better support for decision making and customer service due
to new management systems
Improved water quality due to optimised water distribution
A strong basis for setting up a long-term rehabilitation and
investment plan for the network
TAKING COOPERATION FORWARD 42BARRIERS TO WLR
Overcoming barriers and creating political awareness
Failure to successfully reduce NRW is often casued by:
o An underestimation of the technical difficulties
o Complexity of the NRW management
o Lack of understanding of the potential benefits of taking actions
Subsidised water prices may also act as barriers (costs and benefits
of investing in NRW reduction will be less transparent)
Overcoming barriers requires involvement of several stakeholders
(politicans, water utilities, consumers), as well as new partnerships
The right framework conditions can create incentives for innovation
and optimisation as well as increase public awareness on the value
of having a stable and efficient water supply
TAKING COOPERATION FORWARD 43BARRIERS TO WLR
Barriers to WLR reduction in a water utility
Lack of political awareness
Inaccurate data
NRW is ususally not connected to overall sustainability goals
Focus on purchasing price rather than Total Cost of Ownership
Fear of a negative image
Corruption leads to inefficent NRW projects
TAKING COOPERATION FORWARD 44CONCLUSIONS
How to achieve and maintain a low level of NRW?
Develop a holistic NRW master plan based on the analysis of the current
NRW and the state of the water distribution network, which can serve as
the basis for upcoming investment plans and their projected returns
This is followed by a continuous focus on monitoring and optimising the
water distribution to maintain a low NRW level
Ongoing monitoring and pressure management are best carried out by
breaking down the distribution system into smaller DMAs
The quality of installed components such as valves, pumps, pipes and
metres etc. also play a key factor in reducing the water loss, since
operating costs and repairs are often more expensive than the product
itself
Carrying out a successful NRW programme requires commitment from all
organistional levels as well as trained staff, who work continuously on
keeping NRW levels low
Capacity building at all staff levels in the utility is a key element
TAKING COOPERATION FORWARD 45REFERENCES
EU Reference document good practices in leakage management WFD CIS WG PoM.
Main Repor.t European Commission, 2015
https://circabc.europa.eu/sd/a/1ddfba34-e1ce-4888-b031-
6c559cb28e47/Good%20Practices%20on%20Leakage%20Management%20-%20Main%20Report_Final.pdf
Europe‘s water in figures. An overview of the European drinking water and
wastewater sectors (2017) EurEau The European Federation of National
Associations of Water Services, Belgium
http://www.eureau.org/resources/publications/1460-eureau-data-report-2017-1/file
Grundfos (2014) Pressure management – An effective way to reduce Non-Revenue
Water, improve energy efficiency and reduce operation and maintenance costs.
White paper
http://www.studiomarcofantozzi.it/w/wp-content/uploads/2015/03/Whitepaper_English.pdf
Capacity Development for Drinking Water Loss Reduction: Challanges and
Experiences (2011) UN-Water Decade Programme on Capacity Development (UNW-
DPC). Editors: Hani Sewilam and Karl-Ulrich Rudolph. United Nations University.
UN Campus, Bonn
https://www.uni-wh-ieem.de/download/dwlr-unw-dpc-2011.pdf
TAKING COOPERATION FORWARD 46REFERENCES
Hamilton, S. and R. McKenzie (2014). Water Management and Water Loss. IWA
Publishing
Hamilton, S. and B. Charalambous (2013) Leak Detection – Technology and
Implementation, IWA Publishing
Deutsche Gesellschaft für Internationale Zusammenarbeit (GIZ) (2011) Guidelines
for water loss reduction – A focus on pressure management. Eschborn, Deutschland.
On behalf of Federal Ministry for Economic Cooperation and Development
https://www.researchgate.net/profile/Emmanuel_Oertle2/publication/318792810_Guidelines_for_water_loss_r
eduction_-_a_focus_on_pressure_management/links/5ad5bb32458515c60f54c66c/Guidelines-for-water-loss-
reduction-a-focus-on-pressure-management.pdf
REDUCING URBAN WATER LOSS - How water utilities can improve efficiency and
meet future demand for water by reducing Non-Revenue Water (2016). Think
Denmark. White papers for a green Transition. State of Green and Danish Water
Forum (DWF)
https://stateofgreen.com/en/publications/
TAKING COOPERATION FORWARD 47REFERENCES
R. Liemberger and R. McKenzie, ”Accuracy Limitations of the ILI: Is It an
Appropriate Indicator for Developing Countries?” Conference Proceedings,
IWA Leakage 2005 Conference in Halifax, Nova Scotia, Canada
https://pdfs.semanticscholar.org/672a/e37afa679d2b7b612d864b689aada58acbfe.pdf
Lambert, A. (2003) Water 21 - Article No 2 Assessing Non-Revenue Water and its
Components: A Practical Approach. IWA Water Loss Task Force. International Water
Association (IWA)
http://www.pacificwater.org/userfiles/file/Water%2021%20-%20Article%20No_%202%20-
%20Assessing%20NRW.pdf
District Metered Areas (DMAs) – Guidance Notes. International Water Association
(IWA), 2007
https://iwa-network.org/learn_resources/district-metered-areas-guidance-notes-version-1/
TAKING COOPERATION FORWARD 48You can also read